Pick Pony's Past Performance Sheets are like no other on the market today. Our advanced AI analyzes official race data to produce a racing form that makes it easy to visualize race data and handicap a winning bet.
Header

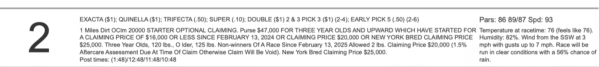
The PPS header is the topmost line on the racing form. It occurs at the beginning of each page for easy reference.
Track
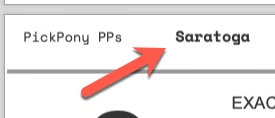
The track name is listed next to the Pick Pony logo. In this example, the race is held at Saratoga.
Race details
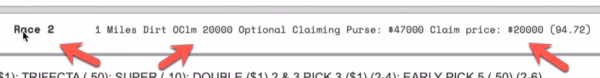
Race details include the race number, distance, race conditions (e.g. Optional Claiming), claim price. In parenthesis is the track record for this race format.
Date/time
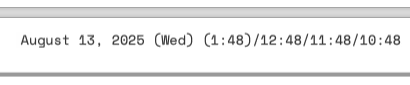
Finally, the header displays the race date/day and post times in Eastern, Central, Mountain, and Eastern time zones. The track's time zone is surrounded by parenthesis.
Heading
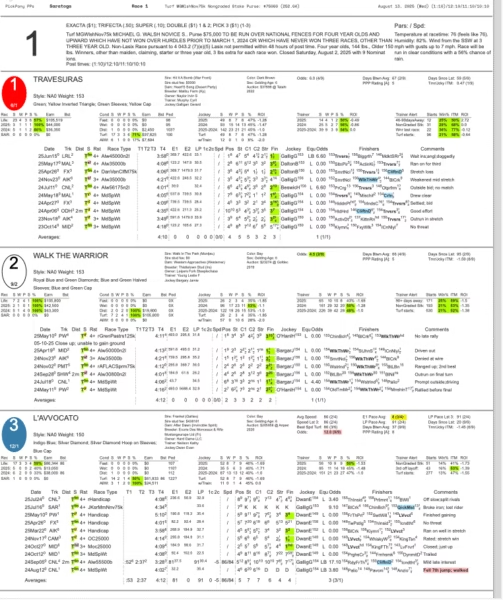
The Heading occurs at the beginning of the race card. It contains the race number as sell as all the details about the race, typical performance, and expected weather conditions.
Race number
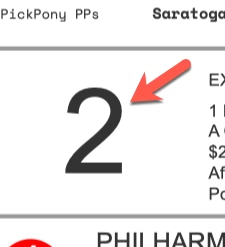
The race number is displayed in a large font. In this example, this is Race #2 at Saratoga.
Bets

The exotic wagers offered for this race are listed.
Race description
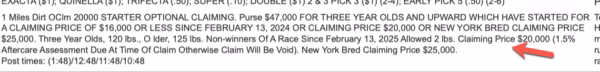
The (typically) larger paragraph in the card heading provides all the details about the race conditions.
Post times
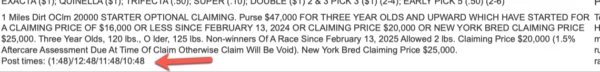
Post times are listed for easy reference. Times are displayed in Eastern, Central, Mountain, and Pacific time zones, with the tracks' time zone surrounded by parentheses.
Pars
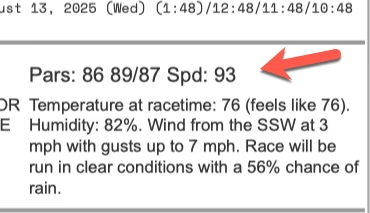
The pars for the race are listed. The first number indicates the expected early pace, followed by the mid/late paces. The speed par is listed last. These numbers reflect the average leader/winner of races at today's class level and distance and help you determine if a particular horse is outclassed in this race.
Weather
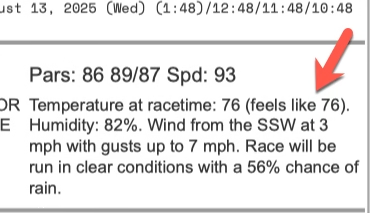
The expected weather conditions detail the temperature and other conditions at race time.
Horse data
Post Postion/Morning odds
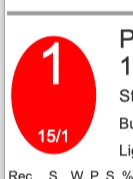
The post position is listed inside the oval circle. The color of the oval indicates the colors worn by the horse and jockey. The morning line odds are displayed at the bottom of the oval.
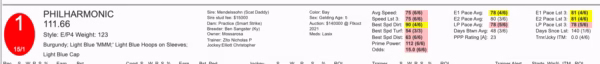
Horse physical characteristics
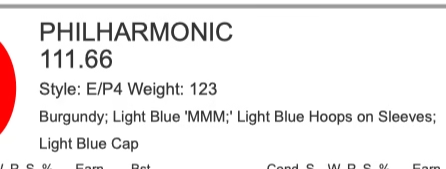
Next is the horse's name and Prime Power rating (e.g.. 111.66). The Prime Power is a number that measures the quality of each horse's most recent starts by combining dozens of handicapping factors into one easy-to-use rating. Speed, class, pace, form, weight, distance, and many more factors are combined by a sophisticated algorithm to form this rating.
Next is the horse's run style (E/P4). The running style of the horse can be any combination of the following:
- E (Early) = A horse that exhibits this run style is one that typically vies for the early lead or whose best races are run on the lead. Most horses in this category do not successfully rate behind a pacesetter.
- E/P (Early/Presser) = A horse that exhibits this run style is one that runs second or third within a few lengths of the lead early before trying to run down the leader. An “E/P” horse, just like an “E” horse, may run on the front end but, unlike an “E” horse, it can be expected to successfully rate behind a pace setter.
- P (Presser) = A horse that exhibits this run style is one that runs in the middle of the pack early before trying to run down the leader. A “P” horse may at times run close to the lead but rarely, if ever, challenges for the lead early. Unlike and “S” horse, the “P” horse doesn't typically run from the rear of the pack in its better races.
- S (Sustain or Closer) = A horse that exhibits this run style is one that runs in the back of the pack early before trying to run down the leader.
- P/S (Presser or Closer) = A horse that exhibits this run style is one that runs in the middle of the pack early before trying to run down the leader.
- NA (Not Available) = A horse that is a first-time starter or hasn't had enough meaningful running lines to accurately assess its preferred run style.
Following the run style is the amount of weight, including the jockey, the horse will carry for this race. If today's jockey is an apprentice, a smaller number will appear immediately to the right of the weight. This is the number of pounds that the jockey gets as a weight allowance for being an apprentice.
Below the weight, is the jockey silks. This provides information on who owns the horse and the color of the silks the jockey will be wearing in today's race.
Horse pedigree, sales, and personnel
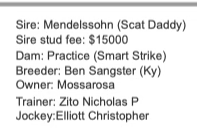
Details about the horse's sire, (the sire's sire) and current stud fee is followed by the dam and (the dam's sire). Finally, the breeder and the state or country in which the horse was bred, owner, trainer, and jockey details.
Identification/Transactions/Meds and equipment
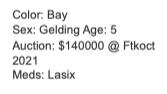
The color of the horse may be abbreviated.
- Ch. = chestnut
- Dkbbr. = dark bay or brown
- Gr/ro. = gray or roan
- Bl. = black
- Wh. = white
The sex of the horse may be abbreviated.
The age of the horse and month of birth (Two-year old and maidens only).
The sale at which the horse sold, the year of the sale, and the sales price.
Finally, details about the horse's current medications (Laxix) and/or equipment (e.g. blinkers on) is listed.
Averages and rankings
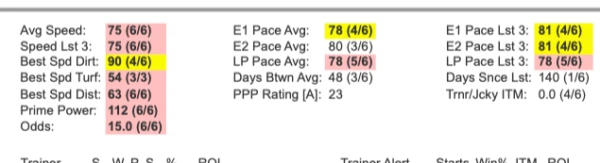
Pick Pony's PPS crunches the numbers for you to calculate various averages and “best” performances for the horse. The first number is the average or time. The numbers in parenthesis indicate the horse's ranking (e.g. 6 out of 6 horses in the race). These numbers are highlighted to indicate whether the horse's performance is above average, below average, or average. This makes it easy to quickly discern how the horse ranks in a variety of performance measurements.
In addition, a Pick Pony Performance (PPP) rating is calculated and given a letter grade (A through F).
Race stats

Horse historical stats
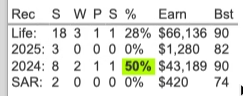
Historical stats include the number of stars, wins, places, shows, and the percentage of ITM (In-The-Money) finishes. This is followed by the total earnings and the horse's best speed rating (for any type of surface or race) for that time period. Note that stats for the current track are provided when available. Above and below average values are highlighted.
Surface/Conditions performance
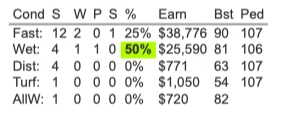
The Conditions Performance section includes stats about the horse's performance on various surfaces (e.g. dirt, turf) and racing conditions (e.g. dry, wet). Details for each category include the number of starts, wins, places, shows, percentage of ITM (In-The-Money) finishes, earning, best speed rating, and the horse's pedigree rating for that category (useful if the horse has limited experience in that category). Above and below average values are highlighted.
Jockey stats
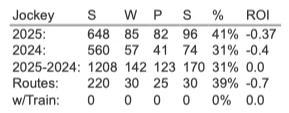
Jockey stats include starts, wins, places, shows, percentage ITM, and ROI (Return On Investment for every $2.00 wagered). These statistics are categorized in a variety of manners:
- The jockey's record for the meet (number of mounts, wins, shows, places, and win percentage).
- The jockey's record for the prior year (number of mounts, percentage of winners, percentage of in-the-money finishes, and ROI or return on investment for every $2.00 wagered).
- The jockey's record with horses of this run style (number of mounts, percentage of winners, percentage of in-the-money finishes, and ROI or return on investment for every $2.00 wagered).
- The jockey's record with the trainer in the L60 or last sixty days (number of mounts, percentage of winners, percentage of in-the-money finishes, and return on investment for every $2.00 wagered).
- The jockey's record at today's distance or surface (number of mounts, percentage of winners, percentage of in-the-money finishes, and return on investment for every $2.00 wagered).
Trainer stats
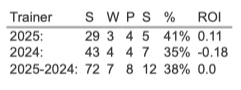
Trainer stats include starts, wins, shows, places, win percentage, and ROI. They may be categorized as:
- The trainer's record for the meet (number of starts, wins, shows, places, and win percentage).
- The trainer's record for the prior year (number of starts, percentage of winners, percentage of in-the-money finishes, and ROI or return on investment for every $2.00 wagered).
Trainer alerts
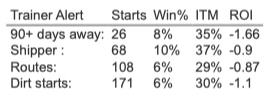
The trainer's record with race angles that pertain to today's race (Number of starts, percentage of winners, percentage of in-the-money finishes, and ROI of return on investment for every $2.00 wagered). The statistics in this category cover the last three years.
Race lines
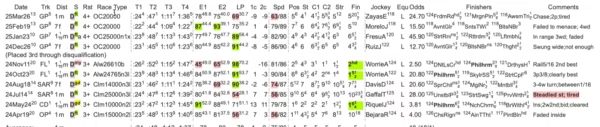
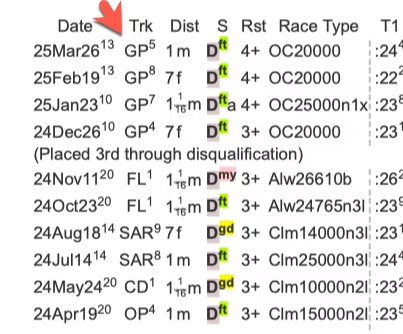
Race date
The race lines begin with the race date (25Mar26). The superscript (e.g. 13) shows the track variant for that day. The track variant indicates how many points below par the times for all races at the distance on the same surface were that day.
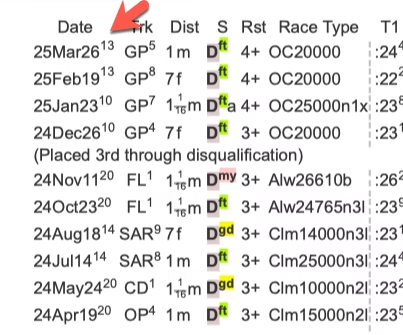
Track
Next is the track code (e.g. GP) with the race number rendered as the superscript (e.g. 5).
Distance
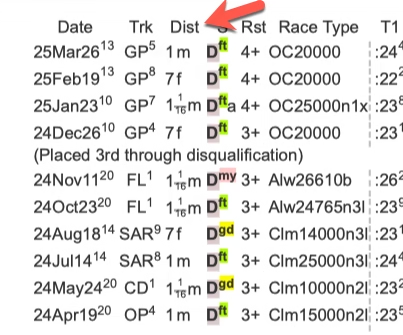
The Race Distance (e.g. 1m, 7f) indicates the distance the race was run at.
Surface
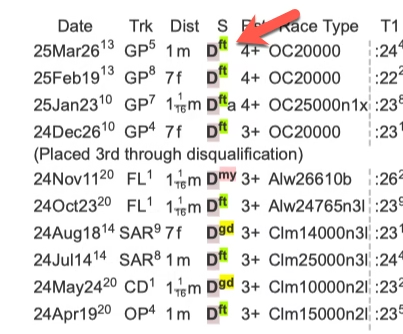
Next is the race distance followed by the track surface type. Surface types include:
- D – dirt
- T – turf
- S – synthetic
The superscript of the surface type indicates the condition of the surface for that race.
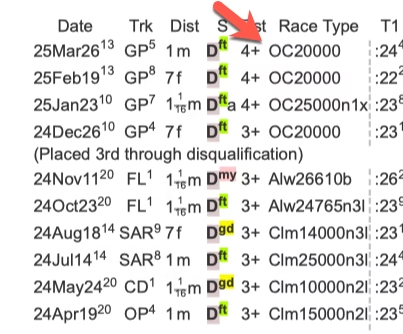
Restrictions
The age designation for the race (e.g. 3+) follows the surface type. A race designated with 3 would be a race for three-year-olds and up. A race3 designated with 4 would be a race for four-year-olds and up. No designation means that the race was age-specific.
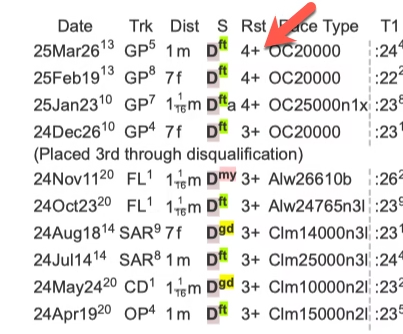
Race type
Next is the Race Type which tells the conditions for the race. For more information on race type, see Types of Horse Classes and races, progressions, and class change considerations.
Timings
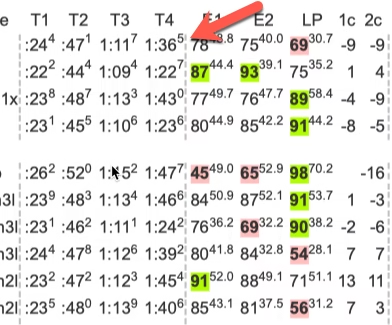
The Timings show the fractional times throughout the race including the final time in the T4 column. The superscript indicates fractional seconds in 1/10 format for easy analysis.
Pace
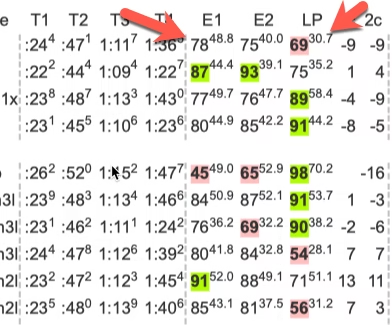
E1 is a pace rating that measures how fast the horse ran from the start to the first call of the race. ( 2f Pace in sprints, 4f Pace in routes). The superscript provides a feet-per-second (FPS) calculation for that fraction of the race.
E2 is a pace rating that measures how fast the horse ran from the start to the second call of the race. (4f Pace in sprints, 6f Pace in most routes). The superscript provides a feet-per-second (FPS) calculation for that fraction of the race.
LP is a pace rating that measures how fast the horse ran from the second call of the race to the finish. The superscript provides a feet-per-second (FPS) calculation for that fraction of the race.
Race shape
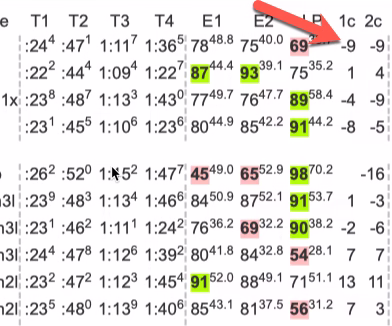
1c and 2c are the Race Shapes. The first Race Shape value corresponds to the first call (2f call for most sprints; and 4f call for most routes). The second Race Shape value corresponds to the second call (4f call for most sprints; and 6f call for most routes). They measure how fast the leader ran relative to the average leader time (for all races at this distance) for the race's final time. The faster the leader's pace, the higher the Race Shape (e.g. +7). The slower the leader's pace, the lower the Race Shape (e.g. -7). For instance, a Race Shape of (+17 +19) indicates a fast pace.
A primary use of the Race Shapes is to quickly identify horses that were advantaged/disadvantaged by unusually fast or slow-paced races. Generally speaking, horses with a late running style want a fast pace upfront to be most effective. Conversely, horses with an early running style want a softer pace to be most effective. So, whenever a pace is unusually fast or slow, evaluate whether the horse was advantaged or disadvantaged by the pace.
Speed rating
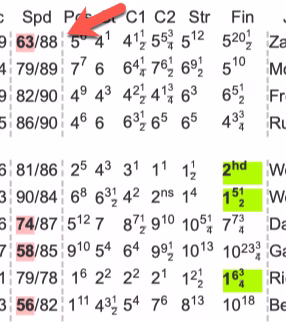
SPD is the Speed Rating and measures how fast the horse ran the race from start to finish. The number after the “/” is the speed par for that race. This lets you see how the horse's speed corresponded to other horses in that race class.
Position during race
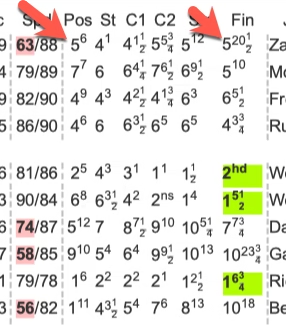
Pos indicates the horse's post position. The remaining numbers show the horse's position in the field and lengths behind (as the superscript) or in front at the ST (start), 1C (First Call of the race), 2C (Second Call of the race), and Str (Stretch Call of the race), FIN where the horse finished the race and his number of lengths behind or in front at the Finish.
Jockey
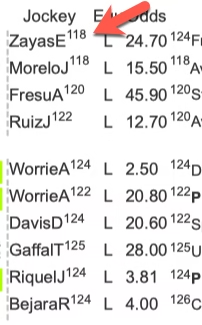
The name of the jockey that rode the horse and the amount of weight the horse carried, including the jockey.
Equipment
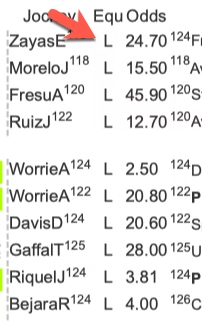
The medication the horse was using during the race. L = Lasix, B = Bute.
The equipment the horse was using during the race. b = blinkers, f = front wraps.
Odds
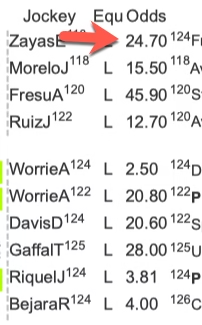
The final ODDS the horse went off at.
Finishers
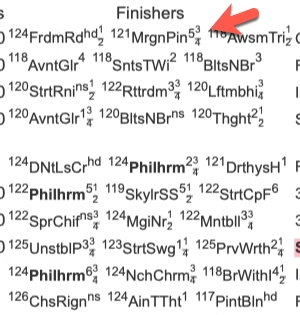
The top three finishers in the race with lengths separating them at the finish. Horse's in today's race are in bold.
Comments
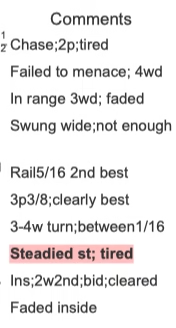
The comment will tell about the trip the horse had or how he or she ran the race.
Averages

The averages line follows the race lines and shows a computed average of all values in that column. This lets you analyze the horse's relative performance for *any* value in the race line.
Works
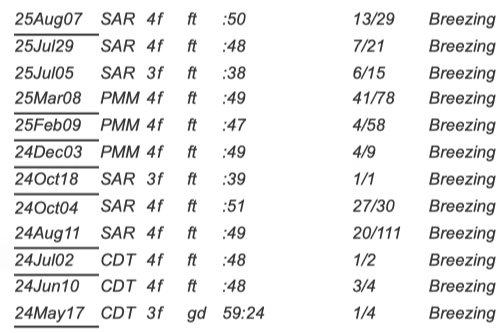
Works date
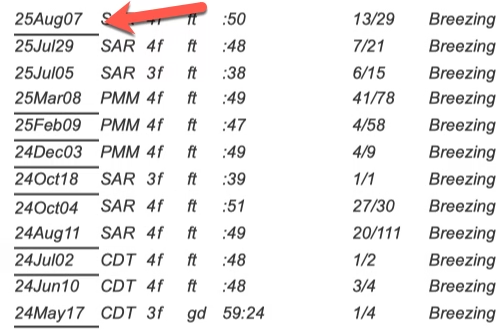
The date of the workout. If a appears before the date, that means that the work was a bullet or the fastest at that distance for the day.
Works location
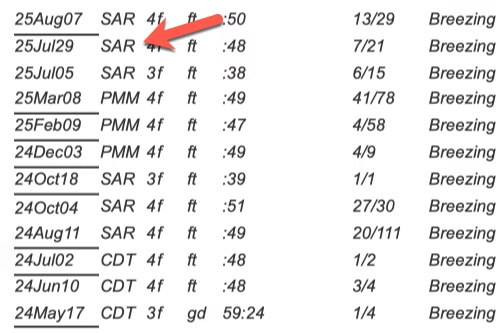
The track code for the location of the workout.
Distance/Track condition
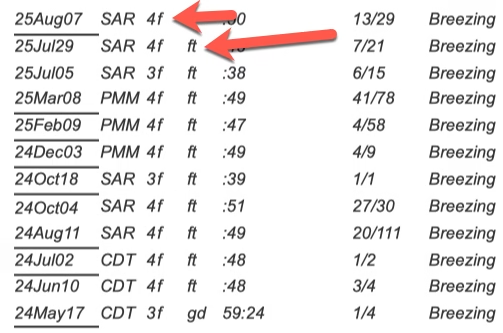
The distance of the work and the condition of the track. If a t appears beside the track name, then the work took place at the training track. O means that the work was on the turf. Some works may occur around “the dogs” (d), a term used to describe the situation where cones are put out on the track to keep horses from working too close to the rail. This most commonly occurs on turf courses that have been saturated with water or turf courses where there has been a lot of wear near the rail and the track attendants try to protect it as much as possible.
Time
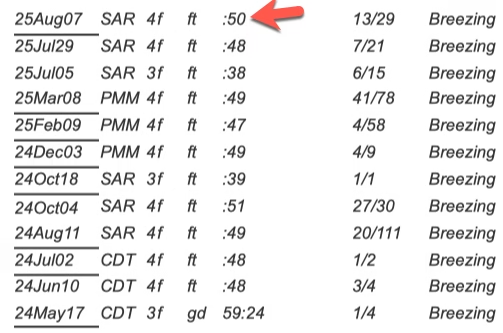
The time of the work.
Ranking
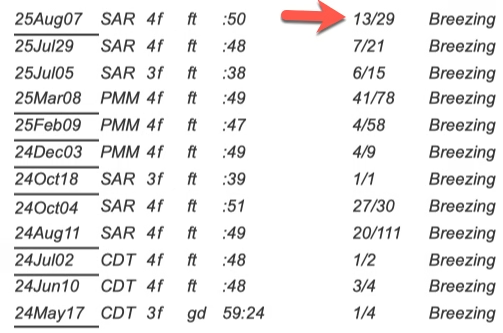
The ranking of the workout. If a horse was 53/70, that means that he ran the 53rd best time of 70 horses that worked at the distance.
Comments
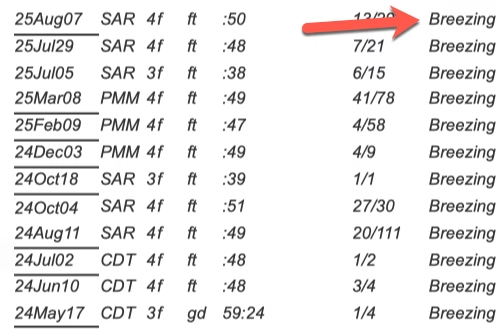
How the horse worked. B = Breezing (easy), H = Handily (with urging from the rider). If the horse worked from the gate, it will be denoted with a g.
Graphical heatmaps

Our Past Performance sheets contain heatmaps for every race. These vibrant displays bring speed ratings, jockey and trainer statistics, works rankings, E1/E2/LP pace, days between races, and more. Our heatmaps use a color gradient from dark red to dark green – the darker the green, the better the stat value – allowing you to easily identify patterns, cycles, and trends in a horse's performance. The first column represents the most recent race – the last column represents the earliest race.
In the example below. Super Cindy had a 7.0 Bris speed rating 10 races ago. In her most recent race, she had a 75 speed rating. The more recent ratings are a darker green indicating an improvement from earlier races. However, there are other horses with darker green ratings which indicating better speed ratings than Super Cindy.
Speed trend charts

We include a speed trends chart for every horse in the race that graphs the horse's speed progression over time. The solid blue line indicates the speed, while the dashed blue line paints a picture of the speed trend. The dark orange dashed line is the horse's average speed. Dashed-green and red lines are “fast” and “slow” moving averages that act like “Bollinger bands” in a financial chart. Notice how the speed line bounces around between the dashed green and red Bollinger bands. When a speed line comes close to touching a “Bollinger band”, you can expect the speed rating to “bounce” off the line so that it remains within the Bollinger bands. It's a time-proven statistic in the financial world that works in the horse racing world, too.
Pace trend charts

Pick Pony Past Performance sheets include a trend chart for every horse in the race. We include trend lines for E1, E2, and LP pace. Green is E1 pace, Blue is E2 pace, and Red is late pace. The steepness of the line indicates the degree of the trend for each pace as calculated by our AI.
Feet-per-second charts

Many believe feet-per-second calculations revolutionalized horse race analysis. We do the cumbersome calculations for you and integrate the feet-per-second calculations directly in the race lines plus provide a FPS chart for every horse in the race. The green line is the FPS for the first fraction, blue is the critical turn time (second) fraction, and red in the FPS of the final fraction. Dashed lines indicate the trend for each FPS fraction.
Race summaries

Unleash the power of past performance data with our comprehensive horse racing summaries! Dive into the heart of the race with wide-ranging data points, covering everything from overall averages to the nitty-gritty of speed, pace, and turf performance.
Pick Pony Single Page Summary
Finally, our Single Page Summary (available with some subscription plans) provides our AI predictions which summarize and rank all the major statistics for each horse in a concise, single-page view.
Handicapping toolsets
Your Pick Pony subscription also comes with an array of handicapping toolsets. Look forward to our unique betting diary (coming soon) which cleverly links your uploaded Bris race data to a handicapping worksheet. This not only assists in calculating underlays and overlays, but doubles as a betting log book, keeping you updated on your bets and winnings.
Example Pick Pony Past Performances sheet
Check out this PDF example Pick Pony Past Performances sheet from 2024 that is suitable for display on a desktop device..
How to generate a Pick Pony Past Performance Report
We guide you through the creation of your personalized past performance report. Just purchase your datafile from Brisnet and send it to our system. In a matter of minutes, your tailored report will be ready. We ensure you're always in the loop, sending notifications both within our platform and via email.
