Chart Guide (2.0.03)
- Bubbles
- Color = surface: green (turf), brown (dirt), blue (synthetic)
- Number = finishing position
- Height above line = beaten lengths — closer means a smaller margin
- Border = track conditions: green (FST/GD/FM), yellow (WF/SL/YLD), red (SY/MY/FRZ/SFT/HVY)
- Connecting Line
- Solid = good conditions; dashed = bad conditions
- Line Symbol
- ▲ Triangle = sprint (7f or less); ● Circle = route (more than 7f)
- Bubble Size
- Color (brown-dirt, green-turf) and border (red-bad, green-good) convey surface and track conditions
- Shaded Band (Bollinger)
- Highlights volatility — a wider band means more variation in recent performance
- Performance Trend
- Straight line showing the overall performance direction — angled up = improving, angled down = declining
- Dashed Reference Line
- AI Opponent = AI analysis class-level par for the race
| Stat | vs. Current Card | vs. All Horses |
|---|---|---|
| Averages
Career-average metrics across all AI race analysis. Performance and pace averages reflect estimated historical performance; trainer and jockey grades score in-the-money percentages. Grading scale: A = elite • B = above average • C = average • D = below average • F = poor • — = no data |
||
| Pick Pony AI Rating | C | D |
| Speed | D | F |
| Early Pace | C | D |
| Mid Pace | C | D |
| Late Pace | D | F |
| Finish Pos | D | F |
| Dirt Speed | C | D |
| Turf Speed | C | D |
| Distance Speed | D | F |
| Trainer Effectiveness | F | F |
| Jockey Effectiveness | D | F |
| 3rd Party Ratings | F | F |
| Recent
Performance analysis from the horse's recent races, weighted to reflect current form. Sprint and Route FPS (Foot Per Second) measure pace efficiency over the horse's recent sprints and routes respectively. Grading scale: A = elite • B = above average • C = average • D = below average • F = poor • — = no data |
||
| Speed | C | F |
| Early Pace | C | D |
| Mid Pace | C | D |
| Late Pace | D | F |
| Sprint FPS | A | A |
| Route FPS | A | B |
| Trainer Effectiveness | F | F |
| Jockey Effectiveness | D | F |
| 3rd Party Ratings | F | F |
| Predictions
AI-generated projections for the upcoming race, derived from prior AI analysis for speed and pace trends, surface and distance suitability, and current conditions. Grading scale: A = elite • B = above average • C = average • D = below average • F = poor • — = no data |
||
| Speed | A | B |
| Early Pace | A | B |
| Mid Pace | A | C |
| Late Pace | C | C |
A paid membership is required to view all stats. Subscribe now →
Chart Guide (2.0.03)
- Bubbles
- Color = surface: green (turf), brown (dirt), blue (synthetic)
- Number = finishing position
- Height above line = beaten lengths — closer means a smaller margin
- Border = track conditions: green (FST/GD/FM), yellow (WF/SL/YLD), red (SY/MY/FRZ/SFT/HVY)
- Connecting Line
- Solid = good conditions; dashed = bad conditions
- Line Symbol
- ▲ Triangle = sprint (7f or less); ● Circle = route (more than 7f)
- Bubble Size
- Color (brown-dirt, green-turf) and border (red-bad, green-good) convey surface and track conditions
- Shaded Band (Bollinger)
- Highlights volatility — a wider band means more variation in recent performance
- Performance Trend
- Straight line showing the overall performance direction — angled up = improving, angled down = declining
- Dashed Reference Line
- AI Opponent = AI analysis class-level par for the race
| Stat | vs. Current Card | vs. All Horses |
|---|---|---|
| Averages
Career-average metrics across all AI race analysis. Performance and pace averages reflect estimated historical performance; trainer and jockey grades score in-the-money percentages. Grading scale: A = elite • B = above average • C = average • D = below average • F = poor • — = no data |
||
| Pick Pony AI Rating | A | D |
| Speed | B | F |
| Early Pace | A | B |
| Mid Pace | A | B |
| Late Pace | A | D |
| Finish Pos | F | F |
| Dirt Speed | A | D |
| Turf Speed | A | C |
| Distance Speed | A | C |
| Trainer Effectiveness | C | D |
| Jockey Effectiveness | B | D |
| 3rd Party Ratings | B | F |
| Recent
Performance analysis from the horse's recent races, weighted to reflect current form. Sprint and Route FPS (Foot Per Second) measure pace efficiency over the horse's recent sprints and routes respectively. Grading scale: A = elite • B = above average • C = average • D = below average • F = poor • — = no data |
||
| Speed | D | F |
| Early Pace | A | C |
| Mid Pace | A | C |
| Late Pace | A | D |
| Sprint FPS | C | D |
| Route FPS | C | D |
| Trainer Effectiveness | C | D |
| Jockey Effectiveness | B | D |
| 3rd Party Ratings | B | F |
| Predictions
AI-generated projections for the upcoming race, derived from prior AI analysis for speed and pace trends, surface and distance suitability, and current conditions. Grading scale: A = elite • B = above average • C = average • D = below average • F = poor • — = no data |
||
| Speed | D | F |
| Early Pace | B | C |
| Mid Pace | B | D |
| Late Pace | C | C |
A paid membership is required to view all stats. Subscribe now →
Chart Guide (2.0.03)
- Bubbles
- Color = surface: green (turf), brown (dirt), blue (synthetic)
- Number = finishing position
- Height above line = beaten lengths — closer means a smaller margin
- Border = track conditions: green (FST/GD/FM), yellow (WF/SL/YLD), red (SY/MY/FRZ/SFT/HVY)
- Connecting Line
- Solid = good conditions; dashed = bad conditions
- Line Symbol
- ▲ Triangle = sprint (7f or less); ● Circle = route (more than 7f)
- Bubble Size
- Color (brown-dirt, green-turf) and border (red-bad, green-good) convey surface and track conditions
- Shaded Band (Bollinger)
- Highlights volatility — a wider band means more variation in recent performance
- Performance Trend
- Straight line showing the overall performance direction — angled up = improving, angled down = declining
- Dashed Reference Line
- AI Opponent = AI analysis class-level par for the race
| Stat | vs. Current Card | vs. All Horses |
|---|---|---|
| Averages
Career-average metrics across all AI race analysis. Performance and pace averages reflect estimated historical performance; trainer and jockey grades score in-the-money percentages. Grading scale: A = elite • B = above average • C = average • D = below average • F = poor • — = no data |
||
| Pick Pony AI Rating | A | D |
| Speed | A | F |
| Early Pace | B | D |
| Mid Pace | B | D |
| Late Pace | B | D |
| Finish Pos | A | C |
| Dirt Speed | B | D |
| Turf Speed | C | D |
| Distance Speed | B | D |
| Trainer Effectiveness | A | B |
| Jockey Effectiveness | A | C |
| 3rd Party Ratings | A | D |
| Recent
Performance analysis from the horse's recent races, weighted to reflect current form. Sprint and Route FPS (Foot Per Second) measure pace efficiency over the horse's recent sprints and routes respectively. Grading scale: A = elite • B = above average • C = average • D = below average • F = poor • — = no data |
||
| Speed | A | F |
| Early Pace | A | B |
| Mid Pace | C | D |
| Late Pace | B | D |
| Sprint FPS | A | A |
| Route FPS | A | B |
| Trainer Effectiveness | A | B |
| Jockey Effectiveness | A | C |
| 3rd Party Ratings | A | D |
| Predictions
AI-generated projections for the upcoming race, derived from prior AI analysis for speed and pace trends, surface and distance suitability, and current conditions. Grading scale: A = elite • B = above average • C = average • D = below average • F = poor • — = no data |
||
| Speed | C | F |
| Early Pace | A | B |
| Mid Pace | A | D |
| Late Pace | C | C |
A paid membership is required to view all stats. Subscribe now →
Chart Guide (2.0.03)
- Bubbles
- Color = surface: green (turf), brown (dirt), blue (synthetic)
- Number = finishing position
- Height above line = beaten lengths — closer means a smaller margin
- Border = track conditions: green (FST/GD/FM), yellow (WF/SL/YLD), red (SY/MY/FRZ/SFT/HVY)
- Connecting Line
- Solid = good conditions; dashed = bad conditions
- Line Symbol
- ▲ Triangle = sprint (7f or less); ● Circle = route (more than 7f)
- Bubble Size
- Color (brown-dirt, green-turf) and border (red-bad, green-good) convey surface and track conditions
- Shaded Band (Bollinger)
- Highlights volatility — a wider band means more variation in recent performance
- Performance Trend
- Straight line showing the overall performance direction — angled up = improving, angled down = declining
- Dashed Reference Line
- AI Opponent = AI analysis class-level par for the race
| Stat | vs. Current Card | vs. All Horses |
|---|---|---|
| Averages
Career-average metrics across all AI race analysis. Performance and pace averages reflect estimated historical performance; trainer and jockey grades score in-the-money percentages. Grading scale: A = elite • B = above average • C = average • D = below average • F = poor • — = no data |
||
| Pick Pony AI Rating | D | F |
| Speed | C | F |
| Early Pace | D | F |
| Mid Pace | D | D |
| Late Pace | C | F |
| Finish Pos | C | D |
| Dirt Speed | D | D |
| Turf Speed | C | D |
| Distance Speed | C | D |
| Trainer Effectiveness | C | D |
| Jockey Effectiveness | D | F |
| 3rd Party Ratings | D | F |
| Recent
Performance analysis from the horse's recent races, weighted to reflect current form. Sprint and Route FPS (Foot Per Second) measure pace efficiency over the horse's recent sprints and routes respectively. Grading scale: A = elite • B = above average • C = average • D = below average • F = poor • — = no data |
||
| Speed | B | F |
| Early Pace | D | F |
| Mid Pace | D | D |
| Late Pace | C | F |
| Sprint FPS | D | D |
| Route FPS | D | D |
| Trainer Effectiveness | C | D |
| Jockey Effectiveness | D | F |
| 3rd Party Ratings | D | F |
| Predictions
AI-generated projections for the upcoming race, derived from prior AI analysis for speed and pace trends, surface and distance suitability, and current conditions. Grading scale: A = elite • B = above average • C = average • D = below average • F = poor • — = no data |
||
| Speed | A | B |
| Early Pace | C | C |
| Mid Pace | D | F |
| Late Pace | C | C |
A paid membership is required to view all stats. Subscribe now →
Chart Guide (2.0.03)
- Bubbles
- Color = surface: green (turf), brown (dirt), blue (synthetic)
- Number = finishing position
- Height above line = beaten lengths — closer means a smaller margin
- Border = track conditions: green (FST/GD/FM), yellow (WF/SL/YLD), red (SY/MY/FRZ/SFT/HVY)
- Connecting Line
- Solid = good conditions; dashed = bad conditions
- Line Symbol
- ▲ Triangle = sprint (7f or less); ● Circle = route (more than 7f)
- Bubble Size
- Color (brown-dirt, green-turf) and border (red-bad, green-good) convey surface and track conditions
- Shaded Band (Bollinger)
- Highlights volatility — a wider band means more variation in recent performance
- Performance Trend
- Straight line showing the overall performance direction — angled up = improving, angled down = declining
- Dashed Reference Line
- AI Opponent = AI analysis class-level par for the race
| Stat | vs. Current Card | vs. All Horses |
|---|---|---|
| Averages
Career-average metrics across all AI race analysis. Performance and pace averages reflect estimated historical performance; trainer and jockey grades score in-the-money percentages. Grading scale: A = elite • B = above average • C = average • D = below average • F = poor • — = no data |
||
| Pick Pony AI Rating | F | F |
| Speed | F | F |
| Early Pace | F | F |
| Mid Pace | F | F |
| Late Pace | F | F |
| Finish Pos | A | B |
| Dirt Speed | F | D |
| Turf Speed | C | D |
| Distance Speed | D | F |
| Trainer Effectiveness | A | A |
| Jockey Effectiveness | A | A |
| 3rd Party Ratings | A | D |
| Recent
Performance analysis from the horse's recent races, weighted to reflect current form. Sprint and Route FPS (Foot Per Second) measure pace efficiency over the horse's recent sprints and routes respectively. Grading scale: A = elite • B = above average • C = average • D = below average • F = poor • — = no data |
||
| Speed | F | F |
| Early Pace | F | F |
| Mid Pace | F | F |
| Late Pace | F | F |
| Sprint FPS | F | F |
| Route FPS | F | F |
| Trainer Effectiveness | A | A |
| Jockey Effectiveness | A | A |
| 3rd Party Ratings | A | D |
| Predictions
AI-generated projections for the upcoming race, derived from prior AI analysis for speed and pace trends, surface and distance suitability, and current conditions. Grading scale: A = elite • B = above average • C = average • D = below average • F = poor • — = no data |
||
| Speed | F | F |
| Early Pace | F | F |
| Mid Pace | D | F |
| Late Pace | C | C |
A paid membership is required to view all stats. Subscribe now →
Chart Guide (2.0.03)
- Bubbles
- Color = surface: green (turf), brown (dirt), blue (synthetic)
- Number = finishing position
- Height above line = beaten lengths — closer means a smaller margin
- Border = track conditions: green (FST/GD/FM), yellow (WF/SL/YLD), red (SY/MY/FRZ/SFT/HVY)
- Connecting Line
- Solid = good conditions; dashed = bad conditions
- Line Symbol
- ▲ Triangle = sprint (7f or less); ● Circle = route (more than 7f)
- Bubble Size
- Color (brown-dirt, green-turf) and border (red-bad, green-good) convey surface and track conditions
- Shaded Band (Bollinger)
- Highlights volatility — a wider band means more variation in recent performance
- Performance Trend
- Straight line showing the overall performance direction — angled up = improving, angled down = declining
- Dashed Reference Line
- AI Opponent = AI analysis class-level par for the race
| Stat | vs. Current Card | vs. All Horses |
|---|---|---|
| Averages
Career-average metrics across all AI race analysis. Performance and pace averages reflect estimated historical performance; trainer and jockey grades score in-the-money percentages. Grading scale: A = elite • B = above average • C = average • D = below average • F = poor • — = no data |
||
| Pick Pony AI Rating | B | D |
| Speed | A | F |
| Early Pace | A | B |
| Mid Pace | A | B |
| Late Pace | A | D |
| Finish Pos | B | D |
| Dirt Speed | A | D |
| Turf Speed | C | D |
| Distance Speed | A | C |
| Trainer Effectiveness | B | D |
| Jockey Effectiveness | C | F |
| 3rd Party Ratings | C | F |
| Recent
Performance analysis from the horse's recent races, weighted to reflect current form. Sprint and Route FPS (Foot Per Second) measure pace efficiency over the horse's recent sprints and routes respectively. Grading scale: A = elite • B = above average • C = average • D = below average • F = poor • — = no data |
||
| Speed | A | F |
| Early Pace | B | C |
| Mid Pace | A | C |
| Late Pace | A | D |
| Sprint FPS | B | C |
| Route FPS | B | D |
| Trainer Effectiveness | B | D |
| Jockey Effectiveness | C | F |
| 3rd Party Ratings | C | F |
| Predictions
AI-generated projections for the upcoming race, derived from prior AI analysis for speed and pace trends, surface and distance suitability, and current conditions. Grading scale: A = elite • B = above average • C = average • D = below average • F = poor • — = no data |
||
| Speed | B | D |
| Early Pace | C | C |
| Mid Pace | C | D |
| Late Pace | C | C |
A paid membership is required to view all stats. Subscribe now →
Chart Guide (2.0.03)
- Bubbles
- Color = surface: green (turf), brown (dirt), blue (synthetic)
- Number = finishing position
- Height above line = beaten lengths — closer means a smaller margin
- Border = track conditions: green (FST/GD/FM), yellow (WF/SL/YLD), red (SY/MY/FRZ/SFT/HVY)
- Connecting Line
- Solid = good conditions; dashed = bad conditions
- Line Symbol
- ▲ Triangle = sprint (7f or less); ● Circle = route (more than 7f)
- Bubble Size
- Color (brown-dirt, green-turf) and border (red-bad, green-good) convey surface and track conditions
- Shaded Band (Bollinger)
- Highlights volatility — a wider band means more variation in recent performance
- Performance Trend
- Straight line showing the overall performance direction — angled up = improving, angled down = declining
- Dashed Reference Line
- AI Opponent = AI analysis class-level par for the race
| Stat | vs. Current Card | vs. All Horses |
|---|---|---|
| Averages
Career-average metrics across all AI race analysis. Performance and pace averages reflect estimated historical performance; trainer and jockey grades score in-the-money percentages. Grading scale: A = elite • B = above average • C = average • D = below average • F = poor • — = no data |
||
| Pick Pony AI Rating | D | D |
| Speed | F | F |
| Early Pace | B | A |
| Mid Pace | C | C |
| Late Pace | F | F |
| Finish Pos | F | F |
| Dirt Speed | B | C |
| Turf Speed | C | C |
| Distance Speed | B | C |
| Trainer Effectiveness | D | D |
| Jockey Effectiveness | C | D |
| 3rd Party Ratings | D | F |
| Recent
Performance analysis from the horse's recent races, weighted to reflect current form. Sprint and Route FPS (Foot Per Second) measure pace efficiency over the horse's recent sprints and routes respectively. Grading scale: A = elite • B = above average • C = average • D = below average • F = poor • — = no data |
||
| Speed | C | F |
| Early Pace | B | B |
| Mid Pace | C | C |
| Late Pace | D | D |
| Sprint FPS | C | C |
| Route FPS | D | D |
| Trainer Effectiveness | D | D |
| Jockey Effectiveness | C | D |
| 3rd Party Ratings | D | F |
| Predictions
AI-generated projections for the upcoming race, derived from prior AI analysis for speed and pace trends, surface and distance suitability, and current conditions. Grading scale: A = elite • B = above average • C = average • D = below average • F = poor • — = no data |
||
| Speed | D | F |
| Early Pace | C | B |
| Mid Pace | C | C |
| Late Pace | C | C |
A paid membership is required to view all stats. Subscribe now →
Chart Guide (2.0.03)
- Bubbles
- Color = surface: green (turf), brown (dirt), blue (synthetic)
- Number = finishing position
- Height above line = beaten lengths — closer means a smaller margin
- Border = track conditions: green (FST/GD/FM), yellow (WF/SL/YLD), red (SY/MY/FRZ/SFT/HVY)
- Connecting Line
- Solid = good conditions; dashed = bad conditions
- Line Symbol
- ▲ Triangle = sprint (7f or less); ● Circle = route (more than 7f)
- Bubble Size
- Color (brown-dirt, green-turf) and border (red-bad, green-good) convey surface and track conditions
- Shaded Band (Bollinger)
- Highlights volatility — a wider band means more variation in recent performance
- Performance Trend
- Straight line showing the overall performance direction — angled up = improving, angled down = declining
- Dashed Reference Line
- AI Opponent = AI analysis class-level par for the race
| Stat | vs. Current Card | vs. All Horses |
|---|---|---|
| Averages
Career-average metrics across all AI race analysis. Performance and pace averages reflect estimated historical performance; trainer and jockey grades score in-the-money percentages. Grading scale: A = elite • B = above average • C = average • D = below average • F = poor • — = no data |
||
| Pick Pony AI Rating | A | B |
| Speed | D | F |
| Early Pace | A | A |
| Mid Pace | D | C |
| Late Pace | D | F |
| Finish Pos | D | F |
| Dirt Speed | F | D |
| Turf Speed | C | C |
| Distance Speed | D | D |
| Trainer Effectiveness | C | D |
| Jockey Effectiveness | F | F |
| 3rd Party Ratings | F | F |
| Recent
Performance analysis from the horse's recent races, weighted to reflect current form. Sprint and Route FPS (Foot Per Second) measure pace efficiency over the horse's recent sprints and routes respectively. Grading scale: A = elite • B = above average • C = average • D = below average • F = poor • — = no data |
||
| Speed | F | F |
| Early Pace | A | B |
| Mid Pace | F | D |
| Late Pace | F | F |
| Sprint FPS | A | A |
| Route FPS | C | C |
| Trainer Effectiveness | C | D |
| Jockey Effectiveness | F | F |
| 3rd Party Ratings | F | F |
| Predictions
AI-generated projections for the upcoming race, derived from prior AI analysis for speed and pace trends, surface and distance suitability, and current conditions. Grading scale: A = elite • B = above average • C = average • D = below average • F = poor • — = no data |
||
| Speed | F | F |
| Early Pace | A | B |
| Mid Pace | B | C |
| Late Pace | C | C |
A paid membership is required to view all stats. Subscribe now →
Chart Guide (2.0.03)
- Bubbles
- Color = surface: green (turf), brown (dirt), blue (synthetic)
- Number = finishing position
- Height above line = beaten lengths — closer means a smaller margin
- Border = track conditions: green (FST/GD/FM), yellow (WF/SL/YLD), red (SY/MY/FRZ/SFT/HVY)
- Connecting Line
- Solid = good conditions; dashed = bad conditions
- Line Symbol
- ▲ Triangle = sprint (7f or less); ● Circle = route (more than 7f)
- Bubble Size
- Color (brown-dirt, green-turf) and border (red-bad, green-good) convey surface and track conditions
- Shaded Band (Bollinger)
- Highlights volatility — a wider band means more variation in recent performance
- Performance Trend
- Straight line showing the overall performance direction — angled up = improving, angled down = declining
- Dashed Reference Line
- AI Opponent = AI analysis class-level par for the race
| Stat | vs. Current Card | vs. All Horses |
|---|---|---|
| Averages
Career-average metrics across all AI race analysis. Performance and pace averages reflect estimated historical performance; trainer and jockey grades score in-the-money percentages. Grading scale: A = elite • B = above average • C = average • D = below average • F = poor • — = no data |
||
| Pick Pony AI Rating | C | D |
| Speed | B | F |
| Early Pace | C | C |
| Mid Pace | A | B |
| Late Pace | A | C |
| Finish Pos | A | B |
| Dirt Speed | D | D |
| Turf Speed | B | C |
| Distance Speed | C | C |
| Trainer Effectiveness | C | D |
| Jockey Effectiveness | A | A |
| 3rd Party Ratings | C | D |
| Recent
Performance analysis from the horse's recent races, weighted to reflect current form. Sprint and Route FPS (Foot Per Second) measure pace efficiency over the horse's recent sprints and routes respectively. Grading scale: A = elite • B = above average • C = average • D = below average • F = poor • — = no data |
||
| Speed | C | D |
| Early Pace | F | D |
| Mid Pace | C | C |
| Late Pace | C | D |
| Sprint FPS | D | C |
| Route FPS | B | C |
| Trainer Effectiveness | C | D |
| Jockey Effectiveness | A | A |
| 3rd Party Ratings | C | D |
| Predictions
AI-generated projections for the upcoming race, derived from prior AI analysis for speed and pace trends, surface and distance suitability, and current conditions. Grading scale: A = elite • B = above average • C = average • D = below average • F = poor • — = no data |
||
| Speed | B | F |
| Early Pace | F | D |
| Mid Pace | F | D |
| Late Pace | C | C |
A paid membership is required to view all stats. Subscribe now →
Chart Guide (2.0.03)
- Bubbles
- Color = surface: green (turf), brown (dirt), blue (synthetic)
- Number = finishing position
- Height above line = beaten lengths — closer means a smaller margin
- Border = track conditions: green (FST/GD/FM), yellow (WF/SL/YLD), red (SY/MY/FRZ/SFT/HVY)
- Connecting Line
- Solid = good conditions; dashed = bad conditions
- Line Symbol
- ▲ Triangle = sprint (7f or less); ● Circle = route (more than 7f)
- Bubble Size
- Color (brown-dirt, green-turf) and border (red-bad, green-good) convey surface and track conditions
- Shaded Band (Bollinger)
- Highlights volatility — a wider band means more variation in recent performance
- Performance Trend
- Straight line showing the overall performance direction — angled up = improving, angled down = declining
- Dashed Reference Line
- AI Opponent = AI analysis class-level par for the race
| Stat | vs. Current Card | vs. All Horses |
|---|---|---|
| Averages
Career-average metrics across all AI race analysis. Performance and pace averages reflect estimated historical performance; trainer and jockey grades score in-the-money percentages. Grading scale: A = elite • B = above average • C = average • D = below average • F = poor • — = no data |
||
| Pick Pony AI Rating | C | C |
| Speed | A | D |
| Early Pace | F | D |
| Mid Pace | F | C |
| Late Pace | B | C |
| Finish Pos | A | C |
| Dirt Speed | B | C |
| Turf Speed | F | D |
| Distance Speed | B | C |
| Trainer Effectiveness | B | B |
| Jockey Effectiveness | C | C |
| 3rd Party Ratings | B | D |
| Recent
Performance analysis from the horse's recent races, weighted to reflect current form. Sprint and Route FPS (Foot Per Second) measure pace efficiency over the horse's recent sprints and routes respectively. Grading scale: A = elite • B = above average • C = average • D = below average • F = poor • — = no data |
||
| Speed | B | D |
| Early Pace | C | B |
| Mid Pace | A | B |
| Late Pace | B | C |
| Sprint FPS | B | B |
| Route FPS | A | B |
| Trainer Effectiveness | B | B |
| Jockey Effectiveness | C | C |
| 3rd Party Ratings | B | D |
| Predictions
AI-generated projections for the upcoming race, derived from prior AI analysis for speed and pace trends, surface and distance suitability, and current conditions. Grading scale: A = elite • B = above average • C = average • D = below average • F = poor • — = no data |
||
| Speed | A | D |
| Early Pace | B | B |
| Mid Pace | A | C |
| Late Pace | C | C |
A paid membership is required to view all stats. Subscribe now →
Chart Guide (2.0.03)
- Bubbles
- Color = surface: green (turf), brown (dirt), blue (synthetic)
- Number = finishing position
- Height above line = beaten lengths — closer means a smaller margin
- Border = track conditions: green (FST/GD/FM), yellow (WF/SL/YLD), red (SY/MY/FRZ/SFT/HVY)
- Connecting Line
- Solid = good conditions; dashed = bad conditions
- Line Symbol
- ▲ Triangle = sprint (7f or less); ● Circle = route (more than 7f)
- Bubble Size
- Color (brown-dirt, green-turf) and border (red-bad, green-good) convey surface and track conditions
- Shaded Band (Bollinger)
- Highlights volatility — a wider band means more variation in recent performance
- Performance Trend
- Straight line showing the overall performance direction — angled up = improving, angled down = declining
- Dashed Reference Line
- AI Opponent = AI analysis class-level par for the race
| Stat | vs. Current Card | vs. All Horses |
|---|---|---|
| Averages
Career-average metrics across all AI race analysis. Performance and pace averages reflect estimated historical performance; trainer and jockey grades score in-the-money percentages. Grading scale: A = elite • B = above average • C = average • D = below average • F = poor • — = no data |
||
| Pick Pony AI Rating | B | C |
| Speed | C | F |
| Early Pace | A | A |
| Mid Pace | B | C |
| Late Pace | C | D |
| Finish Pos | C | D |
| Dirt Speed | A | C |
| Turf Speed | A | B |
| Distance Speed | F | D |
| Trainer Effectiveness | A | A |
| Jockey Effectiveness | B | C |
| 3rd Party Ratings | A | C |
| Recent
Performance analysis from the horse's recent races, weighted to reflect current form. Sprint and Route FPS (Foot Per Second) measure pace efficiency over the horse's recent sprints and routes respectively. Grading scale: A = elite • B = above average • C = average • D = below average • F = poor • — = no data |
||
| Speed | A | C |
| Early Pace | A | A |
| Mid Pace | A | B |
| Late Pace | A | B |
| Sprint FPS | A | B |
| Route FPS | A | B |
| Trainer Effectiveness | A | A |
| Jockey Effectiveness | B | C |
| 3rd Party Ratings | A | C |
| Predictions
AI-generated projections for the upcoming race, derived from prior AI analysis for speed and pace trends, surface and distance suitability, and current conditions. Grading scale: A = elite • B = above average • C = average • D = below average • F = poor • — = no data |
||
| Speed | C | F |
| Early Pace | A | B |
| Mid Pace | C | C |
| Late Pace | C | C |
A paid membership is required to view all stats. Subscribe now →
Chart Guide (2.0.03)
- Bubbles
- Color = surface: green (turf), brown (dirt), blue (synthetic)
- Number = finishing position
- Height above line = beaten lengths — closer means a smaller margin
- Border = track conditions: green (FST/GD/FM), yellow (WF/SL/YLD), red (SY/MY/FRZ/SFT/HVY)
- Connecting Line
- Solid = good conditions; dashed = bad conditions
- Line Symbol
- ▲ Triangle = sprint (7f or less); ● Circle = route (more than 7f)
- Bubble Size
- Color (brown-dirt, green-turf) and border (red-bad, green-good) convey surface and track conditions
- Shaded Band (Bollinger)
- Highlights volatility — a wider band means more variation in recent performance
- Performance Trend
- Straight line showing the overall performance direction — angled up = improving, angled down = declining
- Dashed Reference Line
- AI Opponent = AI analysis class-level par for the race
| Stat | vs. Current Card | vs. All Horses |
|---|---|---|
| Averages
Career-average metrics across all AI race analysis. Performance and pace averages reflect estimated historical performance; trainer and jockey grades score in-the-money percentages. Grading scale: A = elite • B = above average • C = average • D = below average • F = poor • — = no data |
||
| Pick Pony AI Rating | A | B |
| Speed | A | D |
| Early Pace | D | C |
| Mid Pace | C | C |
| Late Pace | A | C |
| Finish Pos | B | D |
| Dirt Speed | A | C |
| Turf Speed | A | B |
| Distance Speed | A | C |
| Trainer Effectiveness | A | B |
| Jockey Effectiveness | A | B |
| 3rd Party Ratings | A | C |
| Recent
Performance analysis from the horse's recent races, weighted to reflect current form. Sprint and Route FPS (Foot Per Second) measure pace efficiency over the horse's recent sprints and routes respectively. Grading scale: A = elite • B = above average • C = average • D = below average • F = poor • — = no data |
||
| Speed | A | D |
| Early Pace | C | C |
| Mid Pace | B | C |
| Late Pace | A | A |
| Sprint FPS | C | C |
| Route FPS | C | D |
| Trainer Effectiveness | A | B |
| Jockey Effectiveness | A | B |
| 3rd Party Ratings | A | C |
| Predictions
AI-generated projections for the upcoming race, derived from prior AI analysis for speed and pace trends, surface and distance suitability, and current conditions. Grading scale: A = elite • B = above average • C = average • D = below average • F = poor • — = no data |
||
| Speed | A | D |
| Early Pace | C | C |
| Mid Pace | A | C |
| Late Pace | C | C |
A paid membership is required to view all stats. Subscribe now →
Chart Guide (2.0.03)
- Bubbles
- Color = surface: green (turf), brown (dirt), blue (synthetic)
- Number = finishing position
- Height above line = beaten lengths — closer means a smaller margin
- Border = track conditions: green (FST/GD/FM), yellow (WF/SL/YLD), red (SY/MY/FRZ/SFT/HVY)
- Connecting Line
- Solid = good conditions; dashed = bad conditions
- Line Symbol
- ▲ Triangle = sprint (7f or less); ● Circle = route (more than 7f)
- Bubble Size
- Color (brown-dirt, green-turf) and border (red-bad, green-good) convey surface and track conditions
- Shaded Band (Bollinger)
- Highlights volatility — a wider band means more variation in recent performance
- Performance Trend
- Straight line showing the overall performance direction — angled up = improving, angled down = declining
- Dashed Reference Line
- AI Opponent = AI analysis class-level par for the race
| Stat | vs. Current Card | vs. All Horses |
|---|---|---|
| Averages
Career-average metrics across all AI race analysis. Performance and pace averages reflect estimated historical performance; trainer and jockey grades score in-the-money percentages. Grading scale: A = elite • B = above average • C = average • D = below average • F = poor • — = no data |
||
| Pick Pony AI Rating | F | D |
| Speed | C | F |
| Early Pace | C | B |
| Mid Pace | A | B |
| Late Pace | C | D |
| Finish Pos | C | F |
| Dirt Speed | C | D |
| Turf Speed | D | C |
| Distance Speed | C | C |
| Trainer Effectiveness | F | F |
| Jockey Effectiveness | D | F |
| 3rd Party Ratings | C | D |
| Recent
Performance analysis from the horse's recent races, weighted to reflect current form. Sprint and Route FPS (Foot Per Second) measure pace efficiency over the horse's recent sprints and routes respectively. Grading scale: A = elite • B = above average • C = average • D = below average • F = poor • — = no data |
||
| Speed | D | F |
| Early Pace | D | C |
| Mid Pace | D | C |
| Late Pace | C | D |
| Sprint FPS | F | D |
| Route FPS | F | D |
| Trainer Effectiveness | F | F |
| Jockey Effectiveness | D | F |
| 3rd Party Ratings | C | D |
| Predictions
AI-generated projections for the upcoming race, derived from prior AI analysis for speed and pace trends, surface and distance suitability, and current conditions. Grading scale: A = elite • B = above average • C = average • D = below average • F = poor • — = no data |
||
| Speed | C | F |
| Early Pace | D | D |
| Mid Pace | D | D |
| Late Pace | C | C |
A paid membership is required to view all stats. Subscribe now →
Chart Guide (2.0.03)
- Bubbles
- Color = surface: green (turf), brown (dirt), blue (synthetic)
- Number = finishing position
- Height above line = beaten lengths — closer means a smaller margin
- Border = track conditions: green (FST/GD/FM), yellow (WF/SL/YLD), red (SY/MY/FRZ/SFT/HVY)
- Connecting Line
- Solid = good conditions; dashed = bad conditions
- Line Symbol
- ▲ Triangle = sprint (7f or less); ● Circle = route (more than 7f)
- Bubble Size
- Color (brown-dirt, green-turf) and border (red-bad, green-good) convey surface and track conditions
- Shaded Band (Bollinger)
- Highlights volatility — a wider band means more variation in recent performance
- Performance Trend
- Straight line showing the overall performance direction — angled up = improving, angled down = declining
- Dashed Reference Line
- AI Opponent = AI analysis class-level par for the race
| Stat | vs. Current Card | vs. All Horses |
|---|---|---|
| Averages
Career-average metrics across all AI race analysis. Performance and pace averages reflect estimated historical performance; trainer and jockey grades score in-the-money percentages. Grading scale: A = elite • B = above average • C = average • D = below average • F = poor • — = no data |
||
| Pick Pony AI Rating | A | A |
| Speed | B | B |
| Early Pace | B | A |
| Mid Pace | B | C |
| Late Pace | A | B |
| Finish Pos | A | C |
| Dirt Speed | A | A |
| Turf Speed | B | B |
| Distance Speed | A | A |
| Trainer Effectiveness | B | B |
| Jockey Effectiveness | A | A |
| 3rd Party Ratings | A | A |
| Recent
Performance analysis from the horse's recent races, weighted to reflect current form. Sprint and Route FPS (Foot Per Second) measure pace efficiency over the horse's recent sprints and routes respectively. Grading scale: A = elite • B = above average • C = average • D = below average • F = poor • — = no data |
||
| Speed | A | A |
| Early Pace | A | A |
| Mid Pace | C | D |
| Late Pace | A | A |
| Sprint FPS | D | B |
| Route FPS | C | B |
| Trainer Effectiveness | B | B |
| Jockey Effectiveness | A | A |
| 3rd Party Ratings | A | A |
| Predictions
AI-generated projections for the upcoming race, derived from prior AI analysis for speed and pace trends, surface and distance suitability, and current conditions. Grading scale: A = elite • B = above average • C = average • D = below average • F = poor • — = no data |
||
| Speed | A | B |
| Early Pace | B | A |
| Mid Pace | C | A |
| Late Pace | B | C |
A paid membership is required to view all stats. Subscribe now →
Chart Guide (2.0.03)
- Bubbles
- Color = surface: green (turf), brown (dirt), blue (synthetic)
- Number = finishing position
- Height above line = beaten lengths — closer means a smaller margin
- Border = track conditions: green (FST/GD/FM), yellow (WF/SL/YLD), red (SY/MY/FRZ/SFT/HVY)
- Connecting Line
- Solid = good conditions; dashed = bad conditions
- Line Symbol
- ▲ Triangle = sprint (7f or less); ● Circle = route (more than 7f)
- Bubble Size
- Color (brown-dirt, green-turf) and border (red-bad, green-good) convey surface and track conditions
- Shaded Band (Bollinger)
- Highlights volatility — a wider band means more variation in recent performance
- Performance Trend
- Straight line showing the overall performance direction — angled up = improving, angled down = declining
- Dashed Reference Line
- AI Opponent = AI analysis class-level par for the race
| Stat | vs. Current Card | vs. All Horses |
|---|---|---|
| Averages
Career-average metrics across all AI race analysis. Performance and pace averages reflect estimated historical performance; trainer and jockey grades score in-the-money percentages. Grading scale: A = elite • B = above average • C = average • D = below average • F = poor • — = no data |
||
| Pick Pony AI Rating | B | B |
| Speed | A | A |
| Early Pace | A | A |
| Mid Pace | D | D |
| Late Pace | B | B |
| Finish Pos | D | D |
| Dirt Speed | C | B |
| Turf Speed | A | A |
| Distance Speed | A | A |
| Trainer Effectiveness | B | B |
| Jockey Effectiveness | A | B |
| 3rd Party Ratings | B | B |
| Recent
Performance analysis from the horse's recent races, weighted to reflect current form. Sprint and Route FPS (Foot Per Second) measure pace efficiency over the horse's recent sprints and routes respectively. Grading scale: A = elite • B = above average • C = average • D = below average • F = poor • — = no data |
||
| Speed | A | B |
| Early Pace | C | A |
| Mid Pace | D | D |
| Late Pace | A | B |
| Sprint FPS | A | A |
| Route FPS | A | A |
| Trainer Effectiveness | B | B |
| Jockey Effectiveness | A | B |
| 3rd Party Ratings | B | B |
| Predictions
AI-generated projections for the upcoming race, derived from prior AI analysis for speed and pace trends, surface and distance suitability, and current conditions. Grading scale: A = elite • B = above average • C = average • D = below average • F = poor • — = no data |
||
| Speed | B | C |
| Early Pace | A | A |
| Mid Pace | D | F |
| Late Pace | B | C |
A paid membership is required to view all stats. Subscribe now →
Chart Guide (2.0.03)
- Bubbles
- Color = surface: green (turf), brown (dirt), blue (synthetic)
- Number = finishing position
- Height above line = beaten lengths — closer means a smaller margin
- Border = track conditions: green (FST/GD/FM), yellow (WF/SL/YLD), red (SY/MY/FRZ/SFT/HVY)
- Connecting Line
- Solid = good conditions; dashed = bad conditions
- Line Symbol
- ▲ Triangle = sprint (7f or less); ● Circle = route (more than 7f)
- Bubble Size
- Color (brown-dirt, green-turf) and border (red-bad, green-good) convey surface and track conditions
- Shaded Band (Bollinger)
- Highlights volatility — a wider band means more variation in recent performance
- Performance Trend
- Straight line showing the overall performance direction — angled up = improving, angled down = declining
- Dashed Reference Line
- AI Opponent = AI analysis class-level par for the race
| Stat | vs. Current Card | vs. All Horses |
|---|---|---|
| Averages
Career-average metrics across all AI race analysis. Performance and pace averages reflect estimated historical performance; trainer and jockey grades score in-the-money percentages. Grading scale: A = elite • B = above average • C = average • D = below average • F = poor • — = no data |
||
| Pick Pony AI Rating | D | C |
| Speed | D | C |
| Early Pace | C | A |
| Mid Pace | C | D |
| Late Pace | C | C |
| Finish Pos | C | D |
| Dirt Speed | A | A |
| Turf Speed | A | A |
| Distance Speed | D | B |
| Trainer Effectiveness | C | B |
| Jockey Effectiveness | D | D |
| 3rd Party Ratings | D | C |
| Recent
Performance analysis from the horse's recent races, weighted to reflect current form. Sprint and Route FPS (Foot Per Second) measure pace efficiency over the horse's recent sprints and routes respectively. Grading scale: A = elite • B = above average • C = average • D = below average • F = poor • — = no data |
||
| Speed | D | C |
| Early Pace | B | A |
| Mid Pace | B | D |
| Late Pace | D | D |
| Sprint FPS | A | A |
| Route FPS | B | B |
| Trainer Effectiveness | C | B |
| Jockey Effectiveness | D | D |
| 3rd Party Ratings | D | C |
| Predictions
AI-generated projections for the upcoming race, derived from prior AI analysis for speed and pace trends, surface and distance suitability, and current conditions. Grading scale: A = elite • B = above average • C = average • D = below average • F = poor • — = no data |
||
| Speed | D | D |
| Early Pace | C | A |
| Mid Pace | A | A |
| Late Pace | B | C |
A paid membership is required to view all stats. Subscribe now →
Chart Guide (2.0.03)
- Bubbles
- Color = surface: green (turf), brown (dirt), blue (synthetic)
- Number = finishing position
- Height above line = beaten lengths — closer means a smaller margin
- Border = track conditions: green (FST/GD/FM), yellow (WF/SL/YLD), red (SY/MY/FRZ/SFT/HVY)
- Connecting Line
- Solid = good conditions; dashed = bad conditions
- Line Symbol
- ▲ Triangle = sprint (7f or less); ● Circle = route (more than 7f)
- Bubble Size
- Color (brown-dirt, green-turf) and border (red-bad, green-good) convey surface and track conditions
- Shaded Band (Bollinger)
- Highlights volatility — a wider band means more variation in recent performance
- Performance Trend
- Straight line showing the overall performance direction — angled up = improving, angled down = declining
- Dashed Reference Line
- AI Opponent = AI analysis class-level par for the race
| Stat | vs. Current Card | vs. All Horses |
|---|---|---|
| Averages
Career-average metrics across all AI race analysis. Performance and pace averages reflect estimated historical performance; trainer and jockey grades score in-the-money percentages. Grading scale: A = elite • B = above average • C = average • D = below average • F = poor • — = no data |
||
| Pick Pony AI Rating | C | B |
| Speed | A | B |
| Early Pace | D | C |
| Mid Pace | A | C |
| Late Pace | A | B |
| Finish Pos | A | A |
| Dirt Speed | B | B |
| Turf Speed | D | D |
| Distance Speed | C | A |
| Trainer Effectiveness | A | B |
| Jockey Effectiveness | B | D |
| 3rd Party Ratings | C | B |
| Recent
Performance analysis from the horse's recent races, weighted to reflect current form. Sprint and Route FPS (Foot Per Second) measure pace efficiency over the horse's recent sprints and routes respectively. Grading scale: A = elite • B = above average • C = average • D = below average • F = poor • — = no data |
||
| Speed | C | C |
| Early Pace | D | A |
| Mid Pace | A | A |
| Late Pace | B | C |
| Sprint FPS | C | A |
| Route FPS | D | B |
| Trainer Effectiveness | A | B |
| Jockey Effectiveness | B | D |
| 3rd Party Ratings | C | B |
| Predictions
AI-generated projections for the upcoming race, derived from prior AI analysis for speed and pace trends, surface and distance suitability, and current conditions. Grading scale: A = elite • B = above average • C = average • D = below average • F = poor • — = no data |
||
| Speed | A | B |
| Early Pace | D | A |
| Mid Pace | B | A |
| Late Pace | B | C |
A paid membership is required to view all stats. Subscribe now →
Chart Guide (2.0.03)
- Bubbles
- Color = surface: green (turf), brown (dirt), blue (synthetic)
- Number = finishing position
- Height above line = beaten lengths — closer means a smaller margin
- Border = track conditions: green (FST/GD/FM), yellow (WF/SL/YLD), red (SY/MY/FRZ/SFT/HVY)
- Connecting Line
- Solid = good conditions; dashed = bad conditions
- Line Symbol
- ▲ Triangle = sprint (7f or less); ● Circle = route (more than 7f)
- Bubble Size
- Color (brown-dirt, green-turf) and border (red-bad, green-good) convey surface and track conditions
- Shaded Band (Bollinger)
- Highlights volatility — a wider band means more variation in recent performance
- Performance Trend
- Straight line showing the overall performance direction — angled up = improving, angled down = declining
- Dashed Reference Line
- AI Opponent = AI analysis class-level par for the race
| Stat | vs. Current Card | vs. All Horses |
|---|---|---|
| Averages
Career-average metrics across all AI race analysis. Performance and pace averages reflect estimated historical performance; trainer and jockey grades score in-the-money percentages. Grading scale: A = elite • B = above average • C = average • D = below average • F = poor • — = no data |
||
| Pick Pony AI Rating | A | A |
| Speed | C | C |
| Early Pace | A | A |
| Mid Pace | A | A |
| Late Pace | D | C |
| Finish Pos | B | C |
| Dirt Speed | D | B |
| Turf Speed | C | C |
| Distance Speed | B | A |
| Trainer Effectiveness | D | C |
| Jockey Effectiveness | C | D |
| 3rd Party Ratings | A | B |
| Recent
Performance analysis from the horse's recent races, weighted to reflect current form. Sprint and Route FPS (Foot Per Second) measure pace efficiency over the horse's recent sprints and routes respectively. Grading scale: A = elite • B = above average • C = average • D = below average • F = poor • — = no data |
||
| Speed | B | B |
| Early Pace | A | A |
| Mid Pace | A | A |
| Late Pace | C | C |
| Sprint FPS | B | A |
| Route FPS | A | A |
| Trainer Effectiveness | D | C |
| Jockey Effectiveness | C | D |
| 3rd Party Ratings | A | B |
| Predictions
AI-generated projections for the upcoming race, derived from prior AI analysis for speed and pace trends, surface and distance suitability, and current conditions. Grading scale: A = elite • B = above average • C = average • D = below average • F = poor • — = no data |
||
| Speed | C | C |
| Early Pace | A | A |
| Mid Pace | A | A |
| Late Pace | B | C |
A paid membership is required to view all stats. Subscribe now →
Chart Guide (2.0.03)
- Bubbles
- Color = surface: green (turf), brown (dirt), blue (synthetic)
- Number = finishing position
- Height above line = beaten lengths — closer means a smaller margin
- Border = track conditions: green (FST/GD/FM), yellow (WF/SL/YLD), red (SY/MY/FRZ/SFT/HVY)
- Connecting Line
- Solid = good conditions; dashed = bad conditions
- Line Symbol
- ▲ Triangle = sprint (7f or less); ● Circle = route (more than 7f)
- Bubble Size
- Color (brown-dirt, green-turf) and border (red-bad, green-good) convey surface and track conditions
- Shaded Band (Bollinger)
- Highlights volatility — a wider band means more variation in recent performance
- Performance Trend
- Straight line showing the overall performance direction — angled up = improving, angled down = declining
- Dashed Reference Line
- AI Opponent = AI analysis class-level par for the race
| Stat | vs. Current Card | vs. All Horses |
|---|---|---|
| Averages
Career-average metrics across all AI race analysis. Performance and pace averages reflect estimated historical performance; trainer and jockey grades score in-the-money percentages. Grading scale: A = elite • B = above average • C = average • D = below average • F = poor • — = no data |
||
| Pick Pony AI Rating | D | C |
| Speed | A | D |
| Early Pace | D | C |
| Mid Pace | D | C |
| Late Pace | A | B |
| Finish Pos | B | D |
| Dirt Speed | A | C |
| Turf Speed | C | D |
| Distance Speed | D | C |
| Trainer Effectiveness | B | B |
| Jockey Effectiveness | C | C |
| 3rd Party Ratings | B | D |
| Recent
Performance analysis from the horse's recent races, weighted to reflect current form. Sprint and Route FPS (Foot Per Second) measure pace efficiency over the horse's recent sprints and routes respectively. Grading scale: A = elite • B = above average • C = average • D = below average • F = poor • — = no data |
||
| Speed | B | D |
| Early Pace | F | D |
| Mid Pace | F | D |
| Late Pace | A | B |
| Sprint FPS | F | D |
| Route FPS | F | D |
| Trainer Effectiveness | B | B |
| Jockey Effectiveness | C | C |
| 3rd Party Ratings | B | D |
| Predictions
AI-generated projections for the upcoming race, derived from prior AI analysis for speed and pace trends, surface and distance suitability, and current conditions. Grading scale: A = elite • B = above average • C = average • D = below average • F = poor • — = no data |
||
| Speed | A | D |
| Early Pace | F | D |
| Mid Pace | D | D |
| Late Pace | C | C |
A paid membership is required to view all stats. Subscribe now →
Chart Guide (2.0.03)
- Bubbles
- Color = surface: green (turf), brown (dirt), blue (synthetic)
- Number = finishing position
- Height above line = beaten lengths — closer means a smaller margin
- Border = track conditions: green (FST/GD/FM), yellow (WF/SL/YLD), red (SY/MY/FRZ/SFT/HVY)
- Connecting Line
- Solid = good conditions; dashed = bad conditions
- Line Symbol
- ▲ Triangle = sprint (7f or less); ● Circle = route (more than 7f)
- Bubble Size
- Color (brown-dirt, green-turf) and border (red-bad, green-good) convey surface and track conditions
- Shaded Band (Bollinger)
- Highlights volatility — a wider band means more variation in recent performance
- Performance Trend
- Straight line showing the overall performance direction — angled up = improving, angled down = declining
- Dashed Reference Line
- AI Opponent = AI analysis class-level par for the race
| Stat | vs. Current Card | vs. All Horses |
|---|---|---|
| Averages
Career-average metrics across all AI race analysis. Performance and pace averages reflect estimated historical performance; trainer and jockey grades score in-the-money percentages. Grading scale: A = elite • B = above average • C = average • D = below average • F = poor • — = no data |
||
| Pick Pony AI Rating | B | C |
| Speed | C | F |
| Early Pace | A | B |
| Mid Pace | A | B |
| Late Pace | B | C |
| Finish Pos | A | C |
| Dirt Speed | D | C |
| Turf Speed | C | D |
| Distance Speed | D | C |
| Trainer Effectiveness | C | B |
| Jockey Effectiveness | A | B |
| 3rd Party Ratings | A | C |
| Recent
Performance analysis from the horse's recent races, weighted to reflect current form. Sprint and Route FPS (Foot Per Second) measure pace efficiency over the horse's recent sprints and routes respectively. Grading scale: A = elite • B = above average • C = average • D = below average • F = poor • — = no data |
||
| Speed | A | C |
| Early Pace | A | A |
| Mid Pace | A | B |
| Late Pace | B | B |
| Sprint FPS | A | A |
| Route FPS | B | B |
| Trainer Effectiveness | C | B |
| Jockey Effectiveness | A | B |
| 3rd Party Ratings | A | C |
| Predictions
AI-generated projections for the upcoming race, derived from prior AI analysis for speed and pace trends, surface and distance suitability, and current conditions. Grading scale: A = elite • B = above average • C = average • D = below average • F = poor • — = no data |
||
| Speed | B | F |
| Early Pace | B | B |
| Mid Pace | A | B |
| Late Pace | C | C |
A paid membership is required to view all stats. Subscribe now →
Chart Guide (2.0.03)
- Bubbles
- Color = surface: green (turf), brown (dirt), blue (synthetic)
- Number = finishing position
- Height above line = beaten lengths — closer means a smaller margin
- Border = track conditions: green (FST/GD/FM), yellow (WF/SL/YLD), red (SY/MY/FRZ/SFT/HVY)
- Connecting Line
- Solid = good conditions; dashed = bad conditions
- Line Symbol
- ▲ Triangle = sprint (7f or less); ● Circle = route (more than 7f)
- Bubble Size
- Color (brown-dirt, green-turf) and border (red-bad, green-good) convey surface and track conditions
- Shaded Band (Bollinger)
- Highlights volatility — a wider band means more variation in recent performance
- Performance Trend
- Straight line showing the overall performance direction — angled up = improving, angled down = declining
- Dashed Reference Line
- AI Opponent = AI analysis class-level par for the race
| Stat | vs. Current Card | vs. All Horses |
|---|---|---|
| Averages
Career-average metrics across all AI race analysis. Performance and pace averages reflect estimated historical performance; trainer and jockey grades score in-the-money percentages. Grading scale: A = elite • B = above average • C = average • D = below average • F = poor • — = no data |
||
| Pick Pony AI Rating | A | C |
| Speed | F | F |
| Early Pace | A | A |
| Mid Pace | B | B |
| Late Pace | F | D |
| Finish Pos | F | F |
| Dirt Speed | A | C |
| Turf Speed | C | D |
| Distance Speed | A | C |
| Trainer Effectiveness | D | C |
| Jockey Effectiveness | B | C |
| 3rd Party Ratings | D | D |
| Recent
Performance analysis from the horse's recent races, weighted to reflect current form. Sprint and Route FPS (Foot Per Second) measure pace efficiency over the horse's recent sprints and routes respectively. Grading scale: A = elite • B = above average • C = average • D = below average • F = poor • — = no data |
||
| Speed | C | D |
| Early Pace | B | B |
| Mid Pace | D | D |
| Late Pace | D | C |
| Sprint FPS | B | B |
| Route FPS | A | B |
| Trainer Effectiveness | D | C |
| Jockey Effectiveness | B | C |
| 3rd Party Ratings | D | D |
| Predictions
AI-generated projections for the upcoming race, derived from prior AI analysis for speed and pace trends, surface and distance suitability, and current conditions. Grading scale: A = elite • B = above average • C = average • D = below average • F = poor • — = no data |
||
| Speed | F | F |
| Early Pace | A | A |
| Mid Pace | A | A |
| Late Pace | C | C |
A paid membership is required to view all stats. Subscribe now →
Chart Guide (2.0.03)
- Bubbles
- Color = surface: green (turf), brown (dirt), blue (synthetic)
- Number = finishing position
- Height above line = beaten lengths — closer means a smaller margin
- Border = track conditions: green (FST/GD/FM), yellow (WF/SL/YLD), red (SY/MY/FRZ/SFT/HVY)
- Connecting Line
- Solid = good conditions; dashed = bad conditions
- Line Symbol
- ▲ Triangle = sprint (7f or less); ● Circle = route (more than 7f)
- Bubble Size
- Color (brown-dirt, green-turf) and border (red-bad, green-good) convey surface and track conditions
- Shaded Band (Bollinger)
- Highlights volatility — a wider band means more variation in recent performance
- Performance Trend
- Straight line showing the overall performance direction — angled up = improving, angled down = declining
- Dashed Reference Line
- AI Opponent = AI analysis class-level par for the race
| Stat | vs. Current Card | vs. All Horses |
|---|---|---|
| Averages
Career-average metrics across all AI race analysis. Performance and pace averages reflect estimated historical performance; trainer and jockey grades score in-the-money percentages. Grading scale: A = elite • B = above average • C = average • D = below average • F = poor • — = no data |
||
| Pick Pony AI Rating | C | C |
| Speed | A | D |
| Early Pace | F | C |
| Mid Pace | F | C |
| Late Pace | A | B |
| Finish Pos | C | D |
| Dirt Speed | D | C |
| Turf Speed | A | B |
| Distance Speed | D | C |
| Trainer Effectiveness | A | B |
| Jockey Effectiveness | A | A |
| 3rd Party Ratings | C | D |
| Recent
Performance analysis from the horse's recent races, weighted to reflect current form. Sprint and Route FPS (Foot Per Second) measure pace efficiency over the horse's recent sprints and routes respectively. Grading scale: A = elite • B = above average • C = average • D = below average • F = poor • — = no data |
||
| Speed | D | D |
| Early Pace | D | C |
| Mid Pace | C | C |
| Late Pace | A | B |
| Sprint FPS | D | D |
| Route FPS | D | D |
| Trainer Effectiveness | A | B |
| Jockey Effectiveness | A | A |
| 3rd Party Ratings | C | D |
| Predictions
AI-generated projections for the upcoming race, derived from prior AI analysis for speed and pace trends, surface and distance suitability, and current conditions. Grading scale: A = elite • B = above average • C = average • D = below average • F = poor • — = no data |
||
| Speed | C | F |
| Early Pace | D | D |
| Mid Pace | F | D |
| Late Pace | C | C |
A paid membership is required to view all stats. Subscribe now →
Chart Guide (2.0.03)
- Bubbles
- Color = surface: green (turf), brown (dirt), blue (synthetic)
- Number = finishing position
- Height above line = beaten lengths — closer means a smaller margin
- Border = track conditions: green (FST/GD/FM), yellow (WF/SL/YLD), red (SY/MY/FRZ/SFT/HVY)
- Connecting Line
- Solid = good conditions; dashed = bad conditions
- Line Symbol
- ▲ Triangle = sprint (7f or less); ● Circle = route (more than 7f)
- Bubble Size
- Color (brown-dirt, green-turf) and border (red-bad, green-good) convey surface and track conditions
- Shaded Band (Bollinger)
- Highlights volatility — a wider band means more variation in recent performance
- Performance Trend
- Straight line showing the overall performance direction — angled up = improving, angled down = declining
- Dashed Reference Line
- AI Opponent = AI analysis class-level par for the race
| Stat | vs. Current Card | vs. All Horses |
|---|---|---|
| Averages
Career-average metrics across all AI race analysis. Performance and pace averages reflect estimated historical performance; trainer and jockey grades score in-the-money percentages. Grading scale: A = elite • B = above average • C = average • D = below average • F = poor • — = no data |
||
| Pick Pony AI Rating | A | B |
| Speed | B | D |
| Early Pace | C | B |
| Mid Pace | C | C |
| Late Pace | C | D |
| Finish Pos | A | B |
| Dirt Speed | C | C |
| Turf Speed | C | D |
| Distance Speed | B | C |
| Trainer Effectiveness | A | A |
| Jockey Effectiveness | D | C |
| 3rd Party Ratings | A | C |
| Recent
Performance analysis from the horse's recent races, weighted to reflect current form. Sprint and Route FPS (Foot Per Second) measure pace efficiency over the horse's recent sprints and routes respectively. Grading scale: A = elite • B = above average • C = average • D = below average • F = poor • — = no data |
||
| Speed | A | D |
| Early Pace | B | B |
| Mid Pace | A | B |
| Late Pace | C | C |
| Sprint FPS | A | A |
| Route FPS | A | A |
| Trainer Effectiveness | A | A |
| Jockey Effectiveness | D | C |
| 3rd Party Ratings | A | C |
| Predictions
AI-generated projections for the upcoming race, derived from prior AI analysis for speed and pace trends, surface and distance suitability, and current conditions. Grading scale: A = elite • B = above average • C = average • D = below average • F = poor • — = no data |
||
| Speed | A | D |
| Early Pace | A | A |
| Mid Pace | B | C |
| Late Pace | C | C |
A paid membership is required to view all stats. Subscribe now →
Chart Guide (2.0.03)
- Bubbles
- Color = surface: green (turf), brown (dirt), blue (synthetic)
- Number = finishing position
- Height above line = beaten lengths — closer means a smaller margin
- Border = track conditions: green (FST/GD/FM), yellow (WF/SL/YLD), red (SY/MY/FRZ/SFT/HVY)
- Connecting Line
- Solid = good conditions; dashed = bad conditions
- Line Symbol
- ▲ Triangle = sprint (7f or less); ● Circle = route (more than 7f)
- Bubble Size
- Color (brown-dirt, green-turf) and border (red-bad, green-good) convey surface and track conditions
- Shaded Band (Bollinger)
- Highlights volatility — a wider band means more variation in recent performance
- Performance Trend
- Straight line showing the overall performance direction — angled up = improving, angled down = declining
- Dashed Reference Line
- AI Opponent = AI analysis class-level par for the race
| Stat | vs. Current Card | vs. All Horses |
|---|---|---|
| Averages
Career-average metrics across all AI race analysis. Performance and pace averages reflect estimated historical performance; trainer and jockey grades score in-the-money percentages. Grading scale: A = elite • B = above average • C = average • D = below average • F = poor • — = no data |
||
| Pick Pony AI Rating | F | D |
| Speed | D | F |
| Early Pace | B | B |
| Mid Pace | A | B |
| Late Pace | D | D |
| Finish Pos | C | D |
| Dirt Speed | C | C |
| Turf Speed | C | D |
| Distance Speed | B | C |
| Trainer Effectiveness | F | D |
| Jockey Effectiveness | F | F |
| 3rd Party Ratings | F | D |
| Recent
Performance analysis from the horse's recent races, weighted to reflect current form. Sprint and Route FPS (Foot Per Second) measure pace efficiency over the horse's recent sprints and routes respectively. Grading scale: A = elite • B = above average • C = average • D = below average • F = poor • — = no data |
||
| Speed | F | F |
| Early Pace | C | C |
| Mid Pace | B | C |
| Late Pace | F | F |
| Sprint FPS | C | B |
| Route FPS | C | D |
| Trainer Effectiveness | F | D |
| Jockey Effectiveness | F | F |
| 3rd Party Ratings | F | D |
| Predictions
AI-generated projections for the upcoming race, derived from prior AI analysis for speed and pace trends, surface and distance suitability, and current conditions. Grading scale: A = elite • B = above average • C = average • D = below average • F = poor • — = no data |
||
| Speed | D | F |
| Early Pace | C | D |
| Mid Pace | C | D |
| Late Pace | C | C |
A paid membership is required to view all stats. Subscribe now →
Chart Guide (2.0.03)
- Bubbles
- Color = surface: green (turf), brown (dirt), blue (synthetic)
- Number = finishing position
- Height above line = beaten lengths — closer means a smaller margin
- Border = track conditions: green (FST/GD/FM), yellow (WF/SL/YLD), red (SY/MY/FRZ/SFT/HVY)
- Connecting Line
- Solid = good conditions; dashed = bad conditions
- Line Symbol
- ▲ Triangle = sprint (7f or less); ● Circle = route (more than 7f)
- Bubble Size
- Color (brown-dirt, green-turf) and border (red-bad, green-good) convey surface and track conditions
- Shaded Band (Bollinger)
- Highlights volatility — a wider band means more variation in recent performance
- Performance Trend
- Straight line showing the overall performance direction — angled up = improving, angled down = declining
- Dashed Reference Line
- AI Opponent = AI analysis class-level par for the race
| Stat | vs. Current Card | vs. All Horses |
|---|---|---|
| Averages
Career-average metrics across all AI race analysis. Performance and pace averages reflect estimated historical performance; trainer and jockey grades score in-the-money percentages. Grading scale: A = elite • B = above average • C = average • D = below average • F = poor • — = no data |
||
| Pick Pony AI Rating | B | B |
| Speed | F | C |
| Early Pace | B | B |
| Mid Pace | C | B |
| Late Pace | D | C |
| Finish Pos | D | D |
| Dirt Speed | A | A |
| Turf Speed | A | A |
| Distance Speed | B | A |
| Trainer Effectiveness | B | B |
| Jockey Effectiveness | D | C |
| 3rd Party Ratings | B | B |
| Recent
Performance analysis from the horse's recent races, weighted to reflect current form. Sprint and Route FPS (Foot Per Second) measure pace efficiency over the horse's recent sprints and routes respectively. Grading scale: A = elite • B = above average • C = average • D = below average • F = poor • — = no data |
||
| Speed | F | C |
| Early Pace | C | D |
| Mid Pace | C | C |
| Late Pace | D | C |
| Sprint FPS | A | C |
| Route FPS | A | C |
| Trainer Effectiveness | B | B |
| Jockey Effectiveness | D | C |
| 3rd Party Ratings | B | B |
| Predictions
AI-generated projections for the upcoming race, derived from prior AI analysis for speed and pace trends, surface and distance suitability, and current conditions. Grading scale: A = elite • B = above average • C = average • D = below average • F = poor • — = no data |
||
| Speed | C | C |
| Early Pace | B | D |
| Mid Pace | C | C |
| Late Pace | C | C |
A paid membership is required to view all stats. Subscribe now →
Chart Guide (2.0.03)
- Bubbles
- Color = surface: green (turf), brown (dirt), blue (synthetic)
- Number = finishing position
- Height above line = beaten lengths — closer means a smaller margin
- Border = track conditions: green (FST/GD/FM), yellow (WF/SL/YLD), red (SY/MY/FRZ/SFT/HVY)
- Connecting Line
- Solid = good conditions; dashed = bad conditions
- Line Symbol
- ▲ Triangle = sprint (7f or less); ● Circle = route (more than 7f)
- Bubble Size
- Color (brown-dirt, green-turf) and border (red-bad, green-good) convey surface and track conditions
- Shaded Band (Bollinger)
- Highlights volatility — a wider band means more variation in recent performance
- Performance Trend
- Straight line showing the overall performance direction — angled up = improving, angled down = declining
- Dashed Reference Line
- AI Opponent = AI analysis class-level par for the race
| Stat | vs. Current Card | vs. All Horses |
|---|---|---|
| Averages
Career-average metrics across all AI race analysis. Performance and pace averages reflect estimated historical performance; trainer and jockey grades score in-the-money percentages. Grading scale: A = elite • B = above average • C = average • D = below average • F = poor • — = no data |
||
| Pick Pony AI Rating | D | C |
| Speed | C | B |
| Early Pace | F | C |
| Mid Pace | F | C |
| Late Pace | A | A |
| Finish Pos | B | C |
| Dirt Speed | D | B |
| Turf Speed | F | C |
| Distance Speed | F | B |
| Trainer Effectiveness | D | C |
| Jockey Effectiveness | B | B |
| 3rd Party Ratings | D | C |
| Recent
Performance analysis from the horse's recent races, weighted to reflect current form. Sprint and Route FPS (Foot Per Second) measure pace efficiency over the horse's recent sprints and routes respectively. Grading scale: A = elite • B = above average • C = average • D = below average • F = poor • — = no data |
||
| Speed | D | C |
| Early Pace | D | D |
| Mid Pace | D | C |
| Late Pace | B | A |
| Sprint FPS | C | C |
| Route FPS | B | C |
| Trainer Effectiveness | D | C |
| Jockey Effectiveness | B | B |
| 3rd Party Ratings | D | C |
| Predictions
AI-generated projections for the upcoming race, derived from prior AI analysis for speed and pace trends, surface and distance suitability, and current conditions. Grading scale: A = elite • B = above average • C = average • D = below average • F = poor • — = no data |
||
| Speed | A | B |
| Early Pace | D | D |
| Mid Pace | C | C |
| Late Pace | C | C |
A paid membership is required to view all stats. Subscribe now →
Chart Guide (2.0.03)
- Bubbles
- Color = surface: green (turf), brown (dirt), blue (synthetic)
- Number = finishing position
- Height above line = beaten lengths — closer means a smaller margin
- Border = track conditions: green (FST/GD/FM), yellow (WF/SL/YLD), red (SY/MY/FRZ/SFT/HVY)
- Connecting Line
- Solid = good conditions; dashed = bad conditions
- Line Symbol
- ▲ Triangle = sprint (7f or less); ● Circle = route (more than 7f)
- Bubble Size
- Color (brown-dirt, green-turf) and border (red-bad, green-good) convey surface and track conditions
- Shaded Band (Bollinger)
- Highlights volatility — a wider band means more variation in recent performance
- Performance Trend
- Straight line showing the overall performance direction — angled up = improving, angled down = declining
- Dashed Reference Line
- AI Opponent = AI analysis class-level par for the race
| Stat | vs. Current Card | vs. All Horses |
|---|---|---|
| Averages
Career-average metrics across all AI race analysis. Performance and pace averages reflect estimated historical performance; trainer and jockey grades score in-the-money percentages. Grading scale: A = elite • B = above average • C = average • D = below average • F = poor • — = no data |
||
| Pick Pony AI Rating | C | C |
| Speed | A | B |
| Early Pace | C | B |
| Mid Pace | B | B |
| Late Pace | B | A |
| Finish Pos | B | C |
| Dirt Speed | B | A |
| Turf Speed | D | C |
| Distance Speed | D | B |
| Trainer Effectiveness | C | C |
| Jockey Effectiveness | F | D |
| 3rd Party Ratings | A | B |
| Recent
Performance analysis from the horse's recent races, weighted to reflect current form. Sprint and Route FPS (Foot Per Second) measure pace efficiency over the horse's recent sprints and routes respectively. Grading scale: A = elite • B = above average • C = average • D = below average • F = poor • — = no data |
||
| Speed | A | B |
| Early Pace | B | C |
| Mid Pace | A | B |
| Late Pace | C | A |
| Sprint FPS | C | C |
| Route FPS | C | C |
| Trainer Effectiveness | C | C |
| Jockey Effectiveness | F | D |
| 3rd Party Ratings | A | B |
| Predictions
AI-generated projections for the upcoming race, derived from prior AI analysis for speed and pace trends, surface and distance suitability, and current conditions. Grading scale: A = elite • B = above average • C = average • D = below average • F = poor • — = no data |
||
| Speed | F | D |
| Early Pace | C | D |
| Mid Pace | B | C |
| Late Pace | C | C |
A paid membership is required to view all stats. Subscribe now →
Chart Guide (2.0.03)
- Bubbles
- Color = surface: green (turf), brown (dirt), blue (synthetic)
- Number = finishing position
- Height above line = beaten lengths — closer means a smaller margin
- Border = track conditions: green (FST/GD/FM), yellow (WF/SL/YLD), red (SY/MY/FRZ/SFT/HVY)
- Connecting Line
- Solid = good conditions; dashed = bad conditions
- Line Symbol
- ▲ Triangle = sprint (7f or less); ● Circle = route (more than 7f)
- Bubble Size
- Color (brown-dirt, green-turf) and border (red-bad, green-good) convey surface and track conditions
- Shaded Band (Bollinger)
- Highlights volatility — a wider band means more variation in recent performance
- Performance Trend
- Straight line showing the overall performance direction — angled up = improving, angled down = declining
- Dashed Reference Line
- AI Opponent = AI analysis class-level par for the race
| Stat | vs. Current Card | vs. All Horses |
|---|---|---|
| Averages
Career-average metrics across all AI race analysis. Performance and pace averages reflect estimated historical performance; trainer and jockey grades score in-the-money percentages. Grading scale: A = elite • B = above average • C = average • D = below average • F = poor • — = no data |
||
| Pick Pony AI Rating | A | A |
| Speed | B | B |
| Early Pace | A | B |
| Mid Pace | A | A |
| Late Pace | C | B |
| Finish Pos | D | D |
| Dirt Speed | A | A |
| Turf Speed | C | B |
| Distance Speed | C | A |
| Trainer Effectiveness | A | A |
| Jockey Effectiveness | A | A |
| 3rd Party Ratings | A | A |
| Recent
Performance analysis from the horse's recent races, weighted to reflect current form. Sprint and Route FPS (Foot Per Second) measure pace efficiency over the horse's recent sprints and routes respectively. Grading scale: A = elite • B = above average • C = average • D = below average • F = poor • — = no data |
||
| Speed | C | C |
| Early Pace | A | B |
| Mid Pace | A | B |
| Late Pace | F | C |
| Sprint FPS | B | C |
| Route FPS | D | D |
| Trainer Effectiveness | A | A |
| Jockey Effectiveness | A | A |
| 3rd Party Ratings | A | A |
| Predictions
AI-generated projections for the upcoming race, derived from prior AI analysis for speed and pace trends, surface and distance suitability, and current conditions. Grading scale: A = elite • B = above average • C = average • D = below average • F = poor • — = no data |
||
| Speed | B | B |
| Early Pace | A | C |
| Mid Pace | A | C |
| Late Pace | C | C |
A paid membership is required to view all stats. Subscribe now →
Chart Guide (2.0.03)
- Bubbles
- Color = surface: green (turf), brown (dirt), blue (synthetic)
- Number = finishing position
- Height above line = beaten lengths — closer means a smaller margin
- Border = track conditions: green (FST/GD/FM), yellow (WF/SL/YLD), red (SY/MY/FRZ/SFT/HVY)
- Connecting Line
- Solid = good conditions; dashed = bad conditions
- Line Symbol
- ▲ Triangle = sprint (7f or less); ● Circle = route (more than 7f)
- Bubble Size
- Color (brown-dirt, green-turf) and border (red-bad, green-good) convey surface and track conditions
- Shaded Band (Bollinger)
- Highlights volatility — a wider band means more variation in recent performance
- Performance Trend
- Straight line showing the overall performance direction — angled up = improving, angled down = declining
- Dashed Reference Line
- AI Opponent = AI analysis class-level par for the race
| Stat | vs. Current Card | vs. All Horses |
|---|---|---|
| Averages
Career-average metrics across all AI race analysis. Performance and pace averages reflect estimated historical performance; trainer and jockey grades score in-the-money percentages. Grading scale: A = elite • B = above average • C = average • D = below average • F = poor • — = no data |
||
| Pick Pony AI Rating | A | B |
| Speed | D | C |
| Early Pace | A | A |
| Mid Pace | A | A |
| Late Pace | F | C |
| Finish Pos | A | C |
| Dirt Speed | C | A |
| Turf Speed | C | B |
| Distance Speed | A | A |
| Trainer Effectiveness | D | C |
| Jockey Effectiveness | C | C |
| 3rd Party Ratings | C | B |
| Recent
Performance analysis from the horse's recent races, weighted to reflect current form. Sprint and Route FPS (Foot Per Second) measure pace efficiency over the horse's recent sprints and routes respectively. Grading scale: A = elite • B = above average • C = average • D = below average • F = poor • — = no data |
||
| Speed | C | B |
| Early Pace | A | B |
| Mid Pace | B | B |
| Late Pace | C | B |
| Sprint FPS | A | A |
| Route FPS | A | B |
| Trainer Effectiveness | D | C |
| Jockey Effectiveness | C | C |
| 3rd Party Ratings | C | B |
| Predictions
AI-generated projections for the upcoming race, derived from prior AI analysis for speed and pace trends, surface and distance suitability, and current conditions. Grading scale: A = elite • B = above average • C = average • D = below average • F = poor • — = no data |
||
| Speed | C | C |
| Early Pace | A | B |
| Mid Pace | A | B |
| Late Pace | C | C |
A paid membership is required to view all stats. Subscribe now →
Chart Guide (2.0.03)
- Bubbles
- Color = surface: green (turf), brown (dirt), blue (synthetic)
- Number = finishing position
- Height above line = beaten lengths — closer means a smaller margin
- Border = track conditions: green (FST/GD/FM), yellow (WF/SL/YLD), red (SY/MY/FRZ/SFT/HVY)
- Connecting Line
- Solid = good conditions; dashed = bad conditions
- Line Symbol
- ▲ Triangle = sprint (7f or less); ● Circle = route (more than 7f)
- Bubble Size
- Color (brown-dirt, green-turf) and border (red-bad, green-good) convey surface and track conditions
- Shaded Band (Bollinger)
- Highlights volatility — a wider band means more variation in recent performance
- Performance Trend
- Straight line showing the overall performance direction — angled up = improving, angled down = declining
- Dashed Reference Line
- AI Opponent = AI analysis class-level par for the race
| Stat | vs. Current Card | vs. All Horses |
|---|---|---|
| Averages
Career-average metrics across all AI race analysis. Performance and pace averages reflect estimated historical performance; trainer and jockey grades score in-the-money percentages. Grading scale: A = elite • B = above average • C = average • D = below average • F = poor • — = no data |
||
| Pick Pony AI Rating | F | D |
| Speed | A | A |
| Early Pace | D | C |
| Mid Pace | D | C |
| Late Pace | A | A |
| Finish Pos | C | C |
| Dirt Speed | D | B |
| Turf Speed | B | A |
| Distance Speed | C | A |
| Trainer Effectiveness | A | B |
| Jockey Effectiveness | C | C |
| 3rd Party Ratings | C | B |
| Recent
Performance analysis from the horse's recent races, weighted to reflect current form. Sprint and Route FPS (Foot Per Second) measure pace efficiency over the horse's recent sprints and routes respectively. Grading scale: A = elite • B = above average • C = average • D = below average • F = poor • — = no data |
||
| Speed | A | A |
| Early Pace | F | D |
| Mid Pace | F | D |
| Late Pace | A | A |
| Sprint FPS | F | F |
| Route FPS | F | F |
| Trainer Effectiveness | A | B |
| Jockey Effectiveness | C | C |
| 3rd Party Ratings | C | B |
| Predictions
AI-generated projections for the upcoming race, derived from prior AI analysis for speed and pace trends, surface and distance suitability, and current conditions. Grading scale: A = elite • B = above average • C = average • D = below average • F = poor • — = no data |
||
| Speed | A | B |
| Early Pace | F | F |
| Mid Pace | F | D |
| Late Pace | C | C |
A paid membership is required to view all stats. Subscribe now →
Chart Guide (2.0.03)
- Bubbles
- Color = surface: green (turf), brown (dirt), blue (synthetic)
- Number = finishing position
- Height above line = beaten lengths — closer means a smaller margin
- Border = track conditions: green (FST/GD/FM), yellow (WF/SL/YLD), red (SY/MY/FRZ/SFT/HVY)
- Connecting Line
- Solid = good conditions; dashed = bad conditions
- Line Symbol
- ▲ Triangle = sprint (7f or less); ● Circle = route (more than 7f)
- Bubble Size
- Color (brown-dirt, green-turf) and border (red-bad, green-good) convey surface and track conditions
- Shaded Band (Bollinger)
- Highlights volatility — a wider band means more variation in recent performance
- Performance Trend
- Straight line showing the overall performance direction — angled up = improving, angled down = declining
- Dashed Reference Line
- AI Opponent = AI analysis class-level par for the race
| Stat | vs. Current Card | vs. All Horses |
|---|---|---|
| Averages
Career-average metrics across all AI race analysis. Performance and pace averages reflect estimated historical performance; trainer and jockey grades score in-the-money percentages. Grading scale: A = elite • B = above average • C = average • D = below average • F = poor • — = no data |
||
| Pick Pony AI Rating | C | C |
| Speed | C | B |
| Early Pace | C | C |
| Mid Pace | C | B |
| Late Pace | C | B |
| Finish Pos | F | F |
| Dirt Speed | C | A |
| Turf Speed | A | A |
| Distance Speed | A | A |
| Trainer Effectiveness | F | D |
| Jockey Effectiveness | A | A |
| 3rd Party Ratings | F | C |
| Recent
Performance analysis from the horse's recent races, weighted to reflect current form. Sprint and Route FPS (Foot Per Second) measure pace efficiency over the horse's recent sprints and routes respectively. Grading scale: A = elite • B = above average • C = average • D = below average • F = poor • — = no data |
||
| Speed | B | B |
| Early Pace | C | D |
| Mid Pace | C | C |
| Late Pace | A | A |
| Sprint FPS | D | D |
| Route FPS | C | C |
| Trainer Effectiveness | F | D |
| Jockey Effectiveness | A | A |
| 3rd Party Ratings | F | C |
| Predictions
AI-generated projections for the upcoming race, derived from prior AI analysis for speed and pace trends, surface and distance suitability, and current conditions. Grading scale: A = elite • B = above average • C = average • D = below average • F = poor • — = no data |
||
| Speed | D | C |
| Early Pace | C | D |
| Mid Pace | D | D |
| Late Pace | C | C |
A paid membership is required to view all stats. Subscribe now →
Chart Guide (2.0.03)
- Bubbles
- Color = surface: green (turf), brown (dirt), blue (synthetic)
- Number = finishing position
- Height above line = beaten lengths — closer means a smaller margin
- Border = track conditions: green (FST/GD/FM), yellow (WF/SL/YLD), red (SY/MY/FRZ/SFT/HVY)
- Connecting Line
- Solid = good conditions; dashed = bad conditions
- Line Symbol
- ▲ Triangle = sprint (7f or less); ● Circle = route (more than 7f)
- Bubble Size
- Color (brown-dirt, green-turf) and border (red-bad, green-good) convey surface and track conditions
- Shaded Band (Bollinger)
- Highlights volatility — a wider band means more variation in recent performance
- Performance Trend
- Straight line showing the overall performance direction — angled up = improving, angled down = declining
- Dashed Reference Line
- AI Opponent = AI analysis class-level par for the race
| Stat | vs. Current Card | vs. All Horses |
|---|---|---|
| Averages
Career-average metrics across all AI race analysis. Performance and pace averages reflect estimated historical performance; trainer and jockey grades score in-the-money percentages. Grading scale: A = elite • B = above average • C = average • D = below average • F = poor • — = no data |
||
| Pick Pony AI Rating | F | F |
| Speed | F | F |
| Early Pace | B | A |
| Mid Pace | B | C |
| Late Pace | F | F |
| Finish Pos | F | F |
| Dirt Speed | A | C |
| Turf Speed | D | D |
| Distance Speed | F | D |
| Trainer Effectiveness | C | B |
| Jockey Effectiveness | D | D |
| 3rd Party Ratings | F | F |
| Recent
Performance analysis from the horse's recent races, weighted to reflect current form. Sprint and Route FPS (Foot Per Second) measure pace efficiency over the horse's recent sprints and routes respectively. Grading scale: A = elite • B = above average • C = average • D = below average • F = poor • — = no data |
||
| Speed | F | F |
| Early Pace | C | B |
| Mid Pace | C | D |
| Late Pace | F | F |
| Sprint FPS | C | B |
| Route FPS | B | C |
| Trainer Effectiveness | C | B |
| Jockey Effectiveness | D | D |
| 3rd Party Ratings | F | F |
| Predictions
AI-generated projections for the upcoming race, derived from prior AI analysis for speed and pace trends, surface and distance suitability, and current conditions. Grading scale: A = elite • B = above average • C = average • D = below average • F = poor • — = no data |
||
| Speed | F | F |
| Early Pace | C | A |
| Mid Pace | F | D |
| Late Pace | C | C |
A paid membership is required to view all stats. Subscribe now →
Chart Guide (2.0.03)
- Bubbles
- Color = surface: green (turf), brown (dirt), blue (synthetic)
- Number = finishing position
- Height above line = beaten lengths — closer means a smaller margin
- Border = track conditions: green (FST/GD/FM), yellow (WF/SL/YLD), red (SY/MY/FRZ/SFT/HVY)
- Connecting Line
- Solid = good conditions; dashed = bad conditions
- Line Symbol
- ▲ Triangle = sprint (7f or less); ● Circle = route (more than 7f)
- Bubble Size
- Color (brown-dirt, green-turf) and border (red-bad, green-good) convey surface and track conditions
- Shaded Band (Bollinger)
- Highlights volatility — a wider band means more variation in recent performance
- Performance Trend
- Straight line showing the overall performance direction — angled up = improving, angled down = declining
- Dashed Reference Line
- AI Opponent = AI analysis class-level par for the race
| Stat | vs. Current Card | vs. All Horses |
|---|---|---|
| Averages
Career-average metrics across all AI race analysis. Performance and pace averages reflect estimated historical performance; trainer and jockey grades score in-the-money percentages. Grading scale: A = elite • B = above average • C = average • D = below average • F = poor • — = no data |
||
| Pick Pony AI Rating | B | D |
| Speed | C | F |
| Early Pace | A | A |
| Mid Pace | A | B |
| Late Pace | C | F |
| Finish Pos | C | F |
| Dirt Speed | B | C |
| Turf Speed | D | D |
| Distance Speed | B | D |
| Trainer Effectiveness | D | B |
| Jockey Effectiveness | A | C |
| 3rd Party Ratings | D | F |
| Recent
Performance analysis from the horse's recent races, weighted to reflect current form. Sprint and Route FPS (Foot Per Second) measure pace efficiency over the horse's recent sprints and routes respectively. Grading scale: A = elite • B = above average • C = average • D = below average • F = poor • — = no data |
||
| Speed | D | F |
| Early Pace | B | A |
| Mid Pace | B | C |
| Late Pace | C | D |
| Sprint FPS | A | A |
| Route FPS | C | C |
| Trainer Effectiveness | D | B |
| Jockey Effectiveness | A | C |
| 3rd Party Ratings | D | F |
| Predictions
AI-generated projections for the upcoming race, derived from prior AI analysis for speed and pace trends, surface and distance suitability, and current conditions. Grading scale: A = elite • B = above average • C = average • D = below average • F = poor • — = no data |
||
| Speed | C | F |
| Early Pace | A | A |
| Mid Pace | B | C |
| Late Pace | C | C |
A paid membership is required to view all stats. Subscribe now →
Chart Guide (2.0.03)
- Bubbles
- Color = surface: green (turf), brown (dirt), blue (synthetic)
- Number = finishing position
- Height above line = beaten lengths — closer means a smaller margin
- Border = track conditions: green (FST/GD/FM), yellow (WF/SL/YLD), red (SY/MY/FRZ/SFT/HVY)
- Connecting Line
- Solid = good conditions; dashed = bad conditions
- Line Symbol
- ▲ Triangle = sprint (7f or less); ● Circle = route (more than 7f)
- Bubble Size
- Color (brown-dirt, green-turf) and border (red-bad, green-good) convey surface and track conditions
- Shaded Band (Bollinger)
- Highlights volatility — a wider band means more variation in recent performance
- Performance Trend
- Straight line showing the overall performance direction — angled up = improving, angled down = declining
- Dashed Reference Line
- AI Opponent = AI analysis class-level par for the race
| Stat | vs. Current Card | vs. All Horses |
|---|---|---|
| Averages
Career-average metrics across all AI race analysis. Performance and pace averages reflect estimated historical performance; trainer and jockey grades score in-the-money percentages. Grading scale: A = elite • B = above average • C = average • D = below average • F = poor • — = no data |
||
| Pick Pony AI Rating | A | B |
| Speed | A | D |
| Early Pace | C | A |
| Mid Pace | D | D |
| Late Pace | A | C |
| Finish Pos | A | C |
| Dirt Speed | B | C |
| Turf Speed | B | B |
| Distance Speed | A | C |
| Trainer Effectiveness | A | B |
| Jockey Effectiveness | F | D |
| 3rd Party Ratings | A | C |
| Recent
Performance analysis from the horse's recent races, weighted to reflect current form. Sprint and Route FPS (Foot Per Second) measure pace efficiency over the horse's recent sprints and routes respectively. Grading scale: A = elite • B = above average • C = average • D = below average • F = poor • — = no data |
||
| Speed | A | D |
| Early Pace | A | A |
| Mid Pace | A | A |
| Late Pace | A | D |
| Sprint FPS | A | A |
| Route FPS | A | A |
| Trainer Effectiveness | A | B |
| Jockey Effectiveness | F | D |
| 3rd Party Ratings | A | C |
| Predictions
AI-generated projections for the upcoming race, derived from prior AI analysis for speed and pace trends, surface and distance suitability, and current conditions. Grading scale: A = elite • B = above average • C = average • D = below average • F = poor • — = no data |
||
| Speed | A | D |
| Early Pace | B | A |
| Mid Pace | A | B |
| Late Pace | C | C |
A paid membership is required to view all stats. Subscribe now →
Chart Guide (2.0.03)
- Bubbles
- Color = surface: green (turf), brown (dirt), blue (synthetic)
- Number = finishing position
- Height above line = beaten lengths — closer means a smaller margin
- Border = track conditions: green (FST/GD/FM), yellow (WF/SL/YLD), red (SY/MY/FRZ/SFT/HVY)
- Connecting Line
- Solid = good conditions; dashed = bad conditions
- Line Symbol
- ▲ Triangle = sprint (7f or less); ● Circle = route (more than 7f)
- Bubble Size
- Color (brown-dirt, green-turf) and border (red-bad, green-good) convey surface and track conditions
- Shaded Band (Bollinger)
- Highlights volatility — a wider band means more variation in recent performance
- Performance Trend
- Straight line showing the overall performance direction — angled up = improving, angled down = declining
- Dashed Reference Line
- AI Opponent = AI analysis class-level par for the race
| Stat | vs. Current Card | vs. All Horses |
|---|---|---|
| Averages
Career-average metrics across all AI race analysis. Performance and pace averages reflect estimated historical performance; trainer and jockey grades score in-the-money percentages. Grading scale: A = elite • B = above average • C = average • D = below average • F = poor • — = no data |
||
| Pick Pony AI Rating | C | D |
| Speed | C | F |
| Early Pace | D | B |
| Mid Pace | C | C |
| Late Pace | B | D |
| Finish Pos | B | D |
| Dirt Speed | F | D |
| Turf Speed | C | C |
| Distance Speed | C | D |
| Trainer Effectiveness | C | B |
| Jockey Effectiveness | C | C |
| 3rd Party Ratings | C | F |
| Recent
Performance analysis from the horse's recent races, weighted to reflect current form. Sprint and Route FPS (Foot Per Second) measure pace efficiency over the horse's recent sprints and routes respectively. Grading scale: A = elite • B = above average • C = average • D = below average • F = poor • — = no data |
||
| Speed | B | F |
| Early Pace | F | C |
| Mid Pace | C | D |
| Late Pace | A | C |
| Sprint FPS | F | C |
| Route FPS | F | D |
| Trainer Effectiveness | C | B |
| Jockey Effectiveness | C | C |
| 3rd Party Ratings | C | F |
| Predictions
AI-generated projections for the upcoming race, derived from prior AI analysis for speed and pace trends, surface and distance suitability, and current conditions. Grading scale: A = elite • B = above average • C = average • D = below average • F = poor • — = no data |
||
| Speed | C | F |
| Early Pace | F | C |
| Mid Pace | D | D |
| Late Pace | C | C |
A paid membership is required to view all stats. Subscribe now →
Chart Guide (2.0.03)
- Bubbles
- Color = surface: green (turf), brown (dirt), blue (synthetic)
- Number = finishing position
- Height above line = beaten lengths — closer means a smaller margin
- Border = track conditions: green (FST/GD/FM), yellow (WF/SL/YLD), red (SY/MY/FRZ/SFT/HVY)
- Connecting Line
- Solid = good conditions; dashed = bad conditions
- Line Symbol
- ▲ Triangle = sprint (7f or less); ● Circle = route (more than 7f)
- Bubble Size
- Color (brown-dirt, green-turf) and border (red-bad, green-good) convey surface and track conditions
- Shaded Band (Bollinger)
- Highlights volatility — a wider band means more variation in recent performance
- Performance Trend
- Straight line showing the overall performance direction — angled up = improving, angled down = declining
- Dashed Reference Line
- AI Opponent = AI analysis class-level par for the race
| Stat | vs. Current Card | vs. All Horses |
|---|---|---|
| Averages
Career-average metrics across all AI race analysis. Performance and pace averages reflect estimated historical performance; trainer and jockey grades score in-the-money percentages. Grading scale: A = elite • B = above average • C = average • D = below average • F = poor • — = no data |
||
| Pick Pony AI Rating | A | C |
| Speed | B | F |
| Early Pace | C | A |
| Mid Pace | A | A |
| Late Pace | D | F |
| Finish Pos | C | F |
| Dirt Speed | D | D |
| Turf Speed | A | A |
| Distance Speed | D | D |
| Trainer Effectiveness | B | B |
| Jockey Effectiveness | A | B |
| 3rd Party Ratings | B | D |
| Recent
Performance analysis from the horse's recent races, weighted to reflect current form. Sprint and Route FPS (Foot Per Second) measure pace efficiency over the horse's recent sprints and routes respectively. Grading scale: A = elite • B = above average • C = average • D = below average • F = poor • — = no data |
||
| Speed | C | F |
| Early Pace | C | B |
| Mid Pace | A | C |
| Late Pace | C | D |
| Sprint FPS | D | C |
| Route FPS | C | C |
| Trainer Effectiveness | B | B |
| Jockey Effectiveness | A | B |
| 3rd Party Ratings | B | D |
| Predictions
AI-generated projections for the upcoming race, derived from prior AI analysis for speed and pace trends, surface and distance suitability, and current conditions. Grading scale: A = elite • B = above average • C = average • D = below average • F = poor • — = no data |
||
| Speed | B | F |
| Early Pace | C | B |
| Mid Pace | A | C |
| Late Pace | C | C |
A paid membership is required to view all stats. Subscribe now →
Chart Guide (2.0.03)
- Bubbles
- Color = surface: green (turf), brown (dirt), blue (synthetic)
- Number = finishing position
- Height above line = beaten lengths — closer means a smaller margin
- Border = track conditions: green (FST/GD/FM), yellow (WF/SL/YLD), red (SY/MY/FRZ/SFT/HVY)
- Connecting Line
- Solid = good conditions; dashed = bad conditions
- Line Symbol
- ▲ Triangle = sprint (7f or less); ● Circle = route (more than 7f)
- Bubble Size
- Color (brown-dirt, green-turf) and border (red-bad, green-good) convey surface and track conditions
- Shaded Band (Bollinger)
- Highlights volatility — a wider band means more variation in recent performance
- Performance Trend
- Straight line showing the overall performance direction — angled up = improving, angled down = declining
- Dashed Reference Line
- AI Opponent = AI analysis class-level par for the race
| Stat | vs. Current Card | vs. All Horses |
|---|---|---|
| Averages
Career-average metrics across all AI race analysis. Performance and pace averages reflect estimated historical performance; trainer and jockey grades score in-the-money percentages. Grading scale: A = elite • B = above average • C = average • D = below average • F = poor • — = no data |
||
| Pick Pony AI Rating | D | D |
| Speed | D | F |
| Early Pace | A | A |
| Mid Pace | F | D |
| Late Pace | C | F |
| Finish Pos | D | F |
| Dirt Speed | C | C |
| Turf Speed | A | B |
| Distance Speed | C | D |
| Trainer Effectiveness | F | D |
| Jockey Effectiveness | B | C |
| 3rd Party Ratings | C | F |
| Recent
Performance analysis from the horse's recent races, weighted to reflect current form. Sprint and Route FPS (Foot Per Second) measure pace efficiency over the horse's recent sprints and routes respectively. Grading scale: A = elite • B = above average • C = average • D = below average • F = poor • — = no data |
||
| Speed | C | F |
| Early Pace | A | A |
| Mid Pace | F | F |
| Late Pace | C | D |
| Sprint FPS | B | B |
| Route FPS | D | D |
| Trainer Effectiveness | F | D |
| Jockey Effectiveness | B | C |
| 3rd Party Ratings | C | F |
| Predictions
AI-generated projections for the upcoming race, derived from prior AI analysis for speed and pace trends, surface and distance suitability, and current conditions. Grading scale: A = elite • B = above average • C = average • D = below average • F = poor • — = no data |
||
| Speed | D | F |
| Early Pace | A | A |
| Mid Pace | C | C |
| Late Pace | C | C |
A paid membership is required to view all stats. Subscribe now →
Chart Guide (2.0.03)
- Bubbles
- Color = surface: green (turf), brown (dirt), blue (synthetic)
- Number = finishing position
- Height above line = beaten lengths — closer means a smaller margin
- Border = track conditions: green (FST/GD/FM), yellow (WF/SL/YLD), red (SY/MY/FRZ/SFT/HVY)
- Connecting Line
- Solid = good conditions; dashed = bad conditions
- Line Symbol
- ▲ Triangle = sprint (7f or less); ● Circle = route (more than 7f)
- Bubble Size
- Color (brown-dirt, green-turf) and border (red-bad, green-good) convey surface and track conditions
- Shaded Band (Bollinger)
- Highlights volatility — a wider band means more variation in recent performance
- Performance Trend
- Straight line showing the overall performance direction — angled up = improving, angled down = declining
- Dashed Reference Line
- AI Opponent = AI analysis class-level par for the race
| Stat | vs. Current Card | vs. All Horses |
|---|---|---|
| Averages
Career-average metrics across all AI race analysis. Performance and pace averages reflect estimated historical performance; trainer and jockey grades score in-the-money percentages. Grading scale: A = elite • B = above average • C = average • D = below average • F = poor • — = no data |
||
| Pick Pony AI Rating | C | D |
| Speed | A | D |
| Early Pace | F | B |
| Mid Pace | C | C |
| Late Pace | A | D |
| Finish Pos | B | D |
| Dirt Speed | B | C |
| Turf Speed | D | D |
| Distance Speed | A | C |
| Trainer Effectiveness | A | B |
| Jockey Effectiveness | C | D |
| 3rd Party Ratings | A | D |
| Recent
Performance analysis from the horse's recent races, weighted to reflect current form. Sprint and Route FPS (Foot Per Second) measure pace efficiency over the horse's recent sprints and routes respectively. Grading scale: A = elite • B = above average • C = average • D = below average • F = poor • — = no data |
||
| Speed | A | D |
| Early Pace | D | C |
| Mid Pace | D | F |
| Late Pace | B | D |
| Sprint FPS | B | B |
| Route FPS | A | C |
| Trainer Effectiveness | A | B |
| Jockey Effectiveness | C | D |
| 3rd Party Ratings | A | D |
| Predictions
AI-generated projections for the upcoming race, derived from prior AI analysis for speed and pace trends, surface and distance suitability, and current conditions. Grading scale: A = elite • B = above average • C = average • D = below average • F = poor • — = no data |
||
| Speed | A | D |
| Early Pace | D | B |
| Mid Pace | C | C |
| Late Pace | C | C |
A paid membership is required to view all stats. Subscribe now →
Chart Guide (2.0.03)
- Bubbles
- Color = surface: green (turf), brown (dirt), blue (synthetic)
- Number = finishing position
- Height above line = beaten lengths — closer means a smaller margin
- Border = track conditions: green (FST/GD/FM), yellow (WF/SL/YLD), red (SY/MY/FRZ/SFT/HVY)
- Connecting Line
- Solid = good conditions; dashed = bad conditions
- Line Symbol
- ▲ Triangle = sprint (7f or less); ● Circle = route (more than 7f)
- Bubble Size
- Color (brown-dirt, green-turf) and border (red-bad, green-good) convey surface and track conditions
- Shaded Band (Bollinger)
- Highlights volatility — a wider band means more variation in recent performance
- Performance Trend
- Straight line showing the overall performance direction — angled up = improving, angled down = declining
- Dashed Reference Line
- AI Opponent = AI analysis class-level par for the race
| Stat | vs. Current Card | vs. All Horses |
|---|---|---|
| Averages
Career-average metrics across all AI race analysis. Performance and pace averages reflect estimated historical performance; trainer and jockey grades score in-the-money percentages. Grading scale: A = elite • B = above average • C = average • D = below average • F = poor • — = no data |
||
| Pick Pony AI Rating | D | C |
| Speed | D | F |
| Early Pace | F | D |
| Mid Pace | F | D |
| Late Pace | F | D |
| Finish Pos | F | D |
| Dirt Speed | D | D |
| Turf Speed | C | D |
| Distance Speed | C | C |
| Trainer Effectiveness | F | D |
| Jockey Effectiveness | F | D |
| 3rd Party Ratings | D | C |
| Recent
Performance analysis from the horse's recent races, weighted to reflect current form. Sprint and Route FPS (Foot Per Second) measure pace efficiency over the horse's recent sprints and routes respectively. Grading scale: A = elite • B = above average • C = average • D = below average • F = poor • — = no data |
||
| Speed | D | D |
| Early Pace | C | B |
| Mid Pace | F | D |
| Late Pace | D | D |
| Sprint FPS | B | B |
| Route FPS | F | D |
| Trainer Effectiveness | F | D |
| Jockey Effectiveness | F | D |
| 3rd Party Ratings | D | C |
| Predictions
AI-generated projections for the upcoming race, derived from prior AI analysis for speed and pace trends, surface and distance suitability, and current conditions. Grading scale: A = elite • B = above average • C = average • D = below average • F = poor • — = no data |
||
| Speed | A | D |
| Early Pace | A | A |
| Mid Pace | F | D |
| Late Pace | C | C |
A paid membership is required to view all stats. Subscribe now →
Chart Guide (2.0.03)
- Bubbles
- Color = surface: green (turf), brown (dirt), blue (synthetic)
- Number = finishing position
- Height above line = beaten lengths — closer means a smaller margin
- Border = track conditions: green (FST/GD/FM), yellow (WF/SL/YLD), red (SY/MY/FRZ/SFT/HVY)
- Connecting Line
- Solid = good conditions; dashed = bad conditions
- Line Symbol
- ▲ Triangle = sprint (7f or less); ● Circle = route (more than 7f)
- Bubble Size
- Color (brown-dirt, green-turf) and border (red-bad, green-good) convey surface and track conditions
- Shaded Band (Bollinger)
- Highlights volatility — a wider band means more variation in recent performance
- Performance Trend
- Straight line showing the overall performance direction — angled up = improving, angled down = declining
- Dashed Reference Line
- AI Opponent = AI analysis class-level par for the race
| Stat | vs. Current Card | vs. All Horses |
|---|---|---|
| Averages
Career-average metrics across all AI race analysis. Performance and pace averages reflect estimated historical performance; trainer and jockey grades score in-the-money percentages. Grading scale: A = elite • B = above average • C = average • D = below average • F = poor • — = no data |
||
| Pick Pony AI Rating | C | C |
| Speed | C | D |
| Early Pace | B | C |
| Mid Pace | C | C |
| Late Pace | B | C |
| Finish Pos | A | C |
| Dirt Speed | A | C |
| Turf Speed | C | D |
| Distance Speed | F | D |
| Trainer Effectiveness | B | B |
| Jockey Effectiveness | A | A |
| 3rd Party Ratings | A | C |
| Recent
Performance analysis from the horse's recent races, weighted to reflect current form. Sprint and Route FPS (Foot Per Second) measure pace efficiency over the horse's recent sprints and routes respectively. Grading scale: A = elite • B = above average • C = average • D = below average • F = poor • — = no data |
||
| Speed | A | B |
| Early Pace | C | B |
| Mid Pace | B | B |
| Late Pace | A | A |
| Sprint FPS | C | C |
| Route FPS | C | C |
| Trainer Effectiveness | B | B |
| Jockey Effectiveness | A | A |
| 3rd Party Ratings | A | C |
| Predictions
AI-generated projections for the upcoming race, derived from prior AI analysis for speed and pace trends, surface and distance suitability, and current conditions. Grading scale: A = elite • B = above average • C = average • D = below average • F = poor • — = no data |
||
| Speed | D | F |
| Early Pace | C | C |
| Mid Pace | C | C |
| Late Pace | C | C |
A paid membership is required to view all stats. Subscribe now →
Chart Guide (2.0.03)
- Bubbles
- Color = surface: green (turf), brown (dirt), blue (synthetic)
- Number = finishing position
- Height above line = beaten lengths — closer means a smaller margin
- Border = track conditions: green (FST/GD/FM), yellow (WF/SL/YLD), red (SY/MY/FRZ/SFT/HVY)
- Connecting Line
- Solid = good conditions; dashed = bad conditions
- Line Symbol
- ▲ Triangle = sprint (7f or less); ● Circle = route (more than 7f)
- Bubble Size
- Color (brown-dirt, green-turf) and border (red-bad, green-good) convey surface and track conditions
- Shaded Band (Bollinger)
- Highlights volatility — a wider band means more variation in recent performance
- Performance Trend
- Straight line showing the overall performance direction — angled up = improving, angled down = declining
- Dashed Reference Line
- AI Opponent = AI analysis class-level par for the race
| Stat | vs. Current Card | vs. All Horses |
|---|---|---|
| Averages
Career-average metrics across all AI race analysis. Performance and pace averages reflect estimated historical performance; trainer and jockey grades score in-the-money percentages. Grading scale: A = elite • B = above average • C = average • D = below average • F = poor • — = no data |
||
| Pick Pony AI Rating | C | C |
| Speed | B | D |
| Early Pace | D | D |
| Mid Pace | D | D |
| Late Pace | C | D |
| Finish Pos | C | D |
| Dirt Speed | B | C |
| Turf Speed | C | D |
| Distance Speed | B | C |
| Trainer Effectiveness | C | B |
| Jockey Effectiveness | B | B |
| 3rd Party Ratings | C | C |
| Recent
Performance analysis from the horse's recent races, weighted to reflect current form. Sprint and Route FPS (Foot Per Second) measure pace efficiency over the horse's recent sprints and routes respectively. Grading scale: A = elite • B = above average • C = average • D = below average • F = poor • — = no data |
||
| Speed | A | C |
| Early Pace | B | B |
| Mid Pace | D | D |
| Late Pace | B | C |
| Sprint FPS | A | A |
| Route FPS | A | A |
| Trainer Effectiveness | C | B |
| Jockey Effectiveness | B | B |
| 3rd Party Ratings | C | C |
| Predictions
AI-generated projections for the upcoming race, derived from prior AI analysis for speed and pace trends, surface and distance suitability, and current conditions. Grading scale: A = elite • B = above average • C = average • D = below average • F = poor • — = no data |
||
| Speed | C | D |
| Early Pace | B | A |
| Mid Pace | A | B |
| Late Pace | C | C |
A paid membership is required to view all stats. Subscribe now →
Chart Guide (2.0.03)
- Bubbles
- Color = surface: green (turf), brown (dirt), blue (synthetic)
- Number = finishing position
- Height above line = beaten lengths — closer means a smaller margin
- Border = track conditions: green (FST/GD/FM), yellow (WF/SL/YLD), red (SY/MY/FRZ/SFT/HVY)
- Connecting Line
- Solid = good conditions; dashed = bad conditions
- Line Symbol
- ▲ Triangle = sprint (7f or less); ● Circle = route (more than 7f)
- Bubble Size
- Color (brown-dirt, green-turf) and border (red-bad, green-good) convey surface and track conditions
- Shaded Band (Bollinger)
- Highlights volatility — a wider band means more variation in recent performance
- Performance Trend
- Straight line showing the overall performance direction — angled up = improving, angled down = declining
- Dashed Reference Line
- AI Opponent = AI analysis class-level par for the race
| Stat | vs. Current Card | vs. All Horses |
|---|---|---|
| Averages
Career-average metrics across all AI race analysis. Performance and pace averages reflect estimated historical performance; trainer and jockey grades score in-the-money percentages. Grading scale: A = elite • B = above average • C = average • D = below average • F = poor • — = no data |
||
| Pick Pony AI Rating | A | B |
| Speed | C | D |
| Early Pace | A | C |
| Mid Pace | B | C |
| Late Pace | C | D |
| Finish Pos | B | C |
| Dirt Speed | C | C |
| Turf Speed | C | D |
| Distance Speed | B | C |
| Trainer Effectiveness | D | C |
| Jockey Effectiveness | C | B |
| 3rd Party Ratings | C | C |
| Recent
Performance analysis from the horse's recent races, weighted to reflect current form. Sprint and Route FPS (Foot Per Second) measure pace efficiency over the horse's recent sprints and routes respectively. Grading scale: A = elite • B = above average • C = average • D = below average • F = poor • — = no data |
||
| Speed | C | D |
| Early Pace | A | A |
| Mid Pace | A | B |
| Late Pace | C | C |
| Sprint FPS | A | A |
| Route FPS | A | A |
| Trainer Effectiveness | D | C |
| Jockey Effectiveness | C | B |
| 3rd Party Ratings | C | C |
| Predictions
AI-generated projections for the upcoming race, derived from prior AI analysis for speed and pace trends, surface and distance suitability, and current conditions. Grading scale: A = elite • B = above average • C = average • D = below average • F = poor • — = no data |
||
| Speed | C | D |
| Early Pace | A | A |
| Mid Pace | A | B |
| Late Pace | C | C |
A paid membership is required to view all stats. Subscribe now →
Chart Guide (2.0.03)
- Bubbles
- Color = surface: green (turf), brown (dirt), blue (synthetic)
- Number = finishing position
- Height above line = beaten lengths — closer means a smaller margin
- Border = track conditions: green (FST/GD/FM), yellow (WF/SL/YLD), red (SY/MY/FRZ/SFT/HVY)
- Connecting Line
- Solid = good conditions; dashed = bad conditions
- Line Symbol
- ▲ Triangle = sprint (7f or less); ● Circle = route (more than 7f)
- Bubble Size
- Color (brown-dirt, green-turf) and border (red-bad, green-good) convey surface and track conditions
- Shaded Band (Bollinger)
- Highlights volatility — a wider band means more variation in recent performance
- Performance Trend
- Straight line showing the overall performance direction — angled up = improving, angled down = declining
- Dashed Reference Line
- AI Opponent = AI analysis class-level par for the race
| Stat | vs. Current Card | vs. All Horses |
|---|---|---|
| Averages
Career-average metrics across all AI race analysis. Performance and pace averages reflect estimated historical performance; trainer and jockey grades score in-the-money percentages. Grading scale: A = elite • B = above average • C = average • D = below average • F = poor • — = no data |
||
| Pick Pony AI Rating | B | B |
| Speed | A | C |
| Early Pace | A | C |
| Mid Pace | A | C |
| Late Pace | A | C |
| Finish Pos | A | C |
| Dirt Speed | B | C |
| Turf Speed | C | D |
| Distance Speed | A | C |
| Trainer Effectiveness | A | A |
| Jockey Effectiveness | C | C |
| 3rd Party Ratings | A | C |
| Recent
Performance analysis from the horse's recent races, weighted to reflect current form. Sprint and Route FPS (Foot Per Second) measure pace efficiency over the horse's recent sprints and routes respectively. Grading scale: A = elite • B = above average • C = average • D = below average • F = poor • — = no data |
||
| Speed | B | C |
| Early Pace | A | A |
| Mid Pace | A | A |
| Late Pace | C | C |
| Sprint FPS | C | B |
| Route FPS | B | B |
| Trainer Effectiveness | A | A |
| Jockey Effectiveness | C | C |
| 3rd Party Ratings | A | C |
| Predictions
AI-generated projections for the upcoming race, derived from prior AI analysis for speed and pace trends, surface and distance suitability, and current conditions. Grading scale: A = elite • B = above average • C = average • D = below average • F = poor • — = no data |
||
| Speed | A | D |
| Early Pace | C | B |
| Mid Pace | B | B |
| Late Pace | C | C |
A paid membership is required to view all stats. Subscribe now →
Chart Guide (2.0.03)
- Bubbles
- Color = surface: green (turf), brown (dirt), blue (synthetic)
- Number = finishing position
- Height above line = beaten lengths — closer means a smaller margin
- Border = track conditions: green (FST/GD/FM), yellow (WF/SL/YLD), red (SY/MY/FRZ/SFT/HVY)
- Connecting Line
- Solid = good conditions; dashed = bad conditions
- Line Symbol
- ▲ Triangle = sprint (7f or less); ● Circle = route (more than 7f)
- Bubble Size
- Color (brown-dirt, green-turf) and border (red-bad, green-good) convey surface and track conditions
- Shaded Band (Bollinger)
- Highlights volatility — a wider band means more variation in recent performance
- Performance Trend
- Straight line showing the overall performance direction — angled up = improving, angled down = declining
- Dashed Reference Line
- AI Opponent = AI analysis class-level par for the race
| Stat | vs. Current Card | vs. All Horses |
|---|---|---|
| Averages
Career-average metrics across all AI race analysis. Performance and pace averages reflect estimated historical performance; trainer and jockey grades score in-the-money percentages. Grading scale: A = elite • B = above average • C = average • D = below average • F = poor • — = no data |
||
| Pick Pony AI Rating | F | D |
| Speed | F | F |
| Early Pace | C | D |
| Mid Pace | C | C |
| Late Pace | D | D |
| Finish Pos | C | D |
| Dirt Speed | F | D |
| Turf Speed | C | D |
| Distance Speed | D | D |
| Trainer Effectiveness | C | B |
| Jockey Effectiveness | D | C |
| 3rd Party Ratings | F | D |
| Recent
Performance analysis from the horse's recent races, weighted to reflect current form. Sprint and Route FPS (Foot Per Second) measure pace efficiency over the horse's recent sprints and routes respectively. Grading scale: A = elite • B = above average • C = average • D = below average • F = poor • — = no data |
||
| Speed | F | F |
| Early Pace | D | C |
| Mid Pace | C | C |
| Late Pace | F | D |
| Sprint FPS | D | C |
| Route FPS | D | D |
| Trainer Effectiveness | C | B |
| Jockey Effectiveness | D | C |
| 3rd Party Ratings | F | D |
| Predictions
AI-generated projections for the upcoming race, derived from prior AI analysis for speed and pace trends, surface and distance suitability, and current conditions. Grading scale: A = elite • B = above average • C = average • D = below average • F = poor • — = no data |
||
| Speed | F | F |
| Early Pace | F | D |
| Mid Pace | D | D |
| Late Pace | C | C |
A paid membership is required to view all stats. Subscribe now →
Chart Guide (2.0.03)
- Bubbles
- Color = surface: green (turf), brown (dirt), blue (synthetic)
- Number = finishing position
- Height above line = beaten lengths — closer means a smaller margin
- Border = track conditions: green (FST/GD/FM), yellow (WF/SL/YLD), red (SY/MY/FRZ/SFT/HVY)
- Connecting Line
- Solid = good conditions; dashed = bad conditions
- Line Symbol
- ▲ Triangle = sprint (7f or less); ● Circle = route (more than 7f)
- Bubble Size
- Color (brown-dirt, green-turf) and border (red-bad, green-good) convey surface and track conditions
- Shaded Band (Bollinger)
- Highlights volatility — a wider band means more variation in recent performance
- Performance Trend
- Straight line showing the overall performance direction — angled up = improving, angled down = declining
- Dashed Reference Line
- AI Opponent = AI analysis class-level par for the race
| Stat | vs. Current Card | vs. All Horses |
|---|---|---|
| Averages
Career-average metrics across all AI race analysis. Performance and pace averages reflect estimated historical performance; trainer and jockey grades score in-the-money percentages. Grading scale: A = elite • B = above average • C = average • D = below average • F = poor • — = no data |
||
| Pick Pony AI Rating | A | B |
| Speed | A | D |
| Early Pace | C | C |
| Mid Pace | A | C |
| Late Pace | A | B |
| Finish Pos | D | D |
| Dirt Speed | A | C |
| Turf Speed | C | D |
| Distance Speed | C | C |
| Trainer Effectiveness | A | A |
| Jockey Effectiveness | A | A |
| 3rd Party Ratings | B | C |
| Recent
Performance analysis from the horse's recent races, weighted to reflect current form. Sprint and Route FPS (Foot Per Second) measure pace efficiency over the horse's recent sprints and routes respectively. Grading scale: A = elite • B = above average • C = average • D = below average • F = poor • — = no data |
||
| Speed | C | D |
| Early Pace | F | C |
| Mid Pace | C | C |
| Late Pace | B | C |
| Sprint FPS | F | D |
| Route FPS | C | C |
| Trainer Effectiveness | A | A |
| Jockey Effectiveness | A | A |
| 3rd Party Ratings | B | C |
| Predictions
AI-generated projections for the upcoming race, derived from prior AI analysis for speed and pace trends, surface and distance suitability, and current conditions. Grading scale: A = elite • B = above average • C = average • D = below average • F = poor • — = no data |
||
| Speed | B | D |
| Early Pace | D | C |
| Mid Pace | C | C |
| Late Pace | C | C |
A paid membership is required to view all stats. Subscribe now →
Chart Guide (2.0.03)
- Bubbles
- Color = surface: green (turf), brown (dirt), blue (synthetic)
- Number = finishing position
- Height above line = beaten lengths — closer means a smaller margin
- Border = track conditions: green (FST/GD/FM), yellow (WF/SL/YLD), red (SY/MY/FRZ/SFT/HVY)
- Connecting Line
- Solid = good conditions; dashed = bad conditions
- Line Symbol
- ▲ Triangle = sprint (7f or less); ● Circle = route (more than 7f)
- Bubble Size
- Color (brown-dirt, green-turf) and border (red-bad, green-good) convey surface and track conditions
- Shaded Band (Bollinger)
- Highlights volatility — a wider band means more variation in recent performance
- Performance Trend
- Straight line showing the overall performance direction — angled up = improving, angled down = declining
- Dashed Reference Line
- AI Opponent = AI analysis class-level par for the race
| Stat | vs. Current Card | vs. All Horses |
|---|---|---|
| Averages
Career-average metrics across all AI race analysis. Performance and pace averages reflect estimated historical performance; trainer and jockey grades score in-the-money percentages. Grading scale: A = elite • B = above average • C = average • D = below average • F = poor • — = no data |
||
| Pick Pony AI Rating | D | C |
| Speed | B | B |
| Early Pace | F | C |
| Mid Pace | B | B |
| Late Pace | B | B |
| Finish Pos | F | D |
| Dirt Speed | A | A |
| Turf Speed | A | C |
| Distance Speed | A | A |
| Trainer Effectiveness | C | B |
| Jockey Effectiveness | F | D |
| 3rd Party Ratings | C | B |
| Recent
Performance analysis from the horse's recent races, weighted to reflect current form. Sprint and Route FPS (Foot Per Second) measure pace efficiency over the horse's recent sprints and routes respectively. Grading scale: A = elite • B = above average • C = average • D = below average • F = poor • — = no data |
||
| Speed | C | B |
| Early Pace | F | D |
| Mid Pace | F | B |
| Late Pace | F | C |
| Sprint FPS | F | C |
| Route FPS | C | A |
| Trainer Effectiveness | C | B |
| Jockey Effectiveness | F | D |
| 3rd Party Ratings | C | B |
| Predictions
AI-generated projections for the upcoming race, derived from prior AI analysis for speed and pace trends, surface and distance suitability, and current conditions. Grading scale: A = elite • B = above average • C = average • D = below average • F = poor • — = no data |
||
| Speed | A | B |
| Early Pace | F | D |
| Mid Pace | F | C |
| Late Pace | C | C |
A paid membership is required to view all stats. Subscribe now →
Chart Guide (2.0.03)
- Bubbles
- Color = surface: green (turf), brown (dirt), blue (synthetic)
- Number = finishing position
- Height above line = beaten lengths — closer means a smaller margin
- Border = track conditions: green (FST/GD/FM), yellow (WF/SL/YLD), red (SY/MY/FRZ/SFT/HVY)
- Connecting Line
- Solid = good conditions; dashed = bad conditions
- Line Symbol
- ▲ Triangle = sprint (7f or less); ● Circle = route (more than 7f)
- Bubble Size
- Color (brown-dirt, green-turf) and border (red-bad, green-good) convey surface and track conditions
- Shaded Band (Bollinger)
- Highlights volatility — a wider band means more variation in recent performance
- Performance Trend
- Straight line showing the overall performance direction — angled up = improving, angled down = declining
- Dashed Reference Line
- AI Opponent = AI analysis class-level par for the race
| Stat | vs. Current Card | vs. All Horses |
|---|---|---|
| Averages
Career-average metrics across all AI race analysis. Performance and pace averages reflect estimated historical performance; trainer and jockey grades score in-the-money percentages. Grading scale: A = elite • B = above average • C = average • D = below average • F = poor • — = no data |
||
| Pick Pony AI Rating | B | A |
| Speed | A | B |
| Early Pace | D | B |
| Mid Pace | A | A |
| Late Pace | A | A |
| Finish Pos | A | A |
| Dirt Speed | C | B |
| Turf Speed | C | D |
| Distance Speed | B | A |
| Trainer Effectiveness | A | A |
| Jockey Effectiveness | A | A |
| 3rd Party Ratings | B | A |
| Recent
Performance analysis from the horse's recent races, weighted to reflect current form. Sprint and Route FPS (Foot Per Second) measure pace efficiency over the horse's recent sprints and routes respectively. Grading scale: A = elite • B = above average • C = average • D = below average • F = poor • — = no data |
||
| Speed | B | B |
| Early Pace | D | B |
| Mid Pace | D | B |
| Late Pace | A | A |
| Sprint FPS | B | A |
| Route FPS | A | A |
| Trainer Effectiveness | A | A |
| Jockey Effectiveness | A | A |
| 3rd Party Ratings | B | A |
| Predictions
AI-generated projections for the upcoming race, derived from prior AI analysis for speed and pace trends, surface and distance suitability, and current conditions. Grading scale: A = elite • B = above average • C = average • D = below average • F = poor • — = no data |
||
| Speed | A | B |
| Early Pace | D | C |
| Mid Pace | D | C |
| Late Pace | C | C |
A paid membership is required to view all stats. Subscribe now →
Chart Guide (2.0.03)
- Bubbles
- Color = surface: green (turf), brown (dirt), blue (synthetic)
- Number = finishing position
- Height above line = beaten lengths — closer means a smaller margin
- Border = track conditions: green (FST/GD/FM), yellow (WF/SL/YLD), red (SY/MY/FRZ/SFT/HVY)
- Connecting Line
- Solid = good conditions; dashed = bad conditions
- Line Symbol
- ▲ Triangle = sprint (7f or less); ● Circle = route (more than 7f)
- Bubble Size
- Color (brown-dirt, green-turf) and border (red-bad, green-good) convey surface and track conditions
- Shaded Band (Bollinger)
- Highlights volatility — a wider band means more variation in recent performance
- Performance Trend
- Straight line showing the overall performance direction — angled up = improving, angled down = declining
- Dashed Reference Line
- AI Opponent = AI analysis class-level par for the race
| Stat | vs. Current Card | vs. All Horses |
|---|---|---|
| Averages
Career-average metrics across all AI race analysis. Performance and pace averages reflect estimated historical performance; trainer and jockey grades score in-the-money percentages. Grading scale: A = elite • B = above average • C = average • D = below average • F = poor • — = no data |
||
| Pick Pony AI Rating | A | A |
| Speed | A | B |
| Early Pace | B | A |
| Mid Pace | C | B |
| Late Pace | A | A |
| Finish Pos | A | A |
| Dirt Speed | B | B |
| Turf Speed | C | D |
| Distance Speed | A | A |
| Trainer Effectiveness | A | A |
| Jockey Effectiveness | D | C |
| 3rd Party Ratings | A | A |
| Recent
Performance analysis from the horse's recent races, weighted to reflect current form. Sprint and Route FPS (Foot Per Second) measure pace efficiency over the horse's recent sprints and routes respectively. Grading scale: A = elite • B = above average • C = average • D = below average • F = poor • — = no data |
||
| Speed | A | A |
| Early Pace | A | A |
| Mid Pace | A | A |
| Late Pace | A | A |
| Sprint FPS | A | A |
| Route FPS | B | A |
| Trainer Effectiveness | A | A |
| Jockey Effectiveness | D | C |
| 3rd Party Ratings | A | A |
| Predictions
AI-generated projections for the upcoming race, derived from prior AI analysis for speed and pace trends, surface and distance suitability, and current conditions. Grading scale: A = elite • B = above average • C = average • D = below average • F = poor • — = no data |
||
| Speed | F | C |
| Early Pace | B | B |
| Mid Pace | B | B |
| Late Pace | C | C |
A paid membership is required to view all stats. Subscribe now →
Chart Guide (2.0.03)
- Bubbles
- Color = surface: green (turf), brown (dirt), blue (synthetic)
- Number = finishing position
- Height above line = beaten lengths — closer means a smaller margin
- Border = track conditions: green (FST/GD/FM), yellow (WF/SL/YLD), red (SY/MY/FRZ/SFT/HVY)
- Connecting Line
- Solid = good conditions; dashed = bad conditions
- Line Symbol
- ▲ Triangle = sprint (7f or less); ● Circle = route (more than 7f)
- Bubble Size
- Color (brown-dirt, green-turf) and border (red-bad, green-good) convey surface and track conditions
- Shaded Band (Bollinger)
- Highlights volatility — a wider band means more variation in recent performance
- Performance Trend
- Straight line showing the overall performance direction — angled up = improving, angled down = declining
- Dashed Reference Line
- AI Opponent = AI analysis class-level par for the race
| Stat | vs. Current Card | vs. All Horses |
|---|---|---|
| Averages
Career-average metrics across all AI race analysis. Performance and pace averages reflect estimated historical performance; trainer and jockey grades score in-the-money percentages. Grading scale: A = elite • B = above average • C = average • D = below average • F = poor • — = no data |
||
| Pick Pony AI Rating | A | A |
| Speed | C | C |
| Early Pace | A | A |
| Mid Pace | D | B |
| Late Pace | C | B |
| Finish Pos | B | B |
| Dirt Speed | A | A |
| Turf Speed | C | D |
| Distance Speed | F | C |
| Trainer Effectiveness | F | B |
| Jockey Effectiveness | A | B |
| 3rd Party Ratings | A | A |
| Recent
Performance analysis from the horse's recent races, weighted to reflect current form. Sprint and Route FPS (Foot Per Second) measure pace efficiency over the horse's recent sprints and routes respectively. Grading scale: A = elite • B = above average • C = average • D = below average • F = poor • — = no data |
||
| Speed | A | A |
| Early Pace | A | A |
| Mid Pace | A | A |
| Late Pace | B | A |
| Sprint FPS | A | A |
| Route FPS | A | A |
| Trainer Effectiveness | F | B |
| Jockey Effectiveness | A | B |
| 3rd Party Ratings | A | A |
| Predictions
AI-generated projections for the upcoming race, derived from prior AI analysis for speed and pace trends, surface and distance suitability, and current conditions. Grading scale: A = elite • B = above average • C = average • D = below average • F = poor • — = no data |
||
| Speed | C | C |
| Early Pace | A | B |
| Mid Pace | A | B |
| Late Pace | C | C |
A paid membership is required to view all stats. Subscribe now →
Chart Guide (2.0.03)
- Bubbles
- Color = surface: green (turf), brown (dirt), blue (synthetic)
- Number = finishing position
- Height above line = beaten lengths — closer means a smaller margin
- Border = track conditions: green (FST/GD/FM), yellow (WF/SL/YLD), red (SY/MY/FRZ/SFT/HVY)
- Connecting Line
- Solid = good conditions; dashed = bad conditions
- Line Symbol
- ▲ Triangle = sprint (7f or less); ● Circle = route (more than 7f)
- Bubble Size
- Color (brown-dirt, green-turf) and border (red-bad, green-good) convey surface and track conditions
- Shaded Band (Bollinger)
- Highlights volatility — a wider band means more variation in recent performance
- Performance Trend
- Straight line showing the overall performance direction — angled up = improving, angled down = declining
- Dashed Reference Line
- AI Opponent = AI analysis class-level par for the race
| Stat | vs. Current Card | vs. All Horses |
|---|---|---|
| Averages
Career-average metrics across all AI race analysis. Performance and pace averages reflect estimated historical performance; trainer and jockey grades score in-the-money percentages. Grading scale: A = elite • B = above average • C = average • D = below average • F = poor • — = no data |
||
| Pick Pony AI Rating | C | C |
| Speed | D | C |
| Early Pace | A | A |
| Mid Pace | F | B |
| Late Pace | D | C |
| Finish Pos | C | C |
| Dirt Speed | D | B |
| Turf Speed | C | D |
| Distance Speed | C | B |
| Trainer Effectiveness | C | B |
| Jockey Effectiveness | B | B |
| 3rd Party Ratings | F | B |
| Recent
Performance analysis from the horse's recent races, weighted to reflect current form. Sprint and Route FPS (Foot Per Second) measure pace efficiency over the horse's recent sprints and routes respectively. Grading scale: A = elite • B = above average • C = average • D = below average • F = poor • — = no data |
||
| Speed | F | C |
| Early Pace | B | B |
| Mid Pace | C | A |
| Late Pace | D | C |
| Sprint FPS | C | B |
| Route FPS | F | B |
| Trainer Effectiveness | C | B |
| Jockey Effectiveness | B | B |
| 3rd Party Ratings | F | B |
| Predictions
AI-generated projections for the upcoming race, derived from prior AI analysis for speed and pace trends, surface and distance suitability, and current conditions. Grading scale: A = elite • B = above average • C = average • D = below average • F = poor • — = no data |
||
| Speed | B | C |
| Early Pace | A | A |
| Mid Pace | A | A |
| Late Pace | C | C |
A paid membership is required to view all stats. Subscribe now →
Chart Guide (2.0.03)
- Bubbles
- Color = surface: green (turf), brown (dirt), blue (synthetic)
- Number = finishing position
- Height above line = beaten lengths — closer means a smaller margin
- Border = track conditions: green (FST/GD/FM), yellow (WF/SL/YLD), red (SY/MY/FRZ/SFT/HVY)
- Connecting Line
- Solid = good conditions; dashed = bad conditions
- Line Symbol
- ▲ Triangle = sprint (7f or less); ● Circle = route (more than 7f)
- Bubble Size
- Color (brown-dirt, green-turf) and border (red-bad, green-good) convey surface and track conditions
- Shaded Band (Bollinger)
- Highlights volatility — a wider band means more variation in recent performance
- Performance Trend
- Straight line showing the overall performance direction — angled up = improving, angled down = declining
- Dashed Reference Line
- AI Opponent = AI analysis class-level par for the race
| Stat | vs. Current Card | vs. All Horses |
|---|---|---|
| Averages
Career-average metrics across all AI race analysis. Performance and pace averages reflect estimated historical performance; trainer and jockey grades score in-the-money percentages. Grading scale: A = elite • B = above average • C = average • D = below average • F = poor • — = no data |
||
| Pick Pony AI Rating | F | C |
| Speed | F | C |
| Early Pace | C | B |
| Mid Pace | A | A |
| Late Pace | F | C |
| Finish Pos | C | C |
| Dirt Speed | F | B |
| Turf Speed | C | D |
| Distance Speed | D | B |
| Trainer Effectiveness | C | B |
| Jockey Effectiveness | C | C |
| 3rd Party Ratings | D | B |
| Recent
Performance analysis from the horse's recent races, weighted to reflect current form. Sprint and Route FPS (Foot Per Second) measure pace efficiency over the horse's recent sprints and routes respectively. Grading scale: A = elite • B = above average • C = average • D = below average • F = poor • — = no data |
||
| Speed | D | C |
| Early Pace | C | B |
| Mid Pace | B | A |
| Late Pace | C | B |
| Sprint FPS | D | B |
| Route FPS | D | B |
| Trainer Effectiveness | C | B |
| Jockey Effectiveness | C | C |
| 3rd Party Ratings | D | B |
| Predictions
AI-generated projections for the upcoming race, derived from prior AI analysis for speed and pace trends, surface and distance suitability, and current conditions. Grading scale: A = elite • B = above average • C = average • D = below average • F = poor • — = no data |
||
| Speed | D | C |
| Early Pace | C | C |
| Mid Pace | C | B |
| Late Pace | C | C |
A paid membership is required to view all stats. Subscribe now →
Chart Guide (2.0.03)
- Bubbles
- Color = surface: green (turf), brown (dirt), blue (synthetic)
- Number = finishing position
- Height above line = beaten lengths — closer means a smaller margin
- Border = track conditions: green (FST/GD/FM), yellow (WF/SL/YLD), red (SY/MY/FRZ/SFT/HVY)
- Connecting Line
- Solid = good conditions; dashed = bad conditions
- Line Symbol
- ▲ Triangle = sprint (7f or less); ● Circle = route (more than 7f)
- Bubble Size
- Color (brown-dirt, green-turf) and border (red-bad, green-good) convey surface and track conditions
- Shaded Band (Bollinger)
- Highlights volatility — a wider band means more variation in recent performance
- Performance Trend
- Straight line showing the overall performance direction — angled up = improving, angled down = declining
- Dashed Reference Line
- AI Opponent = AI analysis class-level par for the race
| Stat | vs. Current Card | vs. All Horses |
|---|---|---|
| Averages
Career-average metrics across all AI race analysis. Performance and pace averages reflect estimated historical performance; trainer and jockey grades score in-the-money percentages. Grading scale: A = elite • B = above average • C = average • D = below average • F = poor • — = no data |
||
| Pick Pony AI Rating | A | A |
| Speed | A | B |
| Early Pace | A | B |
| Mid Pace | A | B |
| Late Pace | A | B |
| Finish Pos | A | B |
| Dirt Speed | A | B |
| Turf Speed | A | B |
| Distance Speed | A | B |
| Trainer Effectiveness | B | B |
| Jockey Effectiveness | C | C |
| 3rd Party Ratings | A | B |
| Recent
Performance analysis from the horse's recent races, weighted to reflect current form. Sprint and Route FPS (Foot Per Second) measure pace efficiency over the horse's recent sprints and routes respectively. Grading scale: A = elite • B = above average • C = average • D = below average • F = poor • — = no data |
||
| Speed | A | B |
| Early Pace | C | C |
| Mid Pace | A | B |
| Late Pace | A | B |
| Sprint FPS | D | B |
| Route FPS | C | B |
| Trainer Effectiveness | B | B |
| Jockey Effectiveness | C | C |
| 3rd Party Ratings | A | B |
| Predictions
AI-generated projections for the upcoming race, derived from prior AI analysis for speed and pace trends, surface and distance suitability, and current conditions. Grading scale: A = elite • B = above average • C = average • D = below average • F = poor • — = no data |
||
| Speed | B | B |
| Early Pace | C | C |
| Mid Pace | C | C |
| Late Pace | C | C |
A paid membership is required to view all stats. Subscribe now →
Chart Guide (2.0.03)
- Bubbles
- Color = surface: green (turf), brown (dirt), blue (synthetic)
- Number = finishing position
- Height above line = beaten lengths — closer means a smaller margin
- Border = track conditions: green (FST/GD/FM), yellow (WF/SL/YLD), red (SY/MY/FRZ/SFT/HVY)
- Connecting Line
- Solid = good conditions; dashed = bad conditions
- Line Symbol
- ▲ Triangle = sprint (7f or less); ● Circle = route (more than 7f)
- Bubble Size
- Color (brown-dirt, green-turf) and border (red-bad, green-good) convey surface and track conditions
- Shaded Band (Bollinger)
- Highlights volatility — a wider band means more variation in recent performance
- Performance Trend
- Straight line showing the overall performance direction — angled up = improving, angled down = declining
- Dashed Reference Line
- AI Opponent = AI analysis class-level par for the race
| Stat | vs. Current Card | vs. All Horses |
|---|---|---|
| Averages
Career-average metrics across all AI race analysis. Performance and pace averages reflect estimated historical performance; trainer and jockey grades score in-the-money percentages. Grading scale: A = elite • B = above average • C = average • D = below average • F = poor • — = no data |
||
| Pick Pony AI Rating | A | C |
| Speed | A | D |
| Early Pace | D | D |
| Mid Pace | C | D |
| Late Pace | B | D |
| Finish Pos | A | A |
| Dirt Speed | B | D |
| Turf Speed | C | D |
| Distance Speed | B | D |
| Trainer Effectiveness | A | A |
| Jockey Effectiveness | A | A |
| 3rd Party Ratings | A | D |
| Recent
Performance analysis from the horse's recent races, weighted to reflect current form. Sprint and Route FPS (Foot Per Second) measure pace efficiency over the horse's recent sprints and routes respectively. Grading scale: A = elite • B = above average • C = average • D = below average • F = poor • — = no data |
||
| Speed | A | D |
| Early Pace | D | D |
| Mid Pace | C | D |
| Late Pace | A | D |
| Sprint FPS | C | B |
| Route FPS | B | A |
| Trainer Effectiveness | A | A |
| Jockey Effectiveness | A | A |
| 3rd Party Ratings | A | D |
| Predictions
AI-generated projections for the upcoming race, derived from prior AI analysis for speed and pace trends, surface and distance suitability, and current conditions. Grading scale: A = elite • B = above average • C = average • D = below average • F = poor • — = no data |
||
| Speed | A | A |
| Early Pace | D | C |
| Mid Pace | A | C |
| Late Pace | C | C |
A paid membership is required to view all stats. Subscribe now →
Chart Guide (2.0.03)
- Bubbles
- Color = surface: green (turf), brown (dirt), blue (synthetic)
- Number = finishing position
- Height above line = beaten lengths — closer means a smaller margin
- Border = track conditions: green (FST/GD/FM), yellow (WF/SL/YLD), red (SY/MY/FRZ/SFT/HVY)
- Connecting Line
- Solid = good conditions; dashed = bad conditions
- Line Symbol
- ▲ Triangle = sprint (7f or less); ● Circle = route (more than 7f)
- Bubble Size
- Color (brown-dirt, green-turf) and border (red-bad, green-good) convey surface and track conditions
- Shaded Band (Bollinger)
- Highlights volatility — a wider band means more variation in recent performance
- Performance Trend
- Straight line showing the overall performance direction — angled up = improving, angled down = declining
- Dashed Reference Line
- AI Opponent = AI analysis class-level par for the race
| Stat | vs. Current Card | vs. All Horses |
|---|---|---|
| Averages
Career-average metrics across all AI race analysis. Performance and pace averages reflect estimated historical performance; trainer and jockey grades score in-the-money percentages. Grading scale: A = elite • B = above average • C = average • D = below average • F = poor • — = no data |
||
| Pick Pony AI Rating | A | B |
| Speed | A | D |
| Early Pace | A | C |
| Mid Pace | A | C |
| Late Pace | A | C |
| Finish Pos | B | C |
| Dirt Speed | A | C |
| Turf Speed | C | D |
| Distance Speed | A | B |
| Trainer Effectiveness | C | D |
| Jockey Effectiveness | A | B |
| 3rd Party Ratings | A | C |
| Recent
Performance analysis from the horse's recent races, weighted to reflect current form. Sprint and Route FPS (Foot Per Second) measure pace efficiency over the horse's recent sprints and routes respectively. Grading scale: A = elite • B = above average • C = average • D = below average • F = poor • — = no data |
||
| Speed | A | D |
| Early Pace | A | B |
| Mid Pace | A | B |
| Late Pace | A | C |
| Sprint FPS | C | A |
| Route FPS | D | B |
| Trainer Effectiveness | C | D |
| Jockey Effectiveness | A | B |
| 3rd Party Ratings | A | C |
| Predictions
AI-generated projections for the upcoming race, derived from prior AI analysis for speed and pace trends, surface and distance suitability, and current conditions. Grading scale: A = elite • B = above average • C = average • D = below average • F = poor • — = no data |
||
| Speed | C | D |
| Early Pace | B | B |
| Mid Pace | A | C |
| Late Pace | C | C |
A paid membership is required to view all stats. Subscribe now →
Chart Guide (2.0.03)
- Bubbles
- Color = surface: green (turf), brown (dirt), blue (synthetic)
- Number = finishing position
- Height above line = beaten lengths — closer means a smaller margin
- Border = track conditions: green (FST/GD/FM), yellow (WF/SL/YLD), red (SY/MY/FRZ/SFT/HVY)
- Connecting Line
- Solid = good conditions; dashed = bad conditions
- Line Symbol
- ▲ Triangle = sprint (7f or less); ● Circle = route (more than 7f)
- Bubble Size
- Color (brown-dirt, green-turf) and border (red-bad, green-good) convey surface and track conditions
- Shaded Band (Bollinger)
- Highlights volatility — a wider band means more variation in recent performance
- Performance Trend
- Straight line showing the overall performance direction — angled up = improving, angled down = declining
- Dashed Reference Line
- AI Opponent = AI analysis class-level par for the race
| Stat | vs. Current Card | vs. All Horses |
|---|---|---|
| Averages
Career-average metrics across all AI race analysis. Performance and pace averages reflect estimated historical performance; trainer and jockey grades score in-the-money percentages. Grading scale: A = elite • B = above average • C = average • D = below average • F = poor • — = no data |
||
| Pick Pony AI Rating | B | C |
| Speed | B | F |
| Early Pace | B | D |
| Mid Pace | B | D |
| Late Pace | C | F |
| Finish Pos | C | D |
| Dirt Speed | A | D |
| Turf Speed | C | D |
| Distance Speed | C | D |
| Trainer Effectiveness | F | F |
| Jockey Effectiveness | A | A |
| 3rd Party Ratings | B | D |
| Recent
Performance analysis from the horse's recent races, weighted to reflect current form. Sprint and Route FPS (Foot Per Second) measure pace efficiency over the horse's recent sprints and routes respectively. Grading scale: A = elite • B = above average • C = average • D = below average • F = poor • — = no data |
||
| Speed | B | F |
| Early Pace | A | A |
| Mid Pace | A | B |
| Late Pace | C | D |
| Sprint FPS | A | A |
| Route FPS | B | A |
| Trainer Effectiveness | F | F |
| Jockey Effectiveness | A | A |
| 3rd Party Ratings | B | D |
| Predictions
AI-generated projections for the upcoming race, derived from prior AI analysis for speed and pace trends, surface and distance suitability, and current conditions. Grading scale: A = elite • B = above average • C = average • D = below average • F = poor • — = no data |
||
| Speed | D | F |
| Early Pace | A | A |
| Mid Pace | A | B |
| Late Pace | C | C |
A paid membership is required to view all stats. Subscribe now →
Chart Guide (2.0.03)
- Bubbles
- Color = surface: green (turf), brown (dirt), blue (synthetic)
- Number = finishing position
- Height above line = beaten lengths — closer means a smaller margin
- Border = track conditions: green (FST/GD/FM), yellow (WF/SL/YLD), red (SY/MY/FRZ/SFT/HVY)
- Connecting Line
- Solid = good conditions; dashed = bad conditions
- Line Symbol
- ▲ Triangle = sprint (7f or less); ● Circle = route (more than 7f)
- Bubble Size
- Color (brown-dirt, green-turf) and border (red-bad, green-good) convey surface and track conditions
- Shaded Band (Bollinger)
- Highlights volatility — a wider band means more variation in recent performance
- Performance Trend
- Straight line showing the overall performance direction — angled up = improving, angled down = declining
- Dashed Reference Line
- AI Opponent = AI analysis class-level par for the race
| Stat | vs. Current Card | vs. All Horses |
|---|---|---|
| Averages
Career-average metrics across all AI race analysis. Performance and pace averages reflect estimated historical performance; trainer and jockey grades score in-the-money percentages. Grading scale: A = elite • B = above average • C = average • D = below average • F = poor • — = no data |
||
| Pick Pony AI Rating | F | F |
| Speed | B | F |
| Early Pace | A | C |
| Mid Pace | A | C |
| Late Pace | A | C |
| Finish Pos | B | D |
| Dirt Speed | B | D |
| Turf Speed | C | D |
| Distance Speed | A | D |
| Trainer Effectiveness | F | F |
| Jockey Effectiveness | C | D |
| 3rd Party Ratings | D | F |
| Recent
Performance analysis from the horse's recent races, weighted to reflect current form. Sprint and Route FPS (Foot Per Second) measure pace efficiency over the horse's recent sprints and routes respectively. Grading scale: A = elite • B = above average • C = average • D = below average • F = poor • — = no data |
||
| Speed | C | F |
| Early Pace | C | D |
| Mid Pace | B | D |
| Late Pace | B | D |
| Sprint FPS | A | A |
| Route FPS | A | A |
| Trainer Effectiveness | F | F |
| Jockey Effectiveness | C | D |
| 3rd Party Ratings | D | F |
| Predictions
AI-generated projections for the upcoming race, derived from prior AI analysis for speed and pace trends, surface and distance suitability, and current conditions. Grading scale: A = elite • B = above average • C = average • D = below average • F = poor • — = no data |
||
| Speed | C | F |
| Early Pace | F | D |
| Mid Pace | D | D |
| Late Pace | C | C |
A paid membership is required to view all stats. Subscribe now →
Chart Guide (2.0.03)
- Bubbles
- Color = surface: green (turf), brown (dirt), blue (synthetic)
- Number = finishing position
- Height above line = beaten lengths — closer means a smaller margin
- Border = track conditions: green (FST/GD/FM), yellow (WF/SL/YLD), red (SY/MY/FRZ/SFT/HVY)
- Connecting Line
- Solid = good conditions; dashed = bad conditions
- Line Symbol
- ▲ Triangle = sprint (7f or less); ● Circle = route (more than 7f)
- Bubble Size
- Color (brown-dirt, green-turf) and border (red-bad, green-good) convey surface and track conditions
- Shaded Band (Bollinger)
- Highlights volatility — a wider band means more variation in recent performance
- Performance Trend
- Straight line showing the overall performance direction — angled up = improving, angled down = declining
- Dashed Reference Line
- AI Opponent = AI analysis class-level par for the race
| Stat | vs. Current Card | vs. All Horses |
|---|---|---|
| Averages
Career-average metrics across all AI race analysis. Performance and pace averages reflect estimated historical performance; trainer and jockey grades score in-the-money percentages. Grading scale: A = elite • B = above average • C = average • D = below average • F = poor • — = no data |
||
| Pick Pony AI Rating | C | D |
| Speed | F | F |
| Early Pace | C | D |
| Mid Pace | C | D |
| Late Pace | C | F |
| Finish Pos | D | F |
| Dirt Speed | C | D |
| Turf Speed | C | D |
| Distance Speed | D | D |
| Trainer Effectiveness | C | C |
| Jockey Effectiveness | B | C |
| 3rd Party Ratings | C | F |
| Recent
Performance analysis from the horse's recent races, weighted to reflect current form. Sprint and Route FPS (Foot Per Second) measure pace efficiency over the horse's recent sprints and routes respectively. Grading scale: A = elite • B = above average • C = average • D = below average • F = poor • — = no data |
||
| Speed | F | F |
| Early Pace | A | A |
| Mid Pace | B | C |
| Late Pace | D | F |
| Sprint FPS | C | B |
| Route FPS | C | B |
| Trainer Effectiveness | C | C |
| Jockey Effectiveness | B | C |
| 3rd Party Ratings | C | F |
| Predictions
AI-generated projections for the upcoming race, derived from prior AI analysis for speed and pace trends, surface and distance suitability, and current conditions. Grading scale: A = elite • B = above average • C = average • D = below average • F = poor • — = no data |
||
| Speed | F | F |
| Early Pace | A | A |
| Mid Pace | C | C |
| Late Pace | C | C |
A paid membership is required to view all stats. Subscribe now →
Chart Guide (2.0.03)
- Bubbles
- Color = surface: green (turf), brown (dirt), blue (synthetic)
- Number = finishing position
- Height above line = beaten lengths — closer means a smaller margin
- Border = track conditions: green (FST/GD/FM), yellow (WF/SL/YLD), red (SY/MY/FRZ/SFT/HVY)
- Connecting Line
- Solid = good conditions; dashed = bad conditions
- Line Symbol
- ▲ Triangle = sprint (7f or less); ● Circle = route (more than 7f)
- Bubble Size
- Color (brown-dirt, green-turf) and border (red-bad, green-good) convey surface and track conditions
- Shaded Band (Bollinger)
- Highlights volatility — a wider band means more variation in recent performance
- Performance Trend
- Straight line showing the overall performance direction — angled up = improving, angled down = declining
- Dashed Reference Line
- AI Opponent = AI analysis class-level par for the race
| Stat | vs. Current Card | vs. All Horses |
|---|---|---|
| Averages
Career-average metrics across all AI race analysis. Performance and pace averages reflect estimated historical performance; trainer and jockey grades score in-the-money percentages. Grading scale: A = elite • B = above average • C = average • D = below average • F = poor • — = no data |
||
| Pick Pony AI Rating | D | F |
| Speed | C | F |
| Early Pace | D | D |
| Mid Pace | F | F |
| Late Pace | C | F |
| Finish Pos | C | F |
| Dirt Speed | C | D |
| Turf Speed | C | D |
| Distance Speed | F | F |
| Trainer Effectiveness | A | A |
| Jockey Effectiveness | D | F |
| 3rd Party Ratings | B | F |
| Recent
Performance analysis from the horse's recent races, weighted to reflect current form. Sprint and Route FPS (Foot Per Second) measure pace efficiency over the horse's recent sprints and routes respectively. Grading scale: A = elite • B = above average • C = average • D = below average • F = poor • — = no data |
||
| Speed | C | F |
| Early Pace | D | D |
| Mid Pace | F | F |
| Late Pace | C | F |
| Sprint FPS | D | D |
| Route FPS | F | F |
| Trainer Effectiveness | A | A |
| Jockey Effectiveness | D | F |
| 3rd Party Ratings | B | F |
| Predictions
AI-generated projections for the upcoming race, derived from prior AI analysis for speed and pace trends, surface and distance suitability, and current conditions. Grading scale: A = elite • B = above average • C = average • D = below average • F = poor • — = no data |
||
| Speed | A | A |
| Early Pace | B | B |
| Mid Pace | F | F |
| Late Pace | C | C |
A paid membership is required to view all stats. Subscribe now →
Chart Guide (2.0.03)
- Bubbles
- Color = surface: green (turf), brown (dirt), blue (synthetic)
- Number = finishing position
- Height above line = beaten lengths — closer means a smaller margin
- Border = track conditions: green (FST/GD/FM), yellow (WF/SL/YLD), red (SY/MY/FRZ/SFT/HVY)
- Connecting Line
- Solid = good conditions; dashed = bad conditions
- Line Symbol
- ▲ Triangle = sprint (7f or less); ● Circle = route (more than 7f)
- Bubble Size
- Color (brown-dirt, green-turf) and border (red-bad, green-good) convey surface and track conditions
- Shaded Band (Bollinger)
- Highlights volatility — a wider band means more variation in recent performance
- Performance Trend
- Straight line showing the overall performance direction — angled up = improving, angled down = declining
- Dashed Reference Line
- AI Opponent = AI analysis class-level par for the race
| Stat | vs. Current Card | vs. All Horses |
|---|---|---|
| Averages
Career-average metrics across all AI race analysis. Performance and pace averages reflect estimated historical performance; trainer and jockey grades score in-the-money percentages. Grading scale: A = elite • B = above average • C = average • D = below average • F = poor • — = no data |
||
| Pick Pony AI Rating | C | D |
| Speed | C | F |
| Early Pace | C | D |
| Mid Pace | C | D |
| Late Pace | D | F |
| Finish Pos | F | F |
| Dirt Speed | D | D |
| Turf Speed | C | D |
| Distance Speed | C | D |
| Trainer Effectiveness | D | D |
| Jockey Effectiveness | D | D |
| 3rd Party Ratings | C | F |
| Recent
Performance analysis from the horse's recent races, weighted to reflect current form. Sprint and Route FPS (Foot Per Second) measure pace efficiency over the horse's recent sprints and routes respectively. Grading scale: A = elite • B = above average • C = average • D = below average • F = poor • — = no data |
||
| Speed | C | F |
| Early Pace | C | D |
| Mid Pace | C | D |
| Late Pace | D | F |
| Sprint FPS | B | A |
| Route FPS | A | A |
| Trainer Effectiveness | D | D |
| Jockey Effectiveness | D | D |
| 3rd Party Ratings | C | F |
| Predictions
AI-generated projections for the upcoming race, derived from prior AI analysis for speed and pace trends, surface and distance suitability, and current conditions. Grading scale: A = elite • B = above average • C = average • D = below average • F = poor • — = no data |
||
| Speed | A | A |
| Early Pace | A | A |
| Mid Pace | B | C |
| Late Pace | C | C |
A paid membership is required to view all stats. Subscribe now →
Chart Guide (2.0.03)
- Bubbles
- Color = surface: green (turf), brown (dirt), blue (synthetic)
- Number = finishing position
- Height above line = beaten lengths — closer means a smaller margin
- Border = track conditions: green (FST/GD/FM), yellow (WF/SL/YLD), red (SY/MY/FRZ/SFT/HVY)
- Connecting Line
- Solid = good conditions; dashed = bad conditions
- Line Symbol
- ▲ Triangle = sprint (7f or less); ● Circle = route (more than 7f)
- Bubble Size
- Color (brown-dirt, green-turf) and border (red-bad, green-good) convey surface and track conditions
- Shaded Band (Bollinger)
- Highlights volatility — a wider band means more variation in recent performance
- Performance Trend
- Straight line showing the overall performance direction — angled up = improving, angled down = declining
- Dashed Reference Line
- AI Opponent = AI analysis class-level par for the race
| Stat | vs. Current Card | vs. All Horses |
|---|---|---|
| Averages
Career-average metrics across all AI race analysis. Performance and pace averages reflect estimated historical performance; trainer and jockey grades score in-the-money percentages. Grading scale: A = elite • B = above average • C = average • D = below average • F = poor • — = no data |
||
| Pick Pony AI Rating | F | F |
| Speed | D | F |
| Early Pace | F | F |
| Mid Pace | D | D |
| Late Pace | F | F |
| Finish Pos | F | F |
| Dirt Speed | D | D |
| Turf Speed | C | D |
| Distance Speed | B | D |
| Trainer Effectiveness | B | A |
| Jockey Effectiveness | F | F |
| 3rd Party Ratings | D | F |
| Recent
Performance analysis from the horse's recent races, weighted to reflect current form. Sprint and Route FPS (Foot Per Second) measure pace efficiency over the horse's recent sprints and routes respectively. Grading scale: A = elite • B = above average • C = average • D = below average • F = poor • — = no data |
||
| Speed | D | F |
| Early Pace | F | D |
| Mid Pace | D | D |
| Late Pace | F | F |
| Sprint FPS | F | D |
| Route FPS | D | D |
| Trainer Effectiveness | B | A |
| Jockey Effectiveness | F | F |
| 3rd Party Ratings | D | F |
| Predictions
AI-generated projections for the upcoming race, derived from prior AI analysis for speed and pace trends, surface and distance suitability, and current conditions. Grading scale: A = elite • B = above average • C = average • D = below average • F = poor • — = no data |
||
| Speed | B | D |
| Early Pace | C | C |
| Mid Pace | C | C |
| Late Pace | C | C |
A paid membership is required to view all stats. Subscribe now →
Chart Guide (2.0.03)
- Bubbles
- Color = surface: green (turf), brown (dirt), blue (synthetic)
- Number = finishing position
- Height above line = beaten lengths — closer means a smaller margin
- Border = track conditions: green (FST/GD/FM), yellow (WF/SL/YLD), red (SY/MY/FRZ/SFT/HVY)
- Connecting Line
- Solid = good conditions; dashed = bad conditions
- Line Symbol
- ▲ Triangle = sprint (7f or less); ● Circle = route (more than 7f)
- Bubble Size
- Color (brown-dirt, green-turf) and border (red-bad, green-good) convey surface and track conditions
- Shaded Band (Bollinger)
- Highlights volatility — a wider band means more variation in recent performance
- Performance Trend
- Straight line showing the overall performance direction — angled up = improving, angled down = declining
- Dashed Reference Line
- AI Opponent = AI analysis class-level par for the race
| Stat | vs. Current Card | vs. All Horses |
|---|---|---|
| Averages
Career-average metrics across all AI race analysis. Performance and pace averages reflect estimated historical performance; trainer and jockey grades score in-the-money percentages. Grading scale: A = elite • B = above average • C = average • D = below average • F = poor • — = no data |
||
| Pick Pony AI Rating | B | C |
| Speed | D | F |
| Early Pace | B | C |
| Mid Pace | B | D |
| Late Pace | D | F |
| Finish Pos | D | F |
| Dirt Speed | C | D |
| Turf Speed | C | D |
| Distance Speed | D | D |
| Trainer Effectiveness | D | D |
| Jockey Effectiveness | C | D |
| 3rd Party Ratings | F | F |
| Recent
Performance analysis from the horse's recent races, weighted to reflect current form. Sprint and Route FPS (Foot Per Second) measure pace efficiency over the horse's recent sprints and routes respectively. Grading scale: A = elite • B = above average • C = average • D = below average • F = poor • — = no data |
||
| Speed | D | F |
| Early Pace | B | B |
| Mid Pace | D | D |
| Late Pace | B | D |
| Sprint FPS | A | A |
| Route FPS | A | A |
| Trainer Effectiveness | D | D |
| Jockey Effectiveness | C | D |
| 3rd Party Ratings | F | F |
| Predictions
AI-generated projections for the upcoming race, derived from prior AI analysis for speed and pace trends, surface and distance suitability, and current conditions. Grading scale: A = elite • B = above average • C = average • D = below average • F = poor • — = no data |
||
| Speed | D | F |
| Early Pace | D | C |
| Mid Pace | D | D |
| Late Pace | C | C |
A paid membership is required to view all stats. Subscribe now →
Chart Guide (2.0.03)
- Bubbles
- Color = surface: green (turf), brown (dirt), blue (synthetic)
- Number = finishing position
- Height above line = beaten lengths — closer means a smaller margin
- Border = track conditions: green (FST/GD/FM), yellow (WF/SL/YLD), red (SY/MY/FRZ/SFT/HVY)
- Connecting Line
- Solid = good conditions; dashed = bad conditions
- Line Symbol
- ▲ Triangle = sprint (7f or less); ● Circle = route (more than 7f)
- Bubble Size
- Color (brown-dirt, green-turf) and border (red-bad, green-good) convey surface and track conditions
- Shaded Band (Bollinger)
- Highlights volatility — a wider band means more variation in recent performance
- Performance Trend
- Straight line showing the overall performance direction — angled up = improving, angled down = declining
- Dashed Reference Line
- AI Opponent = AI analysis class-level par for the race
| Stat | vs. Current Card | vs. All Horses |
|---|---|---|
| Averages
Career-average metrics across all AI race analysis. Performance and pace averages reflect estimated historical performance; trainer and jockey grades score in-the-money percentages. Grading scale: A = elite • B = above average • C = average • D = below average • F = poor • — = no data |
||
| Pick Pony AI Rating | D | F |
| Speed | C | F |
| Early Pace | C | D |
| Mid Pace | D | D |
| Late Pace | B | F |
| Finish Pos | D | F |
| Dirt Speed | F | D |
| Turf Speed | A | C |
| Distance Speed | C | D |
| Trainer Effectiveness | C | C |
| Jockey Effectiveness | B | B |
| 3rd Party Ratings | C | F |
| Recent
Performance analysis from the horse's recent races, weighted to reflect current form. Sprint and Route FPS (Foot Per Second) measure pace efficiency over the horse's recent sprints and routes respectively. Grading scale: A = elite • B = above average • C = average • D = below average • F = poor • — = no data |
||
| Speed | B | F |
| Early Pace | B | C |
| Mid Pace | C | D |
| Late Pace | C | F |
| Sprint FPS | B | A |
| Route FPS | C | B |
| Trainer Effectiveness | C | C |
| Jockey Effectiveness | B | B |
| 3rd Party Ratings | C | F |
| Predictions
AI-generated projections for the upcoming race, derived from prior AI analysis for speed and pace trends, surface and distance suitability, and current conditions. Grading scale: A = elite • B = above average • C = average • D = below average • F = poor • — = no data |
||
| Speed | C | F |
| Early Pace | C | C |
| Mid Pace | B | C |
| Late Pace | C | C |
A paid membership is required to view all stats. Subscribe now →
| Stat | vs. Current Card | vs. All Horses |
|---|---|---|
| Averages
Career-average metrics across all AI race analysis. Performance and pace averages reflect estimated historical performance; trainer and jockey grades score in-the-money percentages. Grading scale: A = elite • B = above average • C = average • D = below average • F = poor • — = no data |
||
| Pick Pony AI Rating | C | F |
| Speed | F | F |
| Early Pace | F | F |
| Mid Pace | F | F |
| Late Pace | F | F |
| Finish Pos | A | A |
| Dirt Speed | F | F |
| Turf Speed | C | D |
| Distance Speed | F | F |
| Trainer Effectiveness | A | A |
| Jockey Effectiveness | F | F |
| 3rd Party Ratings | F | F |
| Recent
Performance analysis from the horse's recent races, weighted to reflect current form. Sprint and Route FPS (Foot Per Second) measure pace efficiency over the horse's recent sprints and routes respectively. Grading scale: A = elite • B = above average • C = average • D = below average • F = poor • — = no data |
||
| Speed | F | F |
| Early Pace | F | F |
| Mid Pace | F | F |
| Late Pace | F | F |
| Sprint FPS | F | F |
| Route FPS | F | F |
| Trainer Effectiveness | A | A |
| Jockey Effectiveness | F | F |
| 3rd Party Ratings | F | F |
| Predictions
AI-generated projections for the upcoming race, derived from prior AI analysis for speed and pace trends, surface and distance suitability, and current conditions. Grading scale: A = elite • B = above average • C = average • D = below average • F = poor • — = no data |
||
| Speed | F | F |
| Early Pace | F | F |
| Mid Pace | F | F |
| Late Pace | C | C |
A paid membership is required to view all stats. Subscribe now →
TL;DR
Toggle
Get more in-depth analysis, expert picks, handicapper reports, AI picks, handicapping tools, in-article data tooltips, NO ADVERTISEMENTS, and other membership perks with a Pick Pony subscription!
The Pick Pony Handicapper's Report is published daily and provides analysis of all races on the card. A Pick Pony analyst prepares the report, so selections may differ from the Pick Pony Expert Picks, which are based on the consensus of all Pick Pony analysts.
Don’t forget Pick Pony’s Expert Picks, AI Picks, and Past Performance Sheets/Racing Forms!
Will Rogers Downs runs a nine-race dirt card today with a mix of low-level maiden claimers, restricted Oklahoma-bred claiming events, and a solid Oklahoma-bred allowance feature at six furlongs. The card is built around sprint distances from five to six furlongs, plus a one-mile starter allowance that will test stamina and pace dynamics differently than the rest of the program.
The claiming and starter conditions indicate largely established local stock with familiar connections, which tends to make trip and bias handling especially important. The Oklahoma-bred restrictions in races 4, 7, 8, and 9 concentrate state-bred barns and often produce strong inside speed types that can control fractions when the track is playing fair.
Weather and Track Conditions
Weather data from the Oklahoma City area, which is a reasonable proxy for Will Rogers Downs in Claremore, shows dry conditions, cold temperatures around the upper 20s to low 30s Fahrenheit late in the day, light southerly winds, and no reported precipitation around March 17. Cloud cover trends as partly cloudy with good visibility, so there is no clear indication of moisture or significant wind that would alter normal track dynamics.
Given the lack of reported rain and the typical maintenance profile at Will Rogers Downs, the working assumption is a fast main track with standard moisture content. Without active precipitation or extreme wind, the surface should play true to its usual sprint profile, with early speed holding well if the rail is not excessively wet or cuppy.
Track Bias and Post Position Profile
Public bias databases for Will Rogers Downs are limited, but the track is generally known as a conventional Midwestern dirt surface where inside speed is often rewarded in sprints when the track is fast. Broader dirt-track trends at similar circuits indicate that from five to six furlongs, forward position and inside to middle posts tend to perform best when the surface is dry and maintained evenly.
However, there is no specific, up-to-date quantitative bias report for today indicating a pronounced rail or off-rail preference, so the default expectation is a fair surface with a mild tilt toward horses who can secure good early position from posts one through five. In the absence of clear evidence to the contrary, it is prudent to value tactical speed, but not to over-commit to a rail bias angle.
Race 1 – Maiden Claiming – 6 Furlongs Dirt – Purse $11,000
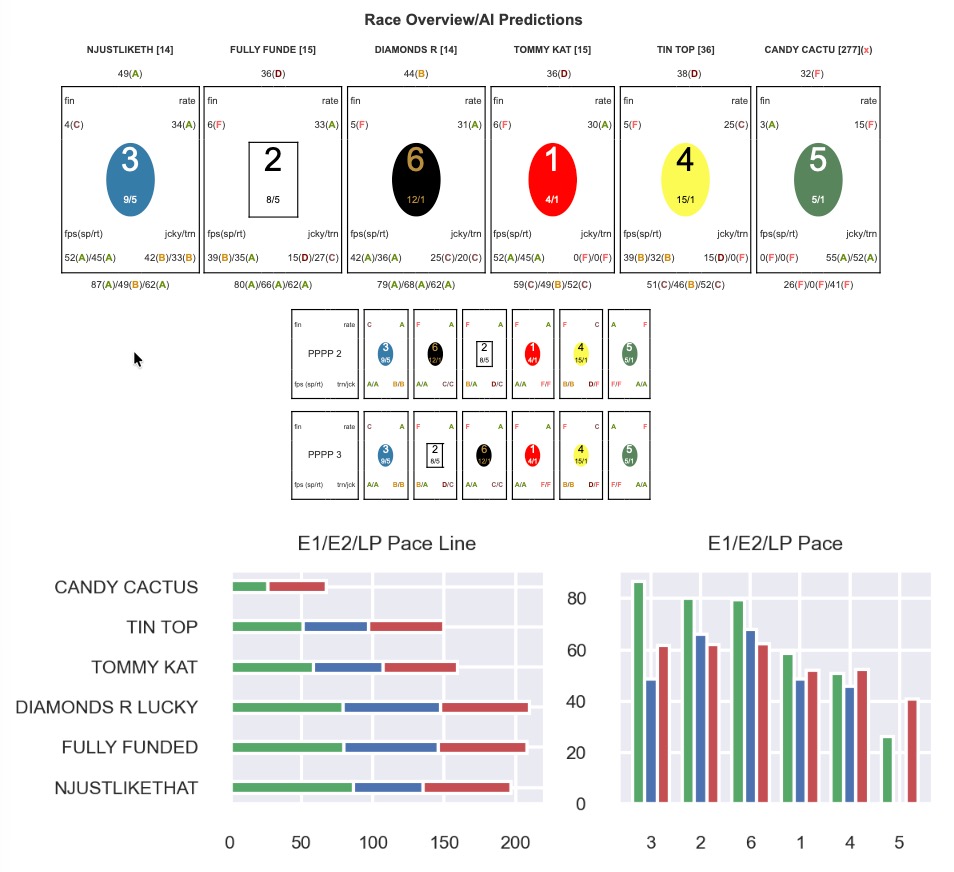
Field: Tommy Kat (1), Fully Funded (2), Njustlikethat (3), Tin Top (4), Candy Cactus (5), Diamonds R Lucky (6).
Post Time
Scheduled post is 1:15 PM local time, opening the card with a compact six-horse maiden claiming sprint.
Pace Analysis
This is a small field of maidens with a mix of lightly raced 3-year-olds and older geldings, and the race lacks proven, relentless front-line speed. Tin Top (4) and Njustlikethat (3) project as the most likely pace-pressers, with Candy Cactus (5) capable of sitting just off them. Fully Funded (2) and Diamonds R Lucky (6) appear more mid-pack or grinding types, while Tommy Kat (1) from the rail will need to show at least some early foot to avoid getting shuffled back.
With only six runners, the early fractions should be moderate rather than blazing, which tends to favor horses that can stay within two to three lengths of the lead at the half mile. Any horse that breaks sharply and clears or sits comfortably outside the leader will hold a tactical advantage.
Key Contenders
Njustlikethat (3) shows a strong profile for this level given the rider-trainer combination and the likely tactical trip just off or on the pace. The jockey booking with Richard Eramia, a reliable, aggressive rider at this level, suggests intent to be forwardly placed and minimize traffic. From post 3, Njustlikethat (3) should have options to either press the inside pace or sit in the clear outside Tin Top (4).
Candy Cactus (5) brings a solid rider change with Leandro Goncalves for trainer J. Alan Williams and figures as a logical contender in a field of modest depth. The outside-middle draw at post 5 should allow Candy Cactus (5) to stalk comfortably behind the early duel and produce a steady run turning for home. Given the 3-year-old profile and typical improvement curve this time of year, Candy Cactus (5) has upside.
Secondary Choices
Tin Top (4) for trainer Shon M. Dunlap, with Cassidy Fletcher aboard, shapes as one of the early pace keys and a plausible win candidate if able to shake free through the opening quarter. The post 4 draw is fine, and if Tin Top (4) is fit and not pressured hard, the gelding could get brave up front.
Fully Funded (2), a 5-year-old gelding from the Dunlap barn with jockey Curtis Kimes, is the more seasoned type dropping into a realistic spot. While not as likely to flash big early speed, Fully Funded (2) can grind into contention late and pick up pieces if the younger runners flatten in the lane.
Longshots
Tommy Kat (1) draws the rail for trainer April Gustafson with Erik McNeil aboard and looks like a longshot whose best chance is a ground-saving trip behind the leaders. If the rail is playing well and Tommy Kat (1) breaks sharply, he could upgrade into an exotics slot.
Diamonds R Lucky (6), a 6-year-old for Steve H. Davis with Emanuel Castillo Zabala riding, appears as the least likely winner on paper but still must be respected in a shallow field. The outside draw can be helpful if Diamonds R Lucky (6) improves second-off a layoff or catches a hot pace.
Betting Strategy
Win wagers can focus on Njustlikethat (3) and Candy Cactus (5) depending on price, leaning toward Njustlikethat (3) if they are close in odds. Exotics can key Njustlikethat (3) and Candy Cactus (5) over Tin Top (4) and Fully Funded (2), with Tommy Kat (1) and Diamonds R Lucky (6) used sparingly underneath.
Selections
Win Njustlikethat (3)
Place Candy Cactus (5)
Show Tin Top (4)
Race 2 – Claiming – 5 1/2 Furlongs Dirt – Purse $12,000
Field: Mirage Code (1), Presleys Volley (2), Palmilla's Bet (3), Misses Millie (4), Girls Knicks Now (5), Belle Blaze (6), Daretocatchlove (7).
Post Time
Scheduled post is 1:42 PM for this non-winners-of-two lifetime claiming sprint for fillies and mares.
Pace Analysis
Girls Knicks Now (5) and Presleys Volley (2) profile as likely pace players in this group, with Misses Millie (4) and Mirage Code (1) capable of sitting just off them. Daretocatchlove (7) and Palmilla's Bet (3) may track in mid-pack, while Belle Blaze (6) looks more like a late-running type.
Given the 5 1/2-furlong distance, early speed is at a premium, but a contested duel between Girls Knicks Now (5) and Presleys Volley (2) could open the door for a stalker. Inside draws will help Mirage Code (1) and Presleys Volley (2) secure position into the turn.
Key Contenders
Girls Knicks Now (5), a 3-year-old filly with Belen Quinonez aboard for Scott E. Young, is a logical key given the age advantage and likely early speed profile. At this condition, a forward trip from post 5 can put Girls Knicks Now (5) in a winning position if she breaks cleanly.
Palmilla's Bet (3) with David Cabrera riding for Boyd Caster stands out as a strong stalker-closer type that could capitalize if the pace heats up. Cabrera typically times moves well at this level, and from post 3, Palmilla's Bet (3) should secure a comfortable spot behind the leaders before launching at the head of the lane.
Secondary Choices
Presleys Volley (2), ridden by Cassidy Fletcher for George Blatchford, figures as a pace-pressing secondary win option. If Presleys Volley (2) can outrun Girls Knicks Now (5) early, she could prove tough to reel in.
Mirage Code (1) offers rail position with Ezequiel Lara riding for John T. Brown and can save ground stalking the leaders. With a clean inside trip, Mirage Code (1) has every chance to factor in the exacta or trifecta.
Longshots
Misses Millie (4), a 3-year-old filly with Alberto Pusac for Tyanna Lechtenberg, is lightly raced and could take a step forward in just her second lifetime win attempt. She is usable at a price in vertical exotics.
Belle Blaze (6), under 5-pound apprentice Ronnie Huckaby for Juan Padilla, and Daretocatchlove (7), with Emanuel Castillo Zabala for Jesus Munoz Escobedo, both have profiles more suited to clunking up late than winning. They can be included underneath in trifectas if the pace collapses.
Betting Strategy
Win bets should lean toward Girls Knicks Now (5) as the speed that may control the race, with a saver on Palmilla's Bet (3) if odds permit. Exactas and trifectas can key Girls Knicks Now (5) and Palmilla's Bet (3) on top, using Presleys Volley (2), Mirage Code (1), and Misses Millie (4) underneath, with Belle Blaze (6) and Daretocatchlove (7) as deep exotics placements.
Selections
Win Girls Knicks Now (5)
Place Palmilla's Bet (3)
Show Presleys Volley (2)
Race 3 – Claiming – 5 Furlongs Dirt – Purse $22,000
Field: Baseball Politics (1), Twentyone N Change (2), Sidetown (3), Night Passage (4), Elusive Power (5).
Note: Sidetown (3) has multiple prior veterinary scratches noted on the scratch watch, so monitor the day-of scratches carefully.
Post Time
Scheduled post is 2:09 PM for this open claiming sprint with a modest but quality field of older geldings.
Pace Analysis
This is a short five-furlong dash where early speed and position are critical. Twentyone N Change (2), with a light weight of 117 pounds under apprentice Ronnie Huckaby, is a prime candidate to blast away from the gate. Baseball Politics (1) and Elusive Power (5) can be close-up, while Night Passage (4) may sit just behind.
If Twentyone N Change (2) clears off, he could be very difficult to catch, but if Baseball Politics (1) and Elusive Power (5) apply pressure, a stalker like Night Passage (4) can capitalize. With only five entries, wide trips are less of an issue, but the inside posts still enjoy a tactical benefit.
Key Contenders
Baseball Politics (1), ridden by David Cabrera for Mark W. Buehrer, is a leading contender from the rail with the right rider and class level. If Baseball Politics (1) breaks well, he can either set the pace or pocket up behind Twentyone N Change (2) and wait for a lane.
Elusive Power (5), with Curtis Kimes for Jory Ferrell, brings outside speed and experience that fits this $15,000 claiming event. From post 5, Elusive Power (5) can apply pressure to the inside speed and stay clear of traffic.
Secondary Choices
Twentyone N Change (2), also trained by Mark W. Buehrer and ridden by Ronnie Huckaby at a seven-pound weight break, is a live secondary win option who might get loose on the lead. Weight and early speed make Twentyone N Change (2) dangerous, especially if he is not pressed.
Night Passage (4), under Ezequiel Lara for Juan Padilla, shapes as a logical stalking type who can pick up the pieces if a duel develops. His post allows him to track the inside trio and swing out in mid-stretch.
Longshots
Sidetown (3), trained by Steve F. Williams with Obed Sanchez riding, carries some risk given recent veterinarian scratches noted on February 24. If he runs, he is still a talented enough horse to occupy the exotics, but he is a longshot win candidate without clear recent form details.
Betting Strategy
Win bets can be split between Baseball Politics (1) and Elusive Power (5), with a smaller saver on Twentyone N Change (2) if he floats up to a playable price. Exacta and trifecta plays should focus on Baseball Politics (1), Elusive Power (5), and Twentyone N Change (2) on top, with Night Passage (4) and Sidetown (3) as underneath pieces.
Selections
Win Baseball Politics (1)
Place Elusive Power (5)
Show Twentyone N Change (2)
Race 4 – Oklahoma-Bred Claiming – 6 Furlongs Dirt – Purse $13,000
Field: Callitfateluckarma (1), Gospel Cozy (2), She's A Bond Too (3), Rainbow Smiles (4), Suprising Code (5), Wild Gold Rush (6).
Post Time
Scheduled post is 2:41 PM for this Oklahoma-bred non-winners-of-three claiming sprint for fillies and mares.
Pace Analysis
Suprising Code (5) and Wild Gold Rush (6) appear to have enough early lick to be involved in the first flight, with Callitfateluckarma (1) and Gospel Cozy (2) likely stalking in the second tier. Rainbow Smiles (4) and She's A Bond Too (3) profile more as mid-pack grinders.
Given the state-bred class and distance, the pace could be honest but not suicidal, putting a premium on tactical speed in the first three furlongs. Inside posts one and two have the opportunity to save ground and strike turning for home.
Key Contenders
Rainbow Smiles (4), with David Cabrera riding for Scott Corderman, stands out as a strong contender with the best combination of experience and rider quality. From post 4, Rainbow Smiles (4) should have a clean outside stalking trip and enough finish to run down the leaders.
Callitfateluckarma (1), ridden by Belen Quinonez for Tristan Ashford, has the rail advantage and a profile that fits this non-winners-of-three spot. With a good break, Callitfateluckarma (1) can secure position close to the front and save every inch of ground.
Secondary Choices
Suprising Code (5), with Richard Eramia for Joe S. Offolter, figures prominently as an early pace factor that could stay on for a piece. If Suprising Code (5) clears off or gets comfortable fractions, she can be a serious win threat.
Wild Gold Rush (6), with Garrett Steinberg for John T. Brown, has outside early speed and can dictate terms if others do not commit. From post 6, Wild Gold Rush (6) should avoid traffic and could sit a pace-pressing trip.
Longshots
Gospel Cozy (2), with Angel Ortega Stanley for Steve F. Williams, and She's A Bond Too (3), ridden by Weston Hamilton for M. Brent Davidson, round out the field. Both appear more like exotics candidates than win threats, but they can hit the trifecta or superfecta if the pace scenario collapses or if one of the favorites underperforms.
Betting Strategy
Win bets can center on Rainbow Smiles (4) with a backup on Callitfateluckarma (1) if the latter offers a better price. Exotics should key Rainbow Smiles (4) and Callitfateluckarma (1) over Suprising Code (5) and Wild Gold Rush (6), while spreading slightly to include Gospel Cozy (2) and She's A Bond Too (3) underneath.
Selections
Win Rainbow Smiles (4)
Place Callitfateluckarma (1)
Show Suprising Code (5)
Race 5 – Starter Allowance – 1 Mile Dirt – Purse $16,000
Field: That's Something (1), Aspiring Comedian (2), Vestes (3), Prince Rama (4), Shadowless (5), Bourbon Life (6), Our Dream Rye'd (7).
Note: Our Dream Rye'd (7) has multiple prior trainer scratches noted for a February 2 starter race, so confirm his participation today.
Post Time
Scheduled post is 3:08 PM for this starter allowance at a route distance, restricted to horses that have started for $7,500 or less in recent years.
Pace Analysis
Aspiring Comedian (2), Vestes (3), and Bourbon Life (6) all have some early speed and project to vie for forward positions into the first turn. That's Something (1) and Shadowless (5) can sit mid-pack, while Prince Rama (4) and Our Dream Rye'd (7) may be more patient.
At one mile, sustained tactical speed and the ability to relax on the backstretch are critical. A three-way duel among Aspiring Comedian (2), Vestes (3), and Bourbon Life (6) could create a setup for a true closer, but more likely, one or two will back off and allow a controlled tempo.
Key Contenders
Bourbon Life (6), with Weston Hamilton riding for Scott Corderman, is a key contender and receives positive class commentary in some analytical circles for exiting allowance company at this track. From post 6, Bourbon Life (6) can sit just off the pace and move into contention at the three-eighths pole.
Vestes (3), under Curtis Kimes for Jory Ferrell, is another primary player with class and form lines from allowance company. With an inside-mid draw, Vestes (3) can secure position near the rail and either lead or track depending on the break.
Secondary Choices
That's Something (1), a 9-year-old gelding with Richard Eramia for Steve F. Williams, is the quintessential hard-knocking starter horse who can grind out a strong effort at this condition. From the rail, That's Something (1) will save ground and can rally inside turning for home.
Our Dream Rye'd (7), with David Cabrera for Boyd Caster, is a live secondary win candidate if he is fit and ready despite recent scratches. The outside draw allows Our Dream Rye'd (7) to avoid inside traffic and make one sustained run.
Longshots
Aspiring Comedian (2), with Angel Ortega Stanley for Mark W. Anderson, and Shadowless (5), under Alberto Pusac for the same trainer, both appear as pace or mid-pack types who can grab shares but may lack the finishing punch to win if the top pair fire. Prince Rama (4), ridden by Leandro Goncalves for Tony Rengstorf, has some appeal as a grinding longshot who may appreciate the distance but still seems a notch below the top contenders.
Betting Strategy
Win bets can focus on Bourbon Life (6) and Vestes (3), with a saver allocation on That's Something (1) if his price drifts. Exacta and trifecta structures should key Bourbon Life (6) and Vestes (3) on top, using That's Something (1), Our Dream Rye'd (7), and Prince Rama (4) in the middle and bottom rungs.
Selections
Win Bourbon Life (6)
Place Vestes (3)
Show That's Something (1)
Race 6 – Claiming – 5 1/2 Furlongs Dirt – Purse $12,000
Field: Cabo Cowgirl (1), An Awesome Legacy (2), Prairie Brat (3), Quart High (4), Bougie Like (5), Lady Of Light (6), Railey Jean (7).
Note: Lady Of Light (6) has a trainer scratch in prior form at Turfway Park, and Railey Jean (7) has multiple prior veterinarian scratches at this same track and class.
Post Time
Scheduled post is 3:35 PM for this second non-winners-of-two lifetime claiming sprint for fillies and mares.
Pace Analysis
Prairie Brat (3) and Bougie Like (5) appear to be the sharpest early pace elements, with Cabo Cowgirl (1) and Quart High (4) capable of sitting just behind them. An Awesome Legacy (2) and Lady Of Light (6) project as mid-pack stalkers, while Railey Jean (7) may lag early.
The race could feature a contested front, particularly if Bougie Like (5) and Prairie Brat (3) both commit to the lead, which opens the door for a stalking winner. Inside posts again offer a ground-saving advantage.
Key Contenders
Prairie Brat (3), trained by Juan Padilla with Travis Cunningham riding, is a key pace player with a strong chance to take them a long way on the front end. From post 3, Prairie Brat (3) should have the speed to secure the rail into the turn if she breaks well.
Bougie Like (5), with Ronnie Huckaby for Mark W. Buehrer, is another central contender with good early speed and an outside sprint draw that allows a pressing trip. If Prairie Brat (3) does not show her best early, Bougie Like (5) could clear and control.
Secondary Choices
Cabo Cowgirl (1), under Obed Sanchez for Tyanna Lechtenberg, is a logical secondary win candidate who can save ground and pounce if the leaders come back. Her rail draw and stalking style should place Cabo Cowgirl (1) in a perfect spot entering the stretch.
Quart High (4), with Alberto Pusac for the same barn as Cabo Cowgirl (1), is another mid-pack runner with a chance to pick up pieces late. While perhaps not as flashy on paper, Quart High (4) is usable in exotics.
Longshots
An Awesome Legacy (2), ridden by Weston Hamilton for Patrick E. Swan, can be a mid-priced player with some late interest but looks more like a minor award type. Lady Of Light (6), for Shon M. Dunlap with Larren Delorme, and Railey Jean (7), with Curtis Kimes for Tim Dixon, both carry some risk profile given recent scratches or inconsistent form, but they should not be entirely dismissed from deeper trifectas.
Betting Strategy
Win bets can split between Prairie Brat (3) and Bougie Like (5), with emphasis on whichever offers better value. Exactas and trifectas can key Prairie Brat (3) and Bougie Like (5) in the top slots, using Cabo Cowgirl (1) and Quart High (4) underneath, and sprinkling in An Awesome Legacy (2), Lady Of Light (6), and Railey Jean (7) as longshot closers.
Selections
Win Prairie Brat (3)
Place Bougie Like (5)
Show Cabo Cowgirl (1)
Race 7 – Oklahoma-Bred Claiming – 5 1/2 Furlongs Dirt – Purse $20,000
Field: Title Talk (1), K Q Spirit (2), Howboutcha (3), West Of Town (4), Jamesons Chalk (5), Gospel War Cry (6), Atreidesreflection (7).
Post Time
Scheduled post is 4:02 PM for this Oklahoma-bred non-winners-of-two sprint, one of the more competitive state-bred events today.
Pace Analysis
Title Talk (1), Howboutcha (3), West Of Town (4), and Gospel War Cry (6) all show profiles of wanting or being able to be forwardly placed. K Q Spirit (2) and Jamesons Chalk (5) can track just behind, while Atreidesreflection (7) from the outside may choose a stalking trip.
With multiple early-speed candidates, there is a real chance of a quick pace, particularly if Title Talk (1) and Howboutcha (3) both send from inside posts. A horse who can sit just off the leaders and avoid being part of the early duel will have an advantage.
Key Contenders
Gospel War Cry (6), ridden by Richard Eramia for Steve F. Williams, is a major win contender with the right blend of tactical speed and finishing ability. From post 6, Gospel War Cry (6) can sit just outside the early duel and strike on the turn.
K Q Spirit (2), with David Cabrera for Juan Padilla, also looks like a key player who can apply pressure or stalk depending on break and early fractions. The inside-mid draw at post 2 offers a ground-saving trip if K Q Spirit (2) can avoid getting shuffled.
Secondary Choices
Title Talk (1), under Obed Sanchez for Boyd Caster, is a very plausible secondary win candidate who can take advantage of the rail and sharp gate speed. If Title Talk (1) clears without too much pressure, he becomes dangerous.
Jamesons Chalk (5), with Belen Quinonez for Edward Ross Hardy, is an evenly running type who may get first run on tiring speed and hold for a minor award.
Longshots
Howboutcha (3), with Ronnie Huckaby for Tyanna Lechtenberg, and West Of Town (4), ridden by Angel Ortega Stanley for Brent Davidson, are both longshot pace pieces who can improve if the track is strongly favoring speed. Atreidesreflection (7), with Leandro Goncalves for Francisco Bravo, is a more stalking-oriented longshot that could clunk up if the pace melts down late.
Betting Strategy
Win bets should lean toward Gospel War Cry (6), with K Q Spirit (2) as the main backup. Exactas and trifectas can key Gospel War Cry (6) and K Q Spirit (2) on top, using Title Talk (1), Jamesons Chalk (5), and Atreidesreflection (7) underneath, with small coverage including Howboutcha (3) and West Of Town (4) for deeper tickets.
Selections
Win Gospel War Cry (6)
Place K Q Spirit (2)
Show Title Talk (1)
Race 8 – Oklahoma-Bred Allowance – 6 Furlongs Dirt – Purse $28,000
Field: Mortify (1), Washita Valley (2), Slades Tank (3), Big Kitty (4), One Big Haas (5), Yougotthisjr (6).
Post Time
Scheduled post is 4:34 PM for this Oklahoma-bred allowance feature, one of the most lucrative and competitive races on the card.
Pace Analysis
Mortify (1), Slades Tank (3), Big Kitty (4), and One Big Haas (5) all show some speed tendencies, while Washita Valley (2) and Yougotthisjr (6) can stalk in mid-pack. The inside draw may force Mortify (1) to commit early to avoid getting shuffled, which could contribute to sharper fractions.
With multiple pace types and a reasonable purse, this race projects to have at least an honest, possibly fast, early tempo. Horses that can sit a length or two off the leaders and still finish strongly should be favored.
Key Contenders
Washita Valley (2), trained by Francisco Bravo with Leandro Goncalves aboard, is a primary win candidate with a strong local allowance profile. His post 2 draw allows Washita Valley (2) to take a stalking trip behind the inside speed and tip out late.
Mortify (1), with Ezequiel Lara for Juan Padilla, is another key contender, especially if he can break sharply and secure the rail. If the rail is playing fairly, Mortify (1) can prove tough to pass.
Secondary Choices
One Big Haas (5), under Angel Ortega Stanley for Miguel Angel Silva, is a mid-outside speed or presser who can be in the right spot turning for home. If the early leaders duel, One Big Haas (5) may inherit the lead in upper stretch.
Yougotthisjr (6), ridden by Weston Hamilton for Robbin Caldwell, is a logical secondary choice for exotics, with enough tactical speed to stay in touch and finish in the trifecta.
Longshots
Slades Tank (3), with Alberto Pusac for Dionicio Cruz-Reyes, and Big Kitty (4), ridden by Ronnie Huckaby for Tristan Ashford, both look a notch below the top tier but have enough speed to factor early. They are usable at prices in vertical spreads, particularly if the track favors speed.
Betting Strategy
Win bets should concentrate on Washita Valley (2), with Mortify (1) as a strong backup if Washita Valley (2) takes more money. Exactas and trifectas can key Washita Valley (2) and Mortify (1) on top, with One Big Haas (5) and Yougotthisjr (6) primarily underneath, and Slades Tank (3) and Big Kitty (4) as longshot inclusions.
Selections
Win Washita Valley (2)
Place Mortify (1)
Show One Big Haas (5)
Race 9 – Oklahoma-Bred Maiden Special Weight – 6 Furlongs Dirt – Purse $25,000
Field: Get Dreamy (1), Cool Okie (2), El Protonico (3), Love U Father (4), Son Of Preacherman (5), Luckyblingmountain (6), Pass The Roses (7), Sandthefloor (8), Clay's Worth (9), Leavenodoubt (10), Max's Lucky Bling (11), Maximum Power (12).
Note: Maximum Power (12) has prior veterinarian scratches listed for a February 2 maiden special weight, so his current status should be confirmed.
Post Time
Scheduled post is 5:06 PM for a full-field maiden special weight for Oklahoma-breds, likely to be one of the trickiest betting races on the card.
Pace Analysis
Cool Okie (2), Love U Father (4), Luckyblingmountain (6), Pass The Roses (7), and Leavenodoubt (10) all show profiles compatible with early speed or pressing trips. Get Dreamy (1) and Sandthefloor (8) can stalk from inside and middle posts, while horses such as El Protonico (3), Clay's Worth (9), Max's Lucky Bling (11), and Maximum Power (12) may settle mid-pack or further back.
With a full twelve-horse field and multiple speed candidates, this race projects to feature a strong early pace, especially if several of the 3-year-olds are eager in their first or second starts. Trips and traffic will play a significant role, particularly for horses drawn inside and those needing to rally wide.
Key Contenders
Cool Okie (2), ridden by Floyd Wethey Jr. for Scott E. Young, is a primary win candidate given the strong local connections and likely tactical speed. From post 2, Cool Okie (2) can secure a forward position and save ground into the turn.
Luckyblingmountain (6), with Weston Hamilton for M. Brent Davidson, is another key contender with enough early speed and a solid middle draw. Luckyblingmountain (6) should have every chance to track the leaders and take over if they falter.
Secondary Choices
Leavenodoubt (10), with Ezequiel Lara for George Blatchford, is a secondary win option whose outside draw allows for a cleaner trip, especially if the early pace collapses. From post 10, Leavenodoubt (10) can avoid the worst of the inside traffic.
Max's Lucky Bling (11), ridden by Angel Ortega Stanley for M. Brent Davidson, adds another strong outside presence with likely improvement potential in this spot. His draw and connections make Max's Lucky Bling (11) an attractive exotics piece.
Longshots
Get Dreamy (1), with Alberto Pusac for Miguel Angel Silva, gets the rail draw and could be a price play if he breaks well and uses the inside to his advantage. El Protonico (3), with Ronnie Huckaby for Mike Abney, and Love U Father (4), ridden by Leandro Goncalves for Juliana Blandi Goncalves, both have some appeal as longshot early speed types.
Son Of Preacherman (5), with Obed Sanchez for Jehu Lewis, is an 8-year-old maiden, which is a negative, but he could still clunk up for minor awards if chaos ensues. Pass The Roses (7), under Emanuel Castillo Zabala for Joe S. Offolter, Sandthefloor (8), with Travis Cunningham for Randy E. Swango, Clay's Worth (9), with Lindsey Hebert for J. Alan Williams, and Maximum Power (12), with Garrett Steinberg for Scott E. Young, all fall into the longshot or deep exotic category; any could outrun their odds with a favorable trip.
Betting Strategy
Given the full field, this is an excellent race to seek value and avoid taking a short price unless clearly justified. Win bets can focus on Cool Okie (2) and Luckyblingmountain (6), with a smaller flyer on Leavenodoubt (10) if the price is right. Trifectas and superfectas should be structured with Cool Okie (2), Luckyblingmountain (6), and Leavenodoubt (10) on top, spreading to include Get Dreamy (1), Max's Lucky Bling (11), and one or two longshots like Sandthefloor (8) or Clay's Worth (9) underneath.
Selections
Win Cool Okie (2)
Place Luckyblingmountain (6)
Show Leavenodoubt (10)
Jockey Notes and Insights
At Will Rogers Downs, local familiarity and timing in sprints can provide a significant edge, and several riders on this card stand out based on their regional reputations and bookings.
David Cabrera, aboard horses such as Palmilla's Bet (3) in race 2, Baseball Politics (1) in race 3, Rainbow Smiles (4) in race 4, Our Dream Rye'd (7) in race 5, and others, is one of the more accomplished riders on the card and is particularly adept at getting good position in sprints and saving ground when possible. When Cabrera lands on a horse that projects as a top contender, that mount deserves extra consideration.
Richard Eramia, who rides Njustlikethat (3) in race 1, Suprising Code (5) in race 4, That's Something (1) in race 5, and Gospel War Cry (6) in race 7, is a strong tactical rider who often places his mounts in winning spots without over-committing early. His presence is a notable positive in competitive fields, especially when riding for barns that use him regularly.
Leandro Goncalves, on Candy Cactus (5) in race 1, Prince Rama (4) in race 5, Washita Valley (2) in race 8, and Love U Father (4) in race 9, brings experience and strong finishing timing. His mounts often get well-judged, sustained runs, making him particularly valuable on horses that want to stalk and pounce.
Ezequiel Lara, aboard Mirage Code (1) in race 2, Night Passage (4) in race 3, Mortify (1) in race 8, and Leavenodoubt (10) in race 9, is a capable local rider whose mounts should not be overlooked. His inside rides, especially from posts 1 and 2, can benefit from ground-saving trips.
Apprentice Ronnie Huckaby appears on several price horses such as Twentyone N Change (2) in race 3, Belle Blaze (6) in race 2, Big Kitty (4) in race 8, Howboutcha (3) in race 7, and El Protonico (3) in race 9, offering a weight break and aggressive early positioning. His presence can enhance the appeal of speed-oriented longshots.
Trainer Notes and Insights
Several trainers have multiple live runners on the card, which can inform both intra-card momentum and patterns.
Steve F. Williams saddles Njustlikethat (3) in race 1, Sidetown (3) in race 3, Gospel Cozy (2) in race 4, That's Something (1) in race 5, and Gospel War Cry (6) in race 7, indicating a strong presence across several races. This barn is traditionally competitive at Will Rogers Downs, especially with Oklahoma-bred runners and mid-level claimers.
Jory Ferrell conditions Elusive Power (5) in race 3 and Vestes (3) in race 5, both of whom appear as key contenders at their respective levels. This trainer often spots horses realistically in claiming and starter conditions, and today's placements fit that pattern.
Francisco Bravo trains Atreidesreflection (7) in race 7 and Washita Valley (2) in race 8, with Washita Valley (2) specifically projecting as a strong allowance player. Bravo's Oklahoma-bred horses frequently run well at this track, particularly in allowance and higher-claiming company.
Scott E. Young sends out Girls Knicks Now (5) in race 2, Cool Okie (2) in race 9, and Maximum Power (12) also in race 9, consolidating his influence in the non-winners-of-two and maiden ranks. His runners often show speed and are well-prepared for local conditions.
Tyanna Lechtenberg has Misses Millie (4) in race 2, Cabo Cowgirl (1) and Quart High (4) in race 6, and Howboutcha (3) in race 7, suggesting a focus on fillies and mares and Oklahoma-bred claimers. Her horses can be dangerous at prices, especially when drawing inside and securing good early position.
Best Wagering Strategies and Value Plays
From a horizontal and vertical wagering standpoint, this card offers several opportunities to structure multi-race plays and seek value in contentious races.
In early multi-race sequences, such as a Pick 3 or early Pick 4, the opening races feature relatively compact fields, making it possible to lean more heavily on top selections like Njustlikethat (3) and Candy Cactus (5) in race 1, Girls Knicks Now (5) and Palmilla's Bet (3) in race 2, and Baseball Politics (1), Elusive Power (5), and Twentyone N Change (2) in race 3. Using one or two strong singles early can allow deeper coverage in later, more competitive races.
The middle of the card, especially races 5 and 6, is attractive for multi-race value. In race 5, Bourbon Life (6) and Vestes (3) are logical anchors, but including That's Something (1) and Our Dream Rye'd (7) can catch an upset in a Pick 4 or Pick 5. In race 6, spreading among Prairie Brat (3), Bougie Like (5), Cabo Cowgirl (1), and Quart High (4) provides coverage in a race where the pace scenario could shift outcomes.
The late sequence, involving races 7 through 9, is where exotic value is likely highest. In race 7, Gospel War Cry (6) and K Q Spirit (2) make a solid two-deep core, with Title Talk (1) and Atreidesreflection (7) as value backups. Race 8 can use Washita Valley (2) as a tentative single in some tickets, with Mortify (1) and One Big Haas (5) added on more expansive tickets.
Race 9 is the key spread race for late Pick 4 or Pick 5 structures, where nearly half the field is usable. Core contenders like Cool Okie (2), Luckyblingmountain (6), and Leavenodoubt (10) should be accompanied by value inclusions such as Get Dreamy (1), Max's Lucky Bling (11), and perhaps Sandthefloor (8) or Clay's Worth (9) to capture a potential upset at healthy odds. Given the uncertainty in maiden special weights, this is an ideal leg to widen rather than narrow.
Vertical wagers such as trifectas and superfectas are most appealing in the bigger fields (races 2, 6, and 9), where overlay prices can slip into the top four. Structuring tickets with clear A-level keys (for example, Girls Knicks Now (5) and Palmilla's Bet (3) in race 2, Prairie Brat (3) and Bougie Like (5) in race 6, Cool Okie (2) and Luckyblingmountain (6) in race 9) over a rotating cast of B and C horses can maximize potential return while controlling cost.
Morning line odds were not available through the sources accessed, so pricing assumptions must be inferred from field composition and connections. Without explicit lines, it is advisable to remain flexible and adjust your primary win and key horses slightly based on actual toteboard behavior, siding with overlays when they offer genuine value over short-priced favorites in competitive races.

