Chart Guide (2.0.36)
- Bubbles
- Color = surface: green (turf), brown (dirt), blue (synthetic)
- Top number = finishing position; bottom number in parentheses = starting post position
- Height above line = beaten lengths — closer means a smaller margin
- Border = track conditions: green (FST/GD/FM), yellow (WF/SL/YLD), red (SY/MY/FRZ/SFT/HVY)
- Connecting Line
- Solid = good conditions; dashed = bad conditions
- Line Symbol
- ▲ Triangle = sprint (7f or less); ● Circle = route (more than 7f)
- Days Between Races
- Small number above each bubble (e.g. 19d) = days since the previous race — helps spot freshness, layoffs, and tight scheduling.
- Shaded Band (Bollinger)
- Highlights volatility — a wider band means more variation in recent performance
- Performance Trend
- Straight line showing the overall performance direction — angled up = improving, angled down = declining
- Dashed Reference Line
- AI Opponent = AI analysis class-level par for the race
AI Model History Guide
- Lines
- Each solid line shows this horse’s model score over its last 10 races: blue = Mod1, green = Mod2, amber = Mod3.
- Dashed Lines
- Dashed lines represent the current race’s field average for each model — a score below the dashed line indicates the horse ranked below average in this model’s assessment.
- Higher is Stronger
- All three model scores are 0–100: a higher number means the model rates this horse more favorably among the field.
Performance vs. Peers Guide
- Bars (per post)
- Blue = avg career performance • Amber = avg last 3 races • Green = last race (improved vs. avg) • Red = last race (declined vs. avg)
- Trend Line
- Angled line above the bars: rising = improving form • falling = declining form.
- Horizontal Line
- Field average — the mean career performance of all horses in this race.
- Color Circles
- Standard post-position colors below each lane — same as the Total Pace chart.
- Border
- Thicker border = this horse’s post position.
Figure Comparison
- Rating
- The three Pick Pony algorithm ratings (Algo 1, Algo 2, Algo 3) that make up the overall PP AI Rating — higher is a stronger contender rating.
- Speed
- Career average speed, recent 3-race average, and last-race speed figure — spot horses in improving or declining form.
- Pace
- Average Early (E1), Mid (E2), and Stretch (LP) pace figures — reveals pace-setters vs. closers vs. all-the-way types.
- This horse
- The horse whose stats card is open is highlighted with a darker column background.
Winning Profiles
- Axes
- X: Win % from last 10 starts — Y: In-the-money % (top-3 finishes) from last 10 starts.
- Quadrants
- Consistent Winners (top-right): high win & ITM — reliable performers.
Place Threats (top-left): boards often but doesn’t win often — good exacta/trifecta angles.
Streaky (bottom-right): wins occasionally, misses the board often — all-or-nothing.
Developing (bottom-left): still finding form — longshot territory. - Reference Lines
- Dashed lines mark field averages. Dots to the right win more; dots higher board more.
- This horse
- Highlighted with a gold border and larger dot.
AI Model Comparison
- Winner Models (green)
- Mod1(W), Mod2(W), and Mod3(W) trained to predict race winners. Higher score = stronger contender.
- Longshot Models (red)
- Mod1-LS, Mod2-LS, and Mod3-LS trained to find high-value longshots. Higher score = stronger longshot candidate.
- Form Model (blue)
- Mod4 sequence model trained on recent form patterns. Higher score = stronger recent form profile.
- This horse
- Highlighted with a darker column background.
Race Pace Simulation Guide
- Slider
- Drag left→right to advance from gate to finish. Drag all the way back to reset the race.
- Predicted Finish Order
- Factors in contested pace burn, each horse’s effort curve (peaked-early vs. peaked-late), and wide trip cost from outside posts. Updated live when Track Bias changes.
- Pace Scenario
- Lone Speed: single E horse likely rates and holds. Contested: two E horses burn each other — closers benefit. Hot Pace: speed meltdown, deep closers thrive. Soft: no early speed, moderate fractions throughout.
- Track Bias
- Slider below canvas. −2 = strong closer/wet bias; +2 = strong speed/rail bias. Recomputes the predicted finish order.
- Boxed Indicator
- Dashed orange ring = horse is surrounded (rival ahead, rival behind, wall outside). In a real race this horse must find a clear path to run.
- Running Styles
- E/EE = early speed (rushes to rail). P = presser (stalks the pace). S = stalker. SS = slow starter / closer.
| Stat | vs. Current Card | vs. All Horses |
|---|---|---|
| Averages
Career-average metrics across all AI race analysis. Performance and pace averages reflect estimated historical performance; trainer and jockey grades score in-the-money percentages. Grading scale: A = elite • B = above average • C = average • D = below average • F = poor • — = no data |
||
| Pick Pony AI Rating | C | B |
| Pace Trip Longshot | — | — |
| Connections Longshot | — | — |
| Situational Longshot | — | — |
| Speed | A | A |
| Early Pace | D | B |
| Mid Pace | B | A |
| Late Pace | A | A |
| Finish Pos | B | C |
| Dirt Speed | A | A |
| Turf Speed | D | B |
| Distance Speed | A | A |
| Trainer Effectiveness | A | A |
| Jockey Effectiveness | B | C |
| 3rd Party Ratings | C | B |
| Recent
Performance analysis from the horse's recent races, weighted to reflect current form. Sprint and Route FPS (Foot Per Second) measure pace efficiency over the horse's recent sprints and routes respectively. Grading scale: A = elite • B = above average • C = average • D = below average • F = poor • — = no data |
||
| Speed | B | B |
| Early Pace | D | C |
| Mid Pace | D | B |
| Late Pace | B | B |
| Sprint FPS | D | D |
| Route FPS | D | D |
| Trainer Effectiveness | A | A |
| Jockey Effectiveness | B | C |
| 3rd Party Ratings | C | B |
| Predictions
AI-generated projections for the upcoming race, derived from prior AI analysis for speed and pace trends, surface and distance suitability, and current conditions. Grading scale: A = elite • B = above average • C = average • D = below average • F = poor • — = no data |
||
| Speed | A | B |
| Early Pace | B | B |
| Mid Pace | B | B |
| Late Pace | C | C |
Chart Guide (2.0.36)
- Bubbles
- Color = surface: green (turf), brown (dirt), blue (synthetic)
- Top number = finishing position; bottom number in parentheses = starting post position
- Height above line = beaten lengths — closer means a smaller margin
- Border = track conditions: green (FST/GD/FM), yellow (WF/SL/YLD), red (SY/MY/FRZ/SFT/HVY)
- Connecting Line
- Solid = good conditions; dashed = bad conditions
- Line Symbol
- ▲ Triangle = sprint (7f or less); ● Circle = route (more than 7f)
- Days Between Races
- Small number above each bubble (e.g. 19d) = days since the previous race — helps spot freshness, layoffs, and tight scheduling.
- Shaded Band (Bollinger)
- Highlights volatility — a wider band means more variation in recent performance
- Performance Trend
- Straight line showing the overall performance direction — angled up = improving, angled down = declining
- Dashed Reference Line
- AI Opponent = AI analysis class-level par for the race
AI Model History Guide
- Lines
- Each solid line shows this horse’s model score over its last 10 races: blue = Mod1, green = Mod2, amber = Mod3.
- Dashed Lines
- Dashed lines represent the current race’s field average for each model — a score below the dashed line indicates the horse ranked below average in this model’s assessment.
- Higher is Stronger
- All three model scores are 0–100: a higher number means the model rates this horse more favorably among the field.
Mod1(W): 82 (1/8) Mod2(W): 75 (2/8) Mod3(W): 79 (3/8) Mod1-LS: 55 (6/8) Win Prob: 18.4% Value Score: 1.35 ★
Performance vs. Peers Guide
- Bars (per post)
- Blue = avg career performance • Amber = avg last 3 races • Green = last race (improved vs. avg) • Red = last race (declined vs. avg)
- Trend Line
- Angled line above the bars: rising = improving form • falling = declining form.
- Horizontal Line
- Field average — the mean career performance of all horses in this race.
- Color Circles
- Standard post-position colors below each lane — same as the Total Pace chart.
- Border
- Thicker border = this horse’s post position.
Figure Comparison
- Rating
- The three Pick Pony algorithm ratings (Algo 1, Algo 2, Algo 3) that make up the overall PP AI Rating — higher is a stronger contender rating.
- Speed
- Career average speed, recent 3-race average, and last-race speed figure — spot horses in improving or declining form.
- Pace
- Average Early (E1), Mid (E2), and Stretch (LP) pace figures — reveals pace-setters vs. closers vs. all-the-way types.
- This horse
- The horse whose stats card is open is highlighted with a darker column background.
Winning Profiles
- Axes
- X: Win % from last 10 starts — Y: In-the-money % (top-3 finishes) from last 10 starts.
- Quadrants
- Consistent Winners (top-right): high win & ITM — reliable performers.
Place Threats (top-left): boards often but doesn’t win often — good exacta/trifecta angles.
Streaky (bottom-right): wins occasionally, misses the board often — all-or-nothing.
Developing (bottom-left): still finding form — longshot territory. - Reference Lines
- Dashed lines mark field averages. Dots to the right win more; dots higher board more.
- This horse
- Highlighted with a gold border and larger dot.
AI Model Comparison
- Winner Models (green)
- Mod1(W), Mod2(W), and Mod3(W) trained to predict race winners. Higher score = stronger contender.
- Longshot Models (red)
- Mod1-LS, Mod2-LS, and Mod3-LS trained to find high-value longshots. Higher score = stronger longshot candidate.
- Form Model (blue)
- Mod4 sequence model trained on recent form patterns. Higher score = stronger recent form profile.
- This horse
- Highlighted with a darker column background.
Race Pace Simulation Guide
- Slider
- Drag left→right to advance from gate to finish. Drag all the way back to reset the race.
- Predicted Finish Order
- Factors in contested pace burn, each horse’s effort curve (peaked-early vs. peaked-late), and wide trip cost from outside posts. Updated live when Track Bias changes.
- Pace Scenario
- Lone Speed: single E horse likely rates and holds. Contested: two E horses burn each other — closers benefit. Hot Pace: speed meltdown, deep closers thrive. Soft: no early speed, moderate fractions throughout.
- Track Bias
- Slider below canvas. −2 = strong closer/wet bias; +2 = strong speed/rail bias. Recomputes the predicted finish order.
- Boxed Indicator
- Dashed orange ring = horse is surrounded (rival ahead, rival behind, wall outside). In a real race this horse must find a clear path to run.
- Running Styles
- E/EE = early speed (rushes to rail). P = presser (stalks the pace). S = stalker. SS = slow starter / closer.
| Stat | vs. Current Card | vs. All Horses |
|---|---|---|
| Averages
Career-average metrics across all AI race analysis. Performance and pace averages reflect estimated historical performance; trainer and jockey grades score in-the-money percentages. Grading scale: A = elite • B = above average • C = average • D = below average • F = poor • — = no data |
||
| Pick Pony AI Rating | B | B |
| Pace Trip Longshot | — | — |
| Connections Longshot | — | — |
| Situational Longshot | — | — |
| Speed | A | A |
| Early Pace | D | C |
| Mid Pace | C | B |
| Late Pace | A | A |
| Finish Pos | A | B |
| Dirt Speed | C | A |
| Turf Speed | F | D |
| Distance Speed | B | A |
| Trainer Effectiveness | A | A |
| Jockey Effectiveness | D | D |
| 3rd Party Ratings | A | A |
| Recent
Performance analysis from the horse's recent races, weighted to reflect current form. Sprint and Route FPS (Foot Per Second) measure pace efficiency over the horse's recent sprints and routes respectively. Grading scale: A = elite • B = above average • C = average • D = below average • F = poor • — = no data |
||
| Speed | A | A |
| Early Pace | D | B |
| Mid Pace | D | B |
| Late Pace | A | A |
| Sprint FPS | F | D |
| Route FPS | F | D |
| Trainer Effectiveness | A | A |
| Jockey Effectiveness | D | D |
| 3rd Party Ratings | A | A |
| Predictions
AI-generated projections for the upcoming race, derived from prior AI analysis for speed and pace trends, surface and distance suitability, and current conditions. Grading scale: A = elite • B = above average • C = average • D = below average • F = poor • — = no data |
||
| Speed | A | A |
| Early Pace | D | C |
| Mid Pace | C | B |
| Late Pace | C | C |
Chart Guide (2.0.36)
- Bubbles
- Color = surface: green (turf), brown (dirt), blue (synthetic)
- Top number = finishing position; bottom number in parentheses = starting post position
- Height above line = beaten lengths — closer means a smaller margin
- Border = track conditions: green (FST/GD/FM), yellow (WF/SL/YLD), red (SY/MY/FRZ/SFT/HVY)
- Connecting Line
- Solid = good conditions; dashed = bad conditions
- Line Symbol
- ▲ Triangle = sprint (7f or less); ● Circle = route (more than 7f)
- Days Between Races
- Small number above each bubble (e.g. 19d) = days since the previous race — helps spot freshness, layoffs, and tight scheduling.
- Shaded Band (Bollinger)
- Highlights volatility — a wider band means more variation in recent performance
- Performance Trend
- Straight line showing the overall performance direction — angled up = improving, angled down = declining
- Dashed Reference Line
- AI Opponent = AI analysis class-level par for the race
AI Model History Guide
- Lines
- Each solid line shows this horse’s model score over its last 10 races: blue = Mod1, green = Mod2, amber = Mod3.
- Dashed Lines
- Dashed lines represent the current race’s field average for each model — a score below the dashed line indicates the horse ranked below average in this model’s assessment.
- Higher is Stronger
- All three model scores are 0–100: a higher number means the model rates this horse more favorably among the field.
Mod1(W): 82 (1/8) Mod2(W): 75 (2/8) Mod3(W): 79 (3/8) Mod1-LS: 55 (6/8) Win Prob: 18.4% Value Score: 1.35 ★
Performance vs. Peers Guide
- Bars (per post)
- Blue = avg career performance • Amber = avg last 3 races • Green = last race (improved vs. avg) • Red = last race (declined vs. avg)
- Trend Line
- Angled line above the bars: rising = improving form • falling = declining form.
- Horizontal Line
- Field average — the mean career performance of all horses in this race.
- Color Circles
- Standard post-position colors below each lane — same as the Total Pace chart.
- Border
- Thicker border = this horse’s post position.
Figure Comparison
- Rating
- The three Pick Pony algorithm ratings (Algo 1, Algo 2, Algo 3) that make up the overall PP AI Rating — higher is a stronger contender rating.
- Speed
- Career average speed, recent 3-race average, and last-race speed figure — spot horses in improving or declining form.
- Pace
- Average Early (E1), Mid (E2), and Stretch (LP) pace figures — reveals pace-setters vs. closers vs. all-the-way types.
- This horse
- The horse whose stats card is open is highlighted with a darker column background.
Winning Profiles
- Axes
- X: Win % from last 10 starts — Y: In-the-money % (top-3 finishes) from last 10 starts.
- Quadrants
- Consistent Winners (top-right): high win & ITM — reliable performers.
Place Threats (top-left): boards often but doesn’t win often — good exacta/trifecta angles.
Streaky (bottom-right): wins occasionally, misses the board often — all-or-nothing.
Developing (bottom-left): still finding form — longshot territory. - Reference Lines
- Dashed lines mark field averages. Dots to the right win more; dots higher board more.
- This horse
- Highlighted with a gold border and larger dot.
AI Model Comparison
- Winner Models (green)
- Mod1(W), Mod2(W), and Mod3(W) trained to predict race winners. Higher score = stronger contender.
- Longshot Models (red)
- Mod1-LS, Mod2-LS, and Mod3-LS trained to find high-value longshots. Higher score = stronger longshot candidate.
- Form Model (blue)
- Mod4 sequence model trained on recent form patterns. Higher score = stronger recent form profile.
- This horse
- Highlighted with a darker column background.
Race Pace Simulation Guide
- Slider
- Drag left→right to advance from gate to finish. Drag all the way back to reset the race.
- Predicted Finish Order
- Factors in contested pace burn, each horse’s effort curve (peaked-early vs. peaked-late), and wide trip cost from outside posts. Updated live when Track Bias changes.
- Pace Scenario
- Lone Speed: single E horse likely rates and holds. Contested: two E horses burn each other — closers benefit. Hot Pace: speed meltdown, deep closers thrive. Soft: no early speed, moderate fractions throughout.
- Track Bias
- Slider below canvas. −2 = strong closer/wet bias; +2 = strong speed/rail bias. Recomputes the predicted finish order.
- Boxed Indicator
- Dashed orange ring = horse is surrounded (rival ahead, rival behind, wall outside). In a real race this horse must find a clear path to run.
- Running Styles
- E/EE = early speed (rushes to rail). P = presser (stalks the pace). S = stalker. SS = slow starter / closer.
| Stat | vs. Current Card | vs. All Horses |
|---|---|---|
| Averages
Career-average metrics across all AI race analysis. Performance and pace averages reflect estimated historical performance; trainer and jockey grades score in-the-money percentages. Grading scale: A = elite • B = above average • C = average • D = below average • F = poor • — = no data |
||
| Pick Pony AI Rating | A | A |
| Pace Trip Longshot | — | — |
| Connections Longshot | — | — |
| Situational Longshot | — | — |
| Speed | B | B |
| Early Pace | A | A |
| Mid Pace | A | A |
| Late Pace | B | B |
| Finish Pos | B | D |
| Dirt Speed | A | A |
| Turf Speed | A | A |
| Distance Speed | A | A |
| Trainer Effectiveness | B | C |
| Jockey Effectiveness | A | B |
| 3rd Party Ratings | B | B |
| Recent
Performance analysis from the horse's recent races, weighted to reflect current form. Sprint and Route FPS (Foot Per Second) measure pace efficiency over the horse's recent sprints and routes respectively. Grading scale: A = elite • B = above average • C = average • D = below average • F = poor • — = no data |
||
| Speed | A | B |
| Early Pace | A | A |
| Mid Pace | B | A |
| Late Pace | C | B |
| Sprint FPS | A | A |
| Route FPS | B | B |
| Trainer Effectiveness | B | C |
| Jockey Effectiveness | A | B |
| 3rd Party Ratings | B | B |
| Predictions
AI-generated projections for the upcoming race, derived from prior AI analysis for speed and pace trends, surface and distance suitability, and current conditions. Grading scale: A = elite • B = above average • C = average • D = below average • F = poor • — = no data |
||
| Speed | B | B |
| Early Pace | A | A |
| Mid Pace | A | A |
| Late Pace | C | C |
Chart Guide (2.0.36)
- Bubbles
- Color = surface: green (turf), brown (dirt), blue (synthetic)
- Top number = finishing position; bottom number in parentheses = starting post position
- Height above line = beaten lengths — closer means a smaller margin
- Border = track conditions: green (FST/GD/FM), yellow (WF/SL/YLD), red (SY/MY/FRZ/SFT/HVY)
- Connecting Line
- Solid = good conditions; dashed = bad conditions
- Line Symbol
- ▲ Triangle = sprint (7f or less); ● Circle = route (more than 7f)
- Days Between Races
- Small number above each bubble (e.g. 19d) = days since the previous race — helps spot freshness, layoffs, and tight scheduling.
- Shaded Band (Bollinger)
- Highlights volatility — a wider band means more variation in recent performance
- Performance Trend
- Straight line showing the overall performance direction — angled up = improving, angled down = declining
- Dashed Reference Line
- AI Opponent = AI analysis class-level par for the race
AI Model History Guide
- Lines
- Each solid line shows this horse’s model score over its last 10 races: blue = Mod1, green = Mod2, amber = Mod3.
- Dashed Lines
- Dashed lines represent the current race’s field average for each model — a score below the dashed line indicates the horse ranked below average in this model’s assessment.
- Higher is Stronger
- All three model scores are 0–100: a higher number means the model rates this horse more favorably among the field.
Mod1(W): 82 (1/8) Mod2(W): 75 (2/8) Mod3(W): 79 (3/8) Mod1-LS: 55 (6/8) Win Prob: 18.4% Value Score: 1.35 ★
Performance vs. Peers Guide
- Bars (per post)
- Blue = avg career performance • Amber = avg last 3 races • Green = last race (improved vs. avg) • Red = last race (declined vs. avg)
- Trend Line
- Angled line above the bars: rising = improving form • falling = declining form.
- Horizontal Line
- Field average — the mean career performance of all horses in this race.
- Color Circles
- Standard post-position colors below each lane — same as the Total Pace chart.
- Border
- Thicker border = this horse’s post position.
Figure Comparison
- Rating
- The three Pick Pony algorithm ratings (Algo 1, Algo 2, Algo 3) that make up the overall PP AI Rating — higher is a stronger contender rating.
- Speed
- Career average speed, recent 3-race average, and last-race speed figure — spot horses in improving or declining form.
- Pace
- Average Early (E1), Mid (E2), and Stretch (LP) pace figures — reveals pace-setters vs. closers vs. all-the-way types.
- This horse
- The horse whose stats card is open is highlighted with a darker column background.
Winning Profiles
- Axes
- X: Win % from last 10 starts — Y: In-the-money % (top-3 finishes) from last 10 starts.
- Quadrants
- Consistent Winners (top-right): high win & ITM — reliable performers.
Place Threats (top-left): boards often but doesn’t win often — good exacta/trifecta angles.
Streaky (bottom-right): wins occasionally, misses the board often — all-or-nothing.
Developing (bottom-left): still finding form — longshot territory. - Reference Lines
- Dashed lines mark field averages. Dots to the right win more; dots higher board more.
- This horse
- Highlighted with a gold border and larger dot.
AI Model Comparison
- Winner Models (green)
- Mod1(W), Mod2(W), and Mod3(W) trained to predict race winners. Higher score = stronger contender.
- Longshot Models (red)
- Mod1-LS, Mod2-LS, and Mod3-LS trained to find high-value longshots. Higher score = stronger longshot candidate.
- Form Model (blue)
- Mod4 sequence model trained on recent form patterns. Higher score = stronger recent form profile.
- This horse
- Highlighted with a darker column background.
Race Pace Simulation Guide
- Slider
- Drag left→right to advance from gate to finish. Drag all the way back to reset the race.
- Predicted Finish Order
- Factors in contested pace burn, each horse’s effort curve (peaked-early vs. peaked-late), and wide trip cost from outside posts. Updated live when Track Bias changes.
- Pace Scenario
- Lone Speed: single E horse likely rates and holds. Contested: two E horses burn each other — closers benefit. Hot Pace: speed meltdown, deep closers thrive. Soft: no early speed, moderate fractions throughout.
- Track Bias
- Slider below canvas. −2 = strong closer/wet bias; +2 = strong speed/rail bias. Recomputes the predicted finish order.
- Boxed Indicator
- Dashed orange ring = horse is surrounded (rival ahead, rival behind, wall outside). In a real race this horse must find a clear path to run.
- Running Styles
- E/EE = early speed (rushes to rail). P = presser (stalks the pace). S = stalker. SS = slow starter / closer.
| Stat | vs. Current Card | vs. All Horses |
|---|---|---|
| Averages
Career-average metrics across all AI race analysis. Performance and pace averages reflect estimated historical performance; trainer and jockey grades score in-the-money percentages. Grading scale: A = elite • B = above average • C = average • D = below average • F = poor • — = no data |
||
| Pick Pony AI Rating | C | C |
| Pace Trip Longshot | — | — |
| Connections Longshot | — | — |
| Situational Longshot | — | — |
| Speed | B | B |
| Early Pace | B | C |
| Mid Pace | C | C |
| Late Pace | A | A |
| Finish Pos | C | D |
| Dirt Speed | B | A |
| Turf Speed | D | D |
| Distance Speed | F | B |
| Trainer Effectiveness | A | B |
| Jockey Effectiveness | D | D |
| 3rd Party Ratings | A | A |
| Recent
Performance analysis from the horse's recent races, weighted to reflect current form. Sprint and Route FPS (Foot Per Second) measure pace efficiency over the horse's recent sprints and routes respectively. Grading scale: A = elite • B = above average • C = average • D = below average • F = poor • — = no data |
||
| Speed | A | A |
| Early Pace | B | A |
| Mid Pace | A | A |
| Late Pace | B | A |
| Sprint FPS | B | C |
| Route FPS | C | C |
| Trainer Effectiveness | A | B |
| Jockey Effectiveness | D | D |
| 3rd Party Ratings | A | A |
| Predictions
AI-generated projections for the upcoming race, derived from prior AI analysis for speed and pace trends, surface and distance suitability, and current conditions. Grading scale: A = elite • B = above average • C = average • D = below average • F = poor • — = no data |
||
| Speed | B | B |
| Early Pace | B | B |
| Mid Pace | C | B |
| Late Pace | C | C |
Chart Guide (2.0.36)
- Bubbles
- Color = surface: green (turf), brown (dirt), blue (synthetic)
- Top number = finishing position; bottom number in parentheses = starting post position
- Height above line = beaten lengths — closer means a smaller margin
- Border = track conditions: green (FST/GD/FM), yellow (WF/SL/YLD), red (SY/MY/FRZ/SFT/HVY)
- Connecting Line
- Solid = good conditions; dashed = bad conditions
- Line Symbol
- ▲ Triangle = sprint (7f or less); ● Circle = route (more than 7f)
- Days Between Races
- Small number above each bubble (e.g. 19d) = days since the previous race — helps spot freshness, layoffs, and tight scheduling.
- Shaded Band (Bollinger)
- Highlights volatility — a wider band means more variation in recent performance
- Performance Trend
- Straight line showing the overall performance direction — angled up = improving, angled down = declining
- Dashed Reference Line
- AI Opponent = AI analysis class-level par for the race
AI Model History Guide
- Lines
- Each solid line shows this horse’s model score over its last 10 races: blue = Mod1, green = Mod2, amber = Mod3.
- Dashed Lines
- Dashed lines represent the current race’s field average for each model — a score below the dashed line indicates the horse ranked below average in this model’s assessment.
- Higher is Stronger
- All three model scores are 0–100: a higher number means the model rates this horse more favorably among the field.
Mod1(W): 82 (1/8) Mod2(W): 75 (2/8) Mod3(W): 79 (3/8) Mod1-LS: 55 (6/8) Win Prob: 18.4% Value Score: 1.35 ★
Performance vs. Peers Guide
- Bars (per post)
- Blue = avg career performance • Amber = avg last 3 races • Green = last race (improved vs. avg) • Red = last race (declined vs. avg)
- Trend Line
- Angled line above the bars: rising = improving form • falling = declining form.
- Horizontal Line
- Field average — the mean career performance of all horses in this race.
- Color Circles
- Standard post-position colors below each lane — same as the Total Pace chart.
- Border
- Thicker border = this horse’s post position.
Figure Comparison
- Rating
- The three Pick Pony algorithm ratings (Algo 1, Algo 2, Algo 3) that make up the overall PP AI Rating — higher is a stronger contender rating.
- Speed
- Career average speed, recent 3-race average, and last-race speed figure — spot horses in improving or declining form.
- Pace
- Average Early (E1), Mid (E2), and Stretch (LP) pace figures — reveals pace-setters vs. closers vs. all-the-way types.
- This horse
- The horse whose stats card is open is highlighted with a darker column background.
Winning Profiles
- Axes
- X: Win % from last 10 starts — Y: In-the-money % (top-3 finishes) from last 10 starts.
- Quadrants
- Consistent Winners (top-right): high win & ITM — reliable performers.
Place Threats (top-left): boards often but doesn’t win often — good exacta/trifecta angles.
Streaky (bottom-right): wins occasionally, misses the board often — all-or-nothing.
Developing (bottom-left): still finding form — longshot territory. - Reference Lines
- Dashed lines mark field averages. Dots to the right win more; dots higher board more.
- This horse
- Highlighted with a gold border and larger dot.
AI Model Comparison
- Winner Models (green)
- Mod1(W), Mod2(W), and Mod3(W) trained to predict race winners. Higher score = stronger contender.
- Longshot Models (red)
- Mod1-LS, Mod2-LS, and Mod3-LS trained to find high-value longshots. Higher score = stronger longshot candidate.
- Form Model (blue)
- Mod4 sequence model trained on recent form patterns. Higher score = stronger recent form profile.
- This horse
- Highlighted with a darker column background.
Race Pace Simulation Guide
- Slider
- Drag left→right to advance from gate to finish. Drag all the way back to reset the race.
- Predicted Finish Order
- Factors in contested pace burn, each horse’s effort curve (peaked-early vs. peaked-late), and wide trip cost from outside posts. Updated live when Track Bias changes.
- Pace Scenario
- Lone Speed: single E horse likely rates and holds. Contested: two E horses burn each other — closers benefit. Hot Pace: speed meltdown, deep closers thrive. Soft: no early speed, moderate fractions throughout.
- Track Bias
- Slider below canvas. −2 = strong closer/wet bias; +2 = strong speed/rail bias. Recomputes the predicted finish order.
- Boxed Indicator
- Dashed orange ring = horse is surrounded (rival ahead, rival behind, wall outside). In a real race this horse must find a clear path to run.
- Running Styles
- E/EE = early speed (rushes to rail). P = presser (stalks the pace). S = stalker. SS = slow starter / closer.
| Stat | vs. Current Card | vs. All Horses |
|---|---|---|
| Averages
Career-average metrics across all AI race analysis. Performance and pace averages reflect estimated historical performance; trainer and jockey grades score in-the-money percentages. Grading scale: A = elite • B = above average • C = average • D = below average • F = poor • — = no data |
||
| Pick Pony AI Rating | B | B |
| Pace Trip Longshot | — | — |
| Connections Longshot | — | — |
| Situational Longshot | — | — |
| Speed | C | B |
| Early Pace | A | A |
| Mid Pace | A | B |
| Late Pace | C | A |
| Finish Pos | B | C |
| Dirt Speed | F | B |
| Turf Speed | B | B |
| Distance Speed | A | A |
| Trainer Effectiveness | C | C |
| Jockey Effectiveness | A | A |
| 3rd Party Ratings | C | B |
| Recent
Performance analysis from the horse's recent races, weighted to reflect current form. Sprint and Route FPS (Foot Per Second) measure pace efficiency over the horse's recent sprints and routes respectively. Grading scale: A = elite • B = above average • C = average • D = below average • F = poor • — = no data |
||
| Speed | D | B |
| Early Pace | A | A |
| Mid Pace | C | B |
| Late Pace | C | A |
| Sprint FPS | A | A |
| Route FPS | C | C |
| Trainer Effectiveness | C | C |
| Jockey Effectiveness | A | A |
| 3rd Party Ratings | C | B |
| Predictions
AI-generated projections for the upcoming race, derived from prior AI analysis for speed and pace trends, surface and distance suitability, and current conditions. Grading scale: A = elite • B = above average • C = average • D = below average • F = poor • — = no data |
||
| Speed | C | B |
| Early Pace | A | A |
| Mid Pace | A | B |
| Late Pace | C | C |
Chart Guide (2.0.36)
- Bubbles
- Color = surface: green (turf), brown (dirt), blue (synthetic)
- Top number = finishing position; bottom number in parentheses = starting post position
- Height above line = beaten lengths — closer means a smaller margin
- Border = track conditions: green (FST/GD/FM), yellow (WF/SL/YLD), red (SY/MY/FRZ/SFT/HVY)
- Connecting Line
- Solid = good conditions; dashed = bad conditions
- Line Symbol
- ▲ Triangle = sprint (7f or less); ● Circle = route (more than 7f)
- Days Between Races
- Small number above each bubble (e.g. 19d) = days since the previous race — helps spot freshness, layoffs, and tight scheduling.
- Shaded Band (Bollinger)
- Highlights volatility — a wider band means more variation in recent performance
- Performance Trend
- Straight line showing the overall performance direction — angled up = improving, angled down = declining
- Dashed Reference Line
- AI Opponent = AI analysis class-level par for the race
AI Model History Guide
- Lines
- Each solid line shows this horse’s model score over its last 10 races: blue = Mod1, green = Mod2, amber = Mod3.
- Dashed Lines
- Dashed lines represent the current race’s field average for each model — a score below the dashed line indicates the horse ranked below average in this model’s assessment.
- Higher is Stronger
- All three model scores are 0–100: a higher number means the model rates this horse more favorably among the field.
Mod1(W): 82 (1/8) Mod2(W): 75 (2/8) Mod3(W): 79 (3/8) Mod1-LS: 55 (6/8) Win Prob: 18.4% Value Score: 1.35 ★
Performance vs. Peers Guide
- Bars (per post)
- Blue = avg career performance • Amber = avg last 3 races • Green = last race (improved vs. avg) • Red = last race (declined vs. avg)
- Trend Line
- Angled line above the bars: rising = improving form • falling = declining form.
- Horizontal Line
- Field average — the mean career performance of all horses in this race.
- Color Circles
- Standard post-position colors below each lane — same as the Total Pace chart.
- Border
- Thicker border = this horse’s post position.
Figure Comparison
- Rating
- The three Pick Pony algorithm ratings (Algo 1, Algo 2, Algo 3) that make up the overall PP AI Rating — higher is a stronger contender rating.
- Speed
- Career average speed, recent 3-race average, and last-race speed figure — spot horses in improving or declining form.
- Pace
- Average Early (E1), Mid (E2), and Stretch (LP) pace figures — reveals pace-setters vs. closers vs. all-the-way types.
- This horse
- The horse whose stats card is open is highlighted with a darker column background.
Winning Profiles
- Axes
- X: Win % from last 10 starts — Y: In-the-money % (top-3 finishes) from last 10 starts.
- Quadrants
- Consistent Winners (top-right): high win & ITM — reliable performers.
Place Threats (top-left): boards often but doesn’t win often — good exacta/trifecta angles.
Streaky (bottom-right): wins occasionally, misses the board often — all-or-nothing.
Developing (bottom-left): still finding form — longshot territory. - Reference Lines
- Dashed lines mark field averages. Dots to the right win more; dots higher board more.
- This horse
- Highlighted with a gold border and larger dot.
AI Model Comparison
- Winner Models (green)
- Mod1(W), Mod2(W), and Mod3(W) trained to predict race winners. Higher score = stronger contender.
- Longshot Models (red)
- Mod1-LS, Mod2-LS, and Mod3-LS trained to find high-value longshots. Higher score = stronger longshot candidate.
- Form Model (blue)
- Mod4 sequence model trained on recent form patterns. Higher score = stronger recent form profile.
- This horse
- Highlighted with a darker column background.
Race Pace Simulation Guide
- Slider
- Drag left→right to advance from gate to finish. Drag all the way back to reset the race.
- Predicted Finish Order
- Factors in contested pace burn, each horse’s effort curve (peaked-early vs. peaked-late), and wide trip cost from outside posts. Updated live when Track Bias changes.
- Pace Scenario
- Lone Speed: single E horse likely rates and holds. Contested: two E horses burn each other — closers benefit. Hot Pace: speed meltdown, deep closers thrive. Soft: no early speed, moderate fractions throughout.
- Track Bias
- Slider below canvas. −2 = strong closer/wet bias; +2 = strong speed/rail bias. Recomputes the predicted finish order.
- Boxed Indicator
- Dashed orange ring = horse is surrounded (rival ahead, rival behind, wall outside). In a real race this horse must find a clear path to run.
- Running Styles
- E/EE = early speed (rushes to rail). P = presser (stalks the pace). S = stalker. SS = slow starter / closer.
| Stat | vs. Current Card | vs. All Horses |
|---|---|---|
| Averages
Career-average metrics across all AI race analysis. Performance and pace averages reflect estimated historical performance; trainer and jockey grades score in-the-money percentages. Grading scale: A = elite • B = above average • C = average • D = below average • F = poor • — = no data |
||
| Pick Pony AI Rating | A | B |
| Pace Trip Longshot | — | — |
| Connections Longshot | — | — |
| Situational Longshot | — | — |
| Speed | D | B |
| Early Pace | D | D |
| Mid Pace | F | D |
| Late Pace | C | B |
| Finish Pos | F | F |
| Dirt Speed | A | A |
| Turf Speed | C | B |
| Distance Speed | A | A |
| Trainer Effectiveness | A | A |
| Jockey Effectiveness | A | B |
| 3rd Party Ratings | D | B |
| Recent
Performance analysis from the horse's recent races, weighted to reflect current form. Sprint and Route FPS (Foot Per Second) measure pace efficiency over the horse's recent sprints and routes respectively. Grading scale: A = elite • B = above average • C = average • D = below average • F = poor • — = no data |
||
| Speed | C | B |
| Early Pace | F | F |
| Mid Pace | F | D |
| Late Pace | A | A |
| Sprint FPS | F | D |
| Route FPS | D | D |
| Trainer Effectiveness | A | A |
| Jockey Effectiveness | A | B |
| 3rd Party Ratings | D | B |
| Predictions
AI-generated projections for the upcoming race, derived from prior AI analysis for speed and pace trends, surface and distance suitability, and current conditions. Grading scale: A = elite • B = above average • C = average • D = below average • F = poor • — = no data |
||
| Speed | D | B |
| Early Pace | D | D |
| Mid Pace | D | C |
| Late Pace | C | C |
Chart Guide (2.0.36)
- Bubbles
- Color = surface: green (turf), brown (dirt), blue (synthetic)
- Top number = finishing position; bottom number in parentheses = starting post position
- Height above line = beaten lengths — closer means a smaller margin
- Border = track conditions: green (FST/GD/FM), yellow (WF/SL/YLD), red (SY/MY/FRZ/SFT/HVY)
- Connecting Line
- Solid = good conditions; dashed = bad conditions
- Line Symbol
- ▲ Triangle = sprint (7f or less); ● Circle = route (more than 7f)
- Days Between Races
- Small number above each bubble (e.g. 19d) = days since the previous race — helps spot freshness, layoffs, and tight scheduling.
- Shaded Band (Bollinger)
- Highlights volatility — a wider band means more variation in recent performance
- Performance Trend
- Straight line showing the overall performance direction — angled up = improving, angled down = declining
- Dashed Reference Line
- AI Opponent = AI analysis class-level par for the race
AI Model History Guide
- Lines
- Each solid line shows this horse’s model score over its last 10 races: blue = Mod1, green = Mod2, amber = Mod3.
- Dashed Lines
- Dashed lines represent the current race’s field average for each model — a score below the dashed line indicates the horse ranked below average in this model’s assessment.
- Higher is Stronger
- All three model scores are 0–100: a higher number means the model rates this horse more favorably among the field.
Mod1(W): 82 (1/8) Mod2(W): 75 (2/8) Mod3(W): 79 (3/8) Mod1-LS: 55 (6/8) Win Prob: 18.4% Value Score: 1.35 ★
Performance vs. Peers Guide
- Bars (per post)
- Blue = avg career performance • Amber = avg last 3 races • Green = last race (improved vs. avg) • Red = last race (declined vs. avg)
- Trend Line
- Angled line above the bars: rising = improving form • falling = declining form.
- Horizontal Line
- Field average — the mean career performance of all horses in this race.
- Color Circles
- Standard post-position colors below each lane — same as the Total Pace chart.
- Border
- Thicker border = this horse’s post position.
Figure Comparison
- Rating
- The three Pick Pony algorithm ratings (Algo 1, Algo 2, Algo 3) that make up the overall PP AI Rating — higher is a stronger contender rating.
- Speed
- Career average speed, recent 3-race average, and last-race speed figure — spot horses in improving or declining form.
- Pace
- Average Early (E1), Mid (E2), and Stretch (LP) pace figures — reveals pace-setters vs. closers vs. all-the-way types.
- This horse
- The horse whose stats card is open is highlighted with a darker column background.
Winning Profiles
- Axes
- X: Win % from last 10 starts — Y: In-the-money % (top-3 finishes) from last 10 starts.
- Quadrants
- Consistent Winners (top-right): high win & ITM — reliable performers.
Place Threats (top-left): boards often but doesn’t win often — good exacta/trifecta angles.
Streaky (bottom-right): wins occasionally, misses the board often — all-or-nothing.
Developing (bottom-left): still finding form — longshot territory. - Reference Lines
- Dashed lines mark field averages. Dots to the right win more; dots higher board more.
- This horse
- Highlighted with a gold border and larger dot.
AI Model Comparison
- Winner Models (green)
- Mod1(W), Mod2(W), and Mod3(W) trained to predict race winners. Higher score = stronger contender.
- Longshot Models (red)
- Mod1-LS, Mod2-LS, and Mod3-LS trained to find high-value longshots. Higher score = stronger longshot candidate.
- Form Model (blue)
- Mod4 sequence model trained on recent form patterns. Higher score = stronger recent form profile.
- This horse
- Highlighted with a darker column background.
Race Pace Simulation Guide
- Slider
- Drag left→right to advance from gate to finish. Drag all the way back to reset the race.
- Predicted Finish Order
- Factors in contested pace burn, each horse’s effort curve (peaked-early vs. peaked-late), and wide trip cost from outside posts. Updated live when Track Bias changes.
- Pace Scenario
- Lone Speed: single E horse likely rates and holds. Contested: two E horses burn each other — closers benefit. Hot Pace: speed meltdown, deep closers thrive. Soft: no early speed, moderate fractions throughout.
- Track Bias
- Slider below canvas. −2 = strong closer/wet bias; +2 = strong speed/rail bias. Recomputes the predicted finish order.
- Boxed Indicator
- Dashed orange ring = horse is surrounded (rival ahead, rival behind, wall outside). In a real race this horse must find a clear path to run.
- Running Styles
- E/EE = early speed (rushes to rail). P = presser (stalks the pace). S = stalker. SS = slow starter / closer.
| Stat | vs. Current Card | vs. All Horses |
|---|---|---|
| Averages
Career-average metrics across all AI race analysis. Performance and pace averages reflect estimated historical performance; trainer and jockey grades score in-the-money percentages. Grading scale: A = elite • B = above average • C = average • D = below average • F = poor • — = no data |
||
| Pick Pony AI Rating | C | C |
| Pace Trip Longshot | — | — |
| Connections Longshot | — | — |
| Situational Longshot | — | — |
| Speed | C | D |
| Early Pace | B | A |
| Mid Pace | C | B |
| Late Pace | C | D |
| Finish Pos | F | F |
| Dirt Speed | C | C |
| Turf Speed | C | D |
| Distance Speed | D | F |
| Trainer Effectiveness | A | A |
| Jockey Effectiveness | A | A |
| 3rd Party Ratings | A | B |
| Recent
Performance analysis from the horse's recent races, weighted to reflect current form. Sprint and Route FPS (Foot Per Second) measure pace efficiency over the horse's recent sprints and routes respectively. Grading scale: A = elite • B = above average • C = average • D = below average • F = poor • — = no data |
||
| Speed | C | D |
| Early Pace | C | B |
| Mid Pace | B | B |
| Late Pace | C | D |
| Sprint FPS | A | B |
| Route FPS | C | C |
| Trainer Effectiveness | A | A |
| Jockey Effectiveness | A | A |
| 3rd Party Ratings | A | B |
| Predictions
AI-generated projections for the upcoming race, derived from prior AI analysis for speed and pace trends, surface and distance suitability, and current conditions. Grading scale: A = elite • B = above average • C = average • D = below average • F = poor • — = no data |
||
| Speed | C | D |
| Early Pace | D | F |
| Mid Pace | D | F |
| Late Pace | C | C |
Chart Guide (2.0.36)
- Bubbles
- Color = surface: green (turf), brown (dirt), blue (synthetic)
- Top number = finishing position; bottom number in parentheses = starting post position
- Height above line = beaten lengths — closer means a smaller margin
- Border = track conditions: green (FST/GD/FM), yellow (WF/SL/YLD), red (SY/MY/FRZ/SFT/HVY)
- Connecting Line
- Solid = good conditions; dashed = bad conditions
- Line Symbol
- ▲ Triangle = sprint (7f or less); ● Circle = route (more than 7f)
- Days Between Races
- Small number above each bubble (e.g. 19d) = days since the previous race — helps spot freshness, layoffs, and tight scheduling.
- Shaded Band (Bollinger)
- Highlights volatility — a wider band means more variation in recent performance
- Performance Trend
- Straight line showing the overall performance direction — angled up = improving, angled down = declining
- Dashed Reference Line
- AI Opponent = AI analysis class-level par for the race
AI Model History Guide
- Lines
- Each solid line shows this horse’s model score over its last 10 races: blue = Mod1, green = Mod2, amber = Mod3.
- Dashed Lines
- Dashed lines represent the current race’s field average for each model — a score below the dashed line indicates the horse ranked below average in this model’s assessment.
- Higher is Stronger
- All three model scores are 0–100: a higher number means the model rates this horse more favorably among the field.
Mod1(W): 82 (1/8) Mod2(W): 75 (2/8) Mod3(W): 79 (3/8) Mod1-LS: 55 (6/8) Win Prob: 18.4% Value Score: 1.35 ★
Performance vs. Peers Guide
- Bars (per post)
- Blue = avg career performance • Amber = avg last 3 races • Green = last race (improved vs. avg) • Red = last race (declined vs. avg)
- Trend Line
- Angled line above the bars: rising = improving form • falling = declining form.
- Horizontal Line
- Field average — the mean career performance of all horses in this race.
- Color Circles
- Standard post-position colors below each lane — same as the Total Pace chart.
- Border
- Thicker border = this horse’s post position.
Figure Comparison
- Rating
- The three Pick Pony algorithm ratings (Algo 1, Algo 2, Algo 3) that make up the overall PP AI Rating — higher is a stronger contender rating.
- Speed
- Career average speed, recent 3-race average, and last-race speed figure — spot horses in improving or declining form.
- Pace
- Average Early (E1), Mid (E2), and Stretch (LP) pace figures — reveals pace-setters vs. closers vs. all-the-way types.
- This horse
- The horse whose stats card is open is highlighted with a darker column background.
Winning Profiles
- Axes
- X: Win % from last 10 starts — Y: In-the-money % (top-3 finishes) from last 10 starts.
- Quadrants
- Consistent Winners (top-right): high win & ITM — reliable performers.
Place Threats (top-left): boards often but doesn’t win often — good exacta/trifecta angles.
Streaky (bottom-right): wins occasionally, misses the board often — all-or-nothing.
Developing (bottom-left): still finding form — longshot territory. - Reference Lines
- Dashed lines mark field averages. Dots to the right win more; dots higher board more.
- This horse
- Highlighted with a gold border and larger dot.
AI Model Comparison
- Winner Models (green)
- Mod1(W), Mod2(W), and Mod3(W) trained to predict race winners. Higher score = stronger contender.
- Longshot Models (red)
- Mod1-LS, Mod2-LS, and Mod3-LS trained to find high-value longshots. Higher score = stronger longshot candidate.
- Form Model (blue)
- Mod4 sequence model trained on recent form patterns. Higher score = stronger recent form profile.
- This horse
- Highlighted with a darker column background.
Race Pace Simulation Guide
- Slider
- Drag left→right to advance from gate to finish. Drag all the way back to reset the race.
- Predicted Finish Order
- Factors in contested pace burn, each horse’s effort curve (peaked-early vs. peaked-late), and wide trip cost from outside posts. Updated live when Track Bias changes.
- Pace Scenario
- Lone Speed: single E horse likely rates and holds. Contested: two E horses burn each other — closers benefit. Hot Pace: speed meltdown, deep closers thrive. Soft: no early speed, moderate fractions throughout.
- Track Bias
- Slider below canvas. −2 = strong closer/wet bias; +2 = strong speed/rail bias. Recomputes the predicted finish order.
- Boxed Indicator
- Dashed orange ring = horse is surrounded (rival ahead, rival behind, wall outside). In a real race this horse must find a clear path to run.
- Running Styles
- E/EE = early speed (rushes to rail). P = presser (stalks the pace). S = stalker. SS = slow starter / closer.
| Stat | vs. Current Card | vs. All Horses |
|---|---|---|
| Averages
Career-average metrics across all AI race analysis. Performance and pace averages reflect estimated historical performance; trainer and jockey grades score in-the-money percentages. Grading scale: A = elite • B = above average • C = average • D = below average • F = poor • — = no data |
||
| Pick Pony AI Rating | A | A |
| Pace Trip Longshot | — | — |
| Connections Longshot | — | — |
| Situational Longshot | — | — |
| Speed | A | C |
| Early Pace | B | A |
| Mid Pace | A | A |
| Late Pace | B | C |
| Finish Pos | B | A |
| Dirt Speed | B | C |
| Turf Speed | C | D |
| Distance Speed | A | B |
| Trainer Effectiveness | A | A |
| Jockey Effectiveness | A | A |
| 3rd Party Ratings | A | A |
| Recent
Performance analysis from the horse's recent races, weighted to reflect current form. Sprint and Route FPS (Foot Per Second) measure pace efficiency over the horse's recent sprints and routes respectively. Grading scale: A = elite • B = above average • C = average • D = below average • F = poor • — = no data |
||
| Speed | A | C |
| Early Pace | C | B |
| Mid Pace | A | A |
| Late Pace | A | C |
| Sprint FPS | B | C |
| Route FPS | A | B |
| Trainer Effectiveness | A | A |
| Jockey Effectiveness | A | A |
| 3rd Party Ratings | A | A |
| Predictions
AI-generated projections for the upcoming race, derived from prior AI analysis for speed and pace trends, surface and distance suitability, and current conditions. Grading scale: A = elite • B = above average • C = average • D = below average • F = poor • — = no data |
||
| Speed | A | C |
| Early Pace | A | A |
| Mid Pace | A | A |
| Late Pace | C | C |
Chart Guide (2.0.36)
- Bubbles
- Color = surface: green (turf), brown (dirt), blue (synthetic)
- Top number = finishing position; bottom number in parentheses = starting post position
- Height above line = beaten lengths — closer means a smaller margin
- Border = track conditions: green (FST/GD/FM), yellow (WF/SL/YLD), red (SY/MY/FRZ/SFT/HVY)
- Connecting Line
- Solid = good conditions; dashed = bad conditions
- Line Symbol
- ▲ Triangle = sprint (7f or less); ● Circle = route (more than 7f)
- Days Between Races
- Small number above each bubble (e.g. 19d) = days since the previous race — helps spot freshness, layoffs, and tight scheduling.
- Shaded Band (Bollinger)
- Highlights volatility — a wider band means more variation in recent performance
- Performance Trend
- Straight line showing the overall performance direction — angled up = improving, angled down = declining
- Dashed Reference Line
- AI Opponent = AI analysis class-level par for the race
AI Model History Guide
- Lines
- Each solid line shows this horse’s model score over its last 10 races: blue = Mod1, green = Mod2, amber = Mod3.
- Dashed Lines
- Dashed lines represent the current race’s field average for each model — a score below the dashed line indicates the horse ranked below average in this model’s assessment.
- Higher is Stronger
- All three model scores are 0–100: a higher number means the model rates this horse more favorably among the field.
Mod1(W): 82 (1/8) Mod2(W): 75 (2/8) Mod3(W): 79 (3/8) Mod1-LS: 55 (6/8) Win Prob: 18.4% Value Score: 1.35 ★
Performance vs. Peers Guide
- Bars (per post)
- Blue = avg career performance • Amber = avg last 3 races • Green = last race (improved vs. avg) • Red = last race (declined vs. avg)
- Trend Line
- Angled line above the bars: rising = improving form • falling = declining form.
- Horizontal Line
- Field average — the mean career performance of all horses in this race.
- Color Circles
- Standard post-position colors below each lane — same as the Total Pace chart.
- Border
- Thicker border = this horse’s post position.
Figure Comparison
- Rating
- The three Pick Pony algorithm ratings (Algo 1, Algo 2, Algo 3) that make up the overall PP AI Rating — higher is a stronger contender rating.
- Speed
- Career average speed, recent 3-race average, and last-race speed figure — spot horses in improving or declining form.
- Pace
- Average Early (E1), Mid (E2), and Stretch (LP) pace figures — reveals pace-setters vs. closers vs. all-the-way types.
- This horse
- The horse whose stats card is open is highlighted with a darker column background.
Winning Profiles
- Axes
- X: Win % from last 10 starts — Y: In-the-money % (top-3 finishes) from last 10 starts.
- Quadrants
- Consistent Winners (top-right): high win & ITM — reliable performers.
Place Threats (top-left): boards often but doesn’t win often — good exacta/trifecta angles.
Streaky (bottom-right): wins occasionally, misses the board often — all-or-nothing.
Developing (bottom-left): still finding form — longshot territory. - Reference Lines
- Dashed lines mark field averages. Dots to the right win more; dots higher board more.
- This horse
- Highlighted with a gold border and larger dot.
AI Model Comparison
- Winner Models (green)
- Mod1(W), Mod2(W), and Mod3(W) trained to predict race winners. Higher score = stronger contender.
- Longshot Models (red)
- Mod1-LS, Mod2-LS, and Mod3-LS trained to find high-value longshots. Higher score = stronger longshot candidate.
- Form Model (blue)
- Mod4 sequence model trained on recent form patterns. Higher score = stronger recent form profile.
- This horse
- Highlighted with a darker column background.
Race Pace Simulation Guide
- Slider
- Drag left→right to advance from gate to finish. Drag all the way back to reset the race.
- Predicted Finish Order
- Factors in contested pace burn, each horse’s effort curve (peaked-early vs. peaked-late), and wide trip cost from outside posts. Updated live when Track Bias changes.
- Pace Scenario
- Lone Speed: single E horse likely rates and holds. Contested: two E horses burn each other — closers benefit. Hot Pace: speed meltdown, deep closers thrive. Soft: no early speed, moderate fractions throughout.
- Track Bias
- Slider below canvas. −2 = strong closer/wet bias; +2 = strong speed/rail bias. Recomputes the predicted finish order.
- Boxed Indicator
- Dashed orange ring = horse is surrounded (rival ahead, rival behind, wall outside). In a real race this horse must find a clear path to run.
- Running Styles
- E/EE = early speed (rushes to rail). P = presser (stalks the pace). S = stalker. SS = slow starter / closer.
| Stat | vs. Current Card | vs. All Horses |
|---|---|---|
| Averages
Career-average metrics across all AI race analysis. Performance and pace averages reflect estimated historical performance; trainer and jockey grades score in-the-money percentages. Grading scale: A = elite • B = above average • C = average • D = below average • F = poor • — = no data |
||
| Pick Pony AI Rating | A | B |
| Pace Trip Longshot | — | — |
| Connections Longshot | — | — |
| Situational Longshot | — | — |
| Speed | B | C |
| Early Pace | C | B |
| Mid Pace | C | B |
| Late Pace | A | B |
| Finish Pos | B | A |
| Dirt Speed | A | C |
| Turf Speed | A | B |
| Distance Speed | B | C |
| Trainer Effectiveness | D | D |
| Jockey Effectiveness | B | B |
| 3rd Party Ratings | C | C |
| Recent
Performance analysis from the horse's recent races, weighted to reflect current form. Sprint and Route FPS (Foot Per Second) measure pace efficiency over the horse's recent sprints and routes respectively. Grading scale: A = elite • B = above average • C = average • D = below average • F = poor • — = no data |
||
| Speed | B | C |
| Early Pace | C | B |
| Mid Pace | C | B |
| Late Pace | A | B |
| Sprint FPS | C | C |
| Route FPS | B | C |
| Trainer Effectiveness | D | D |
| Jockey Effectiveness | B | B |
| 3rd Party Ratings | C | C |
| Predictions
AI-generated projections for the upcoming race, derived from prior AI analysis for speed and pace trends, surface and distance suitability, and current conditions. Grading scale: A = elite • B = above average • C = average • D = below average • F = poor • — = no data |
||
| Speed | C | C |
| Early Pace | B | B |
| Mid Pace | B | B |
| Late Pace | C | C |
Chart Guide (2.0.36)
- Bubbles
- Color = surface: green (turf), brown (dirt), blue (synthetic)
- Top number = finishing position; bottom number in parentheses = starting post position
- Height above line = beaten lengths — closer means a smaller margin
- Border = track conditions: green (FST/GD/FM), yellow (WF/SL/YLD), red (SY/MY/FRZ/SFT/HVY)
- Connecting Line
- Solid = good conditions; dashed = bad conditions
- Line Symbol
- ▲ Triangle = sprint (7f or less); ● Circle = route (more than 7f)
- Days Between Races
- Small number above each bubble (e.g. 19d) = days since the previous race — helps spot freshness, layoffs, and tight scheduling.
- Shaded Band (Bollinger)
- Highlights volatility — a wider band means more variation in recent performance
- Performance Trend
- Straight line showing the overall performance direction — angled up = improving, angled down = declining
- Dashed Reference Line
- AI Opponent = AI analysis class-level par for the race
AI Model History Guide
- Lines
- Each solid line shows this horse’s model score over its last 10 races: blue = Mod1, green = Mod2, amber = Mod3.
- Dashed Lines
- Dashed lines represent the current race’s field average for each model — a score below the dashed line indicates the horse ranked below average in this model’s assessment.
- Higher is Stronger
- All three model scores are 0–100: a higher number means the model rates this horse more favorably among the field.
Mod1(W): 82 (1/8) Mod2(W): 75 (2/8) Mod3(W): 79 (3/8) Mod1-LS: 55 (6/8) Win Prob: 18.4% Value Score: 1.35 ★
Performance vs. Peers Guide
- Bars (per post)
- Blue = avg career performance • Amber = avg last 3 races • Green = last race (improved vs. avg) • Red = last race (declined vs. avg)
- Trend Line
- Angled line above the bars: rising = improving form • falling = declining form.
- Horizontal Line
- Field average — the mean career performance of all horses in this race.
- Color Circles
- Standard post-position colors below each lane — same as the Total Pace chart.
- Border
- Thicker border = this horse’s post position.
Figure Comparison
- Rating
- The three Pick Pony algorithm ratings (Algo 1, Algo 2, Algo 3) that make up the overall PP AI Rating — higher is a stronger contender rating.
- Speed
- Career average speed, recent 3-race average, and last-race speed figure — spot horses in improving or declining form.
- Pace
- Average Early (E1), Mid (E2), and Stretch (LP) pace figures — reveals pace-setters vs. closers vs. all-the-way types.
- This horse
- The horse whose stats card is open is highlighted with a darker column background.
Winning Profiles
- Axes
- X: Win % from last 10 starts — Y: In-the-money % (top-3 finishes) from last 10 starts.
- Quadrants
- Consistent Winners (top-right): high win & ITM — reliable performers.
Place Threats (top-left): boards often but doesn’t win often — good exacta/trifecta angles.
Streaky (bottom-right): wins occasionally, misses the board often — all-or-nothing.
Developing (bottom-left): still finding form — longshot territory. - Reference Lines
- Dashed lines mark field averages. Dots to the right win more; dots higher board more.
- This horse
- Highlighted with a gold border and larger dot.
AI Model Comparison
- Winner Models (green)
- Mod1(W), Mod2(W), and Mod3(W) trained to predict race winners. Higher score = stronger contender.
- Longshot Models (red)
- Mod1-LS, Mod2-LS, and Mod3-LS trained to find high-value longshots. Higher score = stronger longshot candidate.
- Form Model (blue)
- Mod4 sequence model trained on recent form patterns. Higher score = stronger recent form profile.
- This horse
- Highlighted with a darker column background.
Race Pace Simulation Guide
- Slider
- Drag left→right to advance from gate to finish. Drag all the way back to reset the race.
- Predicted Finish Order
- Factors in contested pace burn, each horse’s effort curve (peaked-early vs. peaked-late), and wide trip cost from outside posts. Updated live when Track Bias changes.
- Pace Scenario
- Lone Speed: single E horse likely rates and holds. Contested: two E horses burn each other — closers benefit. Hot Pace: speed meltdown, deep closers thrive. Soft: no early speed, moderate fractions throughout.
- Track Bias
- Slider below canvas. −2 = strong closer/wet bias; +2 = strong speed/rail bias. Recomputes the predicted finish order.
- Boxed Indicator
- Dashed orange ring = horse is surrounded (rival ahead, rival behind, wall outside). In a real race this horse must find a clear path to run.
- Running Styles
- E/EE = early speed (rushes to rail). P = presser (stalks the pace). S = stalker. SS = slow starter / closer.
| Stat | vs. Current Card | vs. All Horses |
|---|---|---|
| Averages
Career-average metrics across all AI race analysis. Performance and pace averages reflect estimated historical performance; trainer and jockey grades score in-the-money percentages. Grading scale: A = elite • B = above average • C = average • D = below average • F = poor • — = no data |
||
| Pick Pony AI Rating | A | B |
| Pace Trip Longshot | — | — |
| Connections Longshot | — | — |
| Situational Longshot | — | — |
| Speed | A | A |
| Early Pace | A | A |
| Mid Pace | A | A |
| Late Pace | A | B |
| Finish Pos | A | A |
| Dirt Speed | A | A |
| Turf Speed | C | D |
| Distance Speed | A | A |
| Trainer Effectiveness | A | A |
| Jockey Effectiveness | A | A |
| 3rd Party Ratings | A | A |
| Recent
Performance analysis from the horse's recent races, weighted to reflect current form. Sprint and Route FPS (Foot Per Second) measure pace efficiency over the horse's recent sprints and routes respectively. Grading scale: A = elite • B = above average • C = average • D = below average • F = poor • — = no data |
||
| Speed | A | A |
| Early Pace | A | A |
| Mid Pace | A | A |
| Late Pace | B | B |
| Sprint FPS | A | A |
| Route FPS | B | A |
| Trainer Effectiveness | A | A |
| Jockey Effectiveness | A | A |
| 3rd Party Ratings | A | A |
| Predictions
AI-generated projections for the upcoming race, derived from prior AI analysis for speed and pace trends, surface and distance suitability, and current conditions. Grading scale: A = elite • B = above average • C = average • D = below average • F = poor • — = no data |
||
| Speed | A | A |
| Early Pace | A | A |
| Mid Pace | A | A |
| Late Pace | C | C |
Chart Guide (2.0.36)
- Bubbles
- Color = surface: green (turf), brown (dirt), blue (synthetic)
- Top number = finishing position; bottom number in parentheses = starting post position
- Height above line = beaten lengths — closer means a smaller margin
- Border = track conditions: green (FST/GD/FM), yellow (WF/SL/YLD), red (SY/MY/FRZ/SFT/HVY)
- Connecting Line
- Solid = good conditions; dashed = bad conditions
- Line Symbol
- ▲ Triangle = sprint (7f or less); ● Circle = route (more than 7f)
- Days Between Races
- Small number above each bubble (e.g. 19d) = days since the previous race — helps spot freshness, layoffs, and tight scheduling.
- Shaded Band (Bollinger)
- Highlights volatility — a wider band means more variation in recent performance
- Performance Trend
- Straight line showing the overall performance direction — angled up = improving, angled down = declining
- Dashed Reference Line
- AI Opponent = AI analysis class-level par for the race
AI Model History Guide
- Lines
- Each solid line shows this horse’s model score over its last 10 races: blue = Mod1, green = Mod2, amber = Mod3.
- Dashed Lines
- Dashed lines represent the current race’s field average for each model — a score below the dashed line indicates the horse ranked below average in this model’s assessment.
- Higher is Stronger
- All three model scores are 0–100: a higher number means the model rates this horse more favorably among the field.
Mod1(W): 82 (1/8) Mod2(W): 75 (2/8) Mod3(W): 79 (3/8) Mod1-LS: 55 (6/8) Win Prob: 18.4% Value Score: 1.35 ★
Performance vs. Peers Guide
- Bars (per post)
- Blue = avg career performance • Amber = avg last 3 races • Green = last race (improved vs. avg) • Red = last race (declined vs. avg)
- Trend Line
- Angled line above the bars: rising = improving form • falling = declining form.
- Horizontal Line
- Field average — the mean career performance of all horses in this race.
- Color Circles
- Standard post-position colors below each lane — same as the Total Pace chart.
- Border
- Thicker border = this horse’s post position.
Figure Comparison
- Rating
- The three Pick Pony algorithm ratings (Algo 1, Algo 2, Algo 3) that make up the overall PP AI Rating — higher is a stronger contender rating.
- Speed
- Career average speed, recent 3-race average, and last-race speed figure — spot horses in improving or declining form.
- Pace
- Average Early (E1), Mid (E2), and Stretch (LP) pace figures — reveals pace-setters vs. closers vs. all-the-way types.
- This horse
- The horse whose stats card is open is highlighted with a darker column background.
Winning Profiles
- Axes
- X: Win % from last 10 starts — Y: In-the-money % (top-3 finishes) from last 10 starts.
- Quadrants
- Consistent Winners (top-right): high win & ITM — reliable performers.
Place Threats (top-left): boards often but doesn’t win often — good exacta/trifecta angles.
Streaky (bottom-right): wins occasionally, misses the board often — all-or-nothing.
Developing (bottom-left): still finding form — longshot territory. - Reference Lines
- Dashed lines mark field averages. Dots to the right win more; dots higher board more.
- This horse
- Highlighted with a gold border and larger dot.
AI Model Comparison
- Winner Models (green)
- Mod1(W), Mod2(W), and Mod3(W) trained to predict race winners. Higher score = stronger contender.
- Longshot Models (red)
- Mod1-LS, Mod2-LS, and Mod3-LS trained to find high-value longshots. Higher score = stronger longshot candidate.
- Form Model (blue)
- Mod4 sequence model trained on recent form patterns. Higher score = stronger recent form profile.
- This horse
- Highlighted with a darker column background.
Race Pace Simulation Guide
- Slider
- Drag left→right to advance from gate to finish. Drag all the way back to reset the race.
- Predicted Finish Order
- Factors in contested pace burn, each horse’s effort curve (peaked-early vs. peaked-late), and wide trip cost from outside posts. Updated live when Track Bias changes.
- Pace Scenario
- Lone Speed: single E horse likely rates and holds. Contested: two E horses burn each other — closers benefit. Hot Pace: speed meltdown, deep closers thrive. Soft: no early speed, moderate fractions throughout.
- Track Bias
- Slider below canvas. −2 = strong closer/wet bias; +2 = strong speed/rail bias. Recomputes the predicted finish order.
- Boxed Indicator
- Dashed orange ring = horse is surrounded (rival ahead, rival behind, wall outside). In a real race this horse must find a clear path to run.
- Running Styles
- E/EE = early speed (rushes to rail). P = presser (stalks the pace). S = stalker. SS = slow starter / closer.
| Stat | vs. Current Card | vs. All Horses |
|---|---|---|
| Averages
Career-average metrics across all AI race analysis. Performance and pace averages reflect estimated historical performance; trainer and jockey grades score in-the-money percentages. Grading scale: A = elite • B = above average • C = average • D = below average • F = poor • — = no data |
||
| Pick Pony AI Rating | B | D |
| Pace Trip Longshot | — | — |
| Connections Longshot | — | — |
| Situational Longshot | — | — |
| Speed | A | B |
| Early Pace | F | D |
| Mid Pace | F | D |
| Late Pace | A | A |
| Finish Pos | A | B |
| Dirt Speed | A | B |
| Turf Speed | C | D |
| Distance Speed | B | B |
| Trainer Effectiveness | C | C |
| Jockey Effectiveness | D | C |
| 3rd Party Ratings | C | B |
| Recent
Performance analysis from the horse's recent races, weighted to reflect current form. Sprint and Route FPS (Foot Per Second) measure pace efficiency over the horse's recent sprints and routes respectively. Grading scale: A = elite • B = above average • C = average • D = below average • F = poor • — = no data |
||
| Speed | A | B |
| Early Pace | F | D |
| Mid Pace | F | D |
| Late Pace | A | A |
| Sprint FPS | F | D |
| Route FPS | F | D |
| Trainer Effectiveness | C | C |
| Jockey Effectiveness | D | C |
| 3rd Party Ratings | C | B |
| Predictions
AI-generated projections for the upcoming race, derived from prior AI analysis for speed and pace trends, surface and distance suitability, and current conditions. Grading scale: A = elite • B = above average • C = average • D = below average • F = poor • — = no data |
||
| Speed | A | B |
| Early Pace | F | D |
| Mid Pace | F | D |
| Late Pace | C | C |
Chart Guide (2.0.36)
- Bubbles
- Color = surface: green (turf), brown (dirt), blue (synthetic)
- Top number = finishing position; bottom number in parentheses = starting post position
- Height above line = beaten lengths — closer means a smaller margin
- Border = track conditions: green (FST/GD/FM), yellow (WF/SL/YLD), red (SY/MY/FRZ/SFT/HVY)
- Connecting Line
- Solid = good conditions; dashed = bad conditions
- Line Symbol
- ▲ Triangle = sprint (7f or less); ● Circle = route (more than 7f)
- Days Between Races
- Small number above each bubble (e.g. 19d) = days since the previous race — helps spot freshness, layoffs, and tight scheduling.
- Shaded Band (Bollinger)
- Highlights volatility — a wider band means more variation in recent performance
- Performance Trend
- Straight line showing the overall performance direction — angled up = improving, angled down = declining
- Dashed Reference Line
- AI Opponent = AI analysis class-level par for the race
AI Model History Guide
- Lines
- Each solid line shows this horse’s model score over its last 10 races: blue = Mod1, green = Mod2, amber = Mod3.
- Dashed Lines
- Dashed lines represent the current race’s field average for each model — a score below the dashed line indicates the horse ranked below average in this model’s assessment.
- Higher is Stronger
- All three model scores are 0–100: a higher number means the model rates this horse more favorably among the field.
Mod1(W): 82 (1/8) Mod2(W): 75 (2/8) Mod3(W): 79 (3/8) Mod1-LS: 55 (6/8) Win Prob: 18.4% Value Score: 1.35 ★
Performance vs. Peers Guide
- Bars (per post)
- Blue = avg career performance • Amber = avg last 3 races • Green = last race (improved vs. avg) • Red = last race (declined vs. avg)
- Trend Line
- Angled line above the bars: rising = improving form • falling = declining form.
- Horizontal Line
- Field average — the mean career performance of all horses in this race.
- Color Circles
- Standard post-position colors below each lane — same as the Total Pace chart.
- Border
- Thicker border = this horse’s post position.
Figure Comparison
- Rating
- The three Pick Pony algorithm ratings (Algo 1, Algo 2, Algo 3) that make up the overall PP AI Rating — higher is a stronger contender rating.
- Speed
- Career average speed, recent 3-race average, and last-race speed figure — spot horses in improving or declining form.
- Pace
- Average Early (E1), Mid (E2), and Stretch (LP) pace figures — reveals pace-setters vs. closers vs. all-the-way types.
- This horse
- The horse whose stats card is open is highlighted with a darker column background.
Winning Profiles
- Axes
- X: Win % from last 10 starts — Y: In-the-money % (top-3 finishes) from last 10 starts.
- Quadrants
- Consistent Winners (top-right): high win & ITM — reliable performers.
Place Threats (top-left): boards often but doesn’t win often — good exacta/trifecta angles.
Streaky (bottom-right): wins occasionally, misses the board often — all-or-nothing.
Developing (bottom-left): still finding form — longshot territory. - Reference Lines
- Dashed lines mark field averages. Dots to the right win more; dots higher board more.
- This horse
- Highlighted with a gold border and larger dot.
AI Model Comparison
- Winner Models (green)
- Mod1(W), Mod2(W), and Mod3(W) trained to predict race winners. Higher score = stronger contender.
- Longshot Models (red)
- Mod1-LS, Mod2-LS, and Mod3-LS trained to find high-value longshots. Higher score = stronger longshot candidate.
- Form Model (blue)
- Mod4 sequence model trained on recent form patterns. Higher score = stronger recent form profile.
- This horse
- Highlighted with a darker column background.
Race Pace Simulation Guide
- Slider
- Drag left→right to advance from gate to finish. Drag all the way back to reset the race.
- Predicted Finish Order
- Factors in contested pace burn, each horse’s effort curve (peaked-early vs. peaked-late), and wide trip cost from outside posts. Updated live when Track Bias changes.
- Pace Scenario
- Lone Speed: single E horse likely rates and holds. Contested: two E horses burn each other — closers benefit. Hot Pace: speed meltdown, deep closers thrive. Soft: no early speed, moderate fractions throughout.
- Track Bias
- Slider below canvas. −2 = strong closer/wet bias; +2 = strong speed/rail bias. Recomputes the predicted finish order.
- Boxed Indicator
- Dashed orange ring = horse is surrounded (rival ahead, rival behind, wall outside). In a real race this horse must find a clear path to run.
- Running Styles
- E/EE = early speed (rushes to rail). P = presser (stalks the pace). S = stalker. SS = slow starter / closer.
| Stat | vs. Current Card | vs. All Horses |
|---|---|---|
| Averages
Career-average metrics across all AI race analysis. Performance and pace averages reflect estimated historical performance; trainer and jockey grades score in-the-money percentages. Grading scale: A = elite • B = above average • C = average • D = below average • F = poor • — = no data |
||
| Pick Pony AI Rating | D | D |
| Pace Trip Longshot | — | — |
| Connections Longshot | — | — |
| Situational Longshot | — | — |
| Speed | B | C |
| Early Pace | B | A |
| Mid Pace | B | A |
| Late Pace | D | C |
| Finish Pos | F | B |
| Dirt Speed | B | B |
| Turf Speed | A | B |
| Distance Speed | D | C |
| Trainer Effectiveness | B | B |
| Jockey Effectiveness | C | C |
| 3rd Party Ratings | A | A |
| Recent
Performance analysis from the horse's recent races, weighted to reflect current form. Sprint and Route FPS (Foot Per Second) measure pace efficiency over the horse's recent sprints and routes respectively. Grading scale: A = elite • B = above average • C = average • D = below average • F = poor • — = no data |
||
| Speed | C | C |
| Early Pace | B | A |
| Mid Pace | B | A |
| Late Pace | D | C |
| Sprint FPS | B | A |
| Route FPS | A | A |
| Trainer Effectiveness | B | B |
| Jockey Effectiveness | C | C |
| 3rd Party Ratings | A | A |
| Predictions
AI-generated projections for the upcoming race, derived from prior AI analysis for speed and pace trends, surface and distance suitability, and current conditions. Grading scale: A = elite • B = above average • C = average • D = below average • F = poor • — = no data |
||
| Speed | C | C |
| Early Pace | B | A |
| Mid Pace | B | B |
| Late Pace | C | C |
Chart Guide (2.0.36)
- Bubbles
- Color = surface: green (turf), brown (dirt), blue (synthetic)
- Top number = finishing position; bottom number in parentheses = starting post position
- Height above line = beaten lengths — closer means a smaller margin
- Border = track conditions: green (FST/GD/FM), yellow (WF/SL/YLD), red (SY/MY/FRZ/SFT/HVY)
- Connecting Line
- Solid = good conditions; dashed = bad conditions
- Line Symbol
- ▲ Triangle = sprint (7f or less); ● Circle = route (more than 7f)
- Days Between Races
- Small number above each bubble (e.g. 19d) = days since the previous race — helps spot freshness, layoffs, and tight scheduling.
- Shaded Band (Bollinger)
- Highlights volatility — a wider band means more variation in recent performance
- Performance Trend
- Straight line showing the overall performance direction — angled up = improving, angled down = declining
- Dashed Reference Line
- AI Opponent = AI analysis class-level par for the race
AI Model History Guide
- Lines
- Each solid line shows this horse’s model score over its last 10 races: blue = Mod1, green = Mod2, amber = Mod3.
- Dashed Lines
- Dashed lines represent the current race’s field average for each model — a score below the dashed line indicates the horse ranked below average in this model’s assessment.
- Higher is Stronger
- All three model scores are 0–100: a higher number means the model rates this horse more favorably among the field.
Mod1(W): 82 (1/8) Mod2(W): 75 (2/8) Mod3(W): 79 (3/8) Mod1-LS: 55 (6/8) Win Prob: 18.4% Value Score: 1.35 ★
Performance vs. Peers Guide
- Bars (per post)
- Blue = avg career performance • Amber = avg last 3 races • Green = last race (improved vs. avg) • Red = last race (declined vs. avg)
- Trend Line
- Angled line above the bars: rising = improving form • falling = declining form.
- Horizontal Line
- Field average — the mean career performance of all horses in this race.
- Color Circles
- Standard post-position colors below each lane — same as the Total Pace chart.
- Border
- Thicker border = this horse’s post position.
Figure Comparison
- Rating
- The three Pick Pony algorithm ratings (Algo 1, Algo 2, Algo 3) that make up the overall PP AI Rating — higher is a stronger contender rating.
- Speed
- Career average speed, recent 3-race average, and last-race speed figure — spot horses in improving or declining form.
- Pace
- Average Early (E1), Mid (E2), and Stretch (LP) pace figures — reveals pace-setters vs. closers vs. all-the-way types.
- This horse
- The horse whose stats card is open is highlighted with a darker column background.
Winning Profiles
- Axes
- X: Win % from last 10 starts — Y: In-the-money % (top-3 finishes) from last 10 starts.
- Quadrants
- Consistent Winners (top-right): high win & ITM — reliable performers.
Place Threats (top-left): boards often but doesn’t win often — good exacta/trifecta angles.
Streaky (bottom-right): wins occasionally, misses the board often — all-or-nothing.
Developing (bottom-left): still finding form — longshot territory. - Reference Lines
- Dashed lines mark field averages. Dots to the right win more; dots higher board more.
- This horse
- Highlighted with a gold border and larger dot.
AI Model Comparison
- Winner Models (green)
- Mod1(W), Mod2(W), and Mod3(W) trained to predict race winners. Higher score = stronger contender.
- Longshot Models (red)
- Mod1-LS, Mod2-LS, and Mod3-LS trained to find high-value longshots. Higher score = stronger longshot candidate.
- Form Model (blue)
- Mod4 sequence model trained on recent form patterns. Higher score = stronger recent form profile.
- This horse
- Highlighted with a darker column background.
Race Pace Simulation Guide
- Slider
- Drag left→right to advance from gate to finish. Drag all the way back to reset the race.
- Predicted Finish Order
- Factors in contested pace burn, each horse’s effort curve (peaked-early vs. peaked-late), and wide trip cost from outside posts. Updated live when Track Bias changes.
- Pace Scenario
- Lone Speed: single E horse likely rates and holds. Contested: two E horses burn each other — closers benefit. Hot Pace: speed meltdown, deep closers thrive. Soft: no early speed, moderate fractions throughout.
- Track Bias
- Slider below canvas. −2 = strong closer/wet bias; +2 = strong speed/rail bias. Recomputes the predicted finish order.
- Boxed Indicator
- Dashed orange ring = horse is surrounded (rival ahead, rival behind, wall outside). In a real race this horse must find a clear path to run.
- Running Styles
- E/EE = early speed (rushes to rail). P = presser (stalks the pace). S = stalker. SS = slow starter / closer.
| Stat | vs. Current Card | vs. All Horses |
|---|---|---|
| Averages
Career-average metrics across all AI race analysis. Performance and pace averages reflect estimated historical performance; trainer and jockey grades score in-the-money percentages. Grading scale: A = elite • B = above average • C = average • D = below average • F = poor • — = no data |
||
| Pick Pony AI Rating | D | D |
| Pace Trip Longshot | — | — |
| Connections Longshot | — | — |
| Situational Longshot | — | — |
| Speed | F | D |
| Early Pace | F | F |
| Mid Pace | F | F |
| Late Pace | A | A |
| Finish Pos | D | F |
| Dirt Speed | D | C |
| Turf Speed | D | C |
| Distance Speed | D | C |
| Trainer Effectiveness | D | D |
| Jockey Effectiveness | B | A |
| 3rd Party Ratings | F | C |
| Recent
Performance analysis from the horse's recent races, weighted to reflect current form. Sprint and Route FPS (Foot Per Second) measure pace efficiency over the horse's recent sprints and routes respectively. Grading scale: A = elite • B = above average • C = average • D = below average • F = poor • — = no data |
||
| Speed | D | D |
| Early Pace | F | F |
| Mid Pace | F | D |
| Late Pace | A | A |
| Sprint FPS | F | D |
| Route FPS | D | D |
| Trainer Effectiveness | D | D |
| Jockey Effectiveness | B | A |
| 3rd Party Ratings | F | C |
| Predictions
AI-generated projections for the upcoming race, derived from prior AI analysis for speed and pace trends, surface and distance suitability, and current conditions. Grading scale: A = elite • B = above average • C = average • D = below average • F = poor • — = no data |
||
| Speed | F | D |
| Early Pace | F | D |
| Mid Pace | F | D |
| Late Pace | C | C |
Chart Guide (2.0.36)
- Bubbles
- Color = surface: green (turf), brown (dirt), blue (synthetic)
- Top number = finishing position; bottom number in parentheses = starting post position
- Height above line = beaten lengths — closer means a smaller margin
- Border = track conditions: green (FST/GD/FM), yellow (WF/SL/YLD), red (SY/MY/FRZ/SFT/HVY)
- Connecting Line
- Solid = good conditions; dashed = bad conditions
- Line Symbol
- ▲ Triangle = sprint (7f or less); ● Circle = route (more than 7f)
- Days Between Races
- Small number above each bubble (e.g. 19d) = days since the previous race — helps spot freshness, layoffs, and tight scheduling.
- Shaded Band (Bollinger)
- Highlights volatility — a wider band means more variation in recent performance
- Performance Trend
- Straight line showing the overall performance direction — angled up = improving, angled down = declining
- Dashed Reference Line
- AI Opponent = AI analysis class-level par for the race
AI Model History Guide
- Lines
- Each solid line shows this horse’s model score over its last 10 races: blue = Mod1, green = Mod2, amber = Mod3.
- Dashed Lines
- Dashed lines represent the current race’s field average for each model — a score below the dashed line indicates the horse ranked below average in this model’s assessment.
- Higher is Stronger
- All three model scores are 0–100: a higher number means the model rates this horse more favorably among the field.
Mod1(W): 82 (1/8) Mod2(W): 75 (2/8) Mod3(W): 79 (3/8) Mod1-LS: 55 (6/8) Win Prob: 18.4% Value Score: 1.35 ★
Performance vs. Peers Guide
- Bars (per post)
- Blue = avg career performance • Amber = avg last 3 races • Green = last race (improved vs. avg) • Red = last race (declined vs. avg)
- Trend Line
- Angled line above the bars: rising = improving form • falling = declining form.
- Horizontal Line
- Field average — the mean career performance of all horses in this race.
- Color Circles
- Standard post-position colors below each lane — same as the Total Pace chart.
- Border
- Thicker border = this horse’s post position.
Figure Comparison
- Rating
- The three Pick Pony algorithm ratings (Algo 1, Algo 2, Algo 3) that make up the overall PP AI Rating — higher is a stronger contender rating.
- Speed
- Career average speed, recent 3-race average, and last-race speed figure — spot horses in improving or declining form.
- Pace
- Average Early (E1), Mid (E2), and Stretch (LP) pace figures — reveals pace-setters vs. closers vs. all-the-way types.
- This horse
- The horse whose stats card is open is highlighted with a darker column background.
Winning Profiles
- Axes
- X: Win % from last 10 starts — Y: In-the-money % (top-3 finishes) from last 10 starts.
- Quadrants
- Consistent Winners (top-right): high win & ITM — reliable performers.
Place Threats (top-left): boards often but doesn’t win often — good exacta/trifecta angles.
Streaky (bottom-right): wins occasionally, misses the board often — all-or-nothing.
Developing (bottom-left): still finding form — longshot territory. - Reference Lines
- Dashed lines mark field averages. Dots to the right win more; dots higher board more.
- This horse
- Highlighted with a gold border and larger dot.
AI Model Comparison
- Winner Models (green)
- Mod1(W), Mod2(W), and Mod3(W) trained to predict race winners. Higher score = stronger contender.
- Longshot Models (red)
- Mod1-LS, Mod2-LS, and Mod3-LS trained to find high-value longshots. Higher score = stronger longshot candidate.
- Form Model (blue)
- Mod4 sequence model trained on recent form patterns. Higher score = stronger recent form profile.
- This horse
- Highlighted with a darker column background.
Race Pace Simulation Guide
- Slider
- Drag left→right to advance from gate to finish. Drag all the way back to reset the race.
- Predicted Finish Order
- Factors in contested pace burn, each horse’s effort curve (peaked-early vs. peaked-late), and wide trip cost from outside posts. Updated live when Track Bias changes.
- Pace Scenario
- Lone Speed: single E horse likely rates and holds. Contested: two E horses burn each other — closers benefit. Hot Pace: speed meltdown, deep closers thrive. Soft: no early speed, moderate fractions throughout.
- Track Bias
- Slider below canvas. −2 = strong closer/wet bias; +2 = strong speed/rail bias. Recomputes the predicted finish order.
- Boxed Indicator
- Dashed orange ring = horse is surrounded (rival ahead, rival behind, wall outside). In a real race this horse must find a clear path to run.
- Running Styles
- E/EE = early speed (rushes to rail). P = presser (stalks the pace). S = stalker. SS = slow starter / closer.
| Stat | vs. Current Card | vs. All Horses |
|---|---|---|
| Averages
Career-average metrics across all AI race analysis. Performance and pace averages reflect estimated historical performance; trainer and jockey grades score in-the-money percentages. Grading scale: A = elite • B = above average • C = average • D = below average • F = poor • — = no data |
||
| Pick Pony AI Rating | A | B |
| Pace Trip Longshot | — | — |
| Connections Longshot | — | — |
| Situational Longshot | — | — |
| Speed | C | C |
| Early Pace | D | D |
| Mid Pace | D | D |
| Late Pace | B | A |
| Finish Pos | C | C |
| Dirt Speed | A | B |
| Turf Speed | B | B |
| Distance Speed | A | B |
| Trainer Effectiveness | A | A |
| Jockey Effectiveness | A | A |
| 3rd Party Ratings | B | C |
| Recent
Performance analysis from the horse's recent races, weighted to reflect current form. Sprint and Route FPS (Foot Per Second) measure pace efficiency over the horse's recent sprints and routes respectively. Grading scale: A = elite • B = above average • C = average • D = below average • F = poor • — = no data |
||
| Speed | C | C |
| Early Pace | D | D |
| Mid Pace | C | D |
| Late Pace | B | B |
| Sprint FPS | D | D |
| Route FPS | A | B |
| Trainer Effectiveness | A | A |
| Jockey Effectiveness | A | A |
| 3rd Party Ratings | B | C |
| Predictions
AI-generated projections for the upcoming race, derived from prior AI analysis for speed and pace trends, surface and distance suitability, and current conditions. Grading scale: A = elite • B = above average • C = average • D = below average • F = poor • — = no data |
||
| Speed | C | C |
| Early Pace | D | D |
| Mid Pace | D | D |
| Late Pace | C | C |
Chart Guide (2.0.36)
- Bubbles
- Color = surface: green (turf), brown (dirt), blue (synthetic)
- Top number = finishing position; bottom number in parentheses = starting post position
- Height above line = beaten lengths — closer means a smaller margin
- Border = track conditions: green (FST/GD/FM), yellow (WF/SL/YLD), red (SY/MY/FRZ/SFT/HVY)
- Connecting Line
- Solid = good conditions; dashed = bad conditions
- Line Symbol
- ▲ Triangle = sprint (7f or less); ● Circle = route (more than 7f)
- Days Between Races
- Small number above each bubble (e.g. 19d) = days since the previous race — helps spot freshness, layoffs, and tight scheduling.
- Shaded Band (Bollinger)
- Highlights volatility — a wider band means more variation in recent performance
- Performance Trend
- Straight line showing the overall performance direction — angled up = improving, angled down = declining
- Dashed Reference Line
- AI Opponent = AI analysis class-level par for the race
AI Model History Guide
- Lines
- Each solid line shows this horse’s model score over its last 10 races: blue = Mod1, green = Mod2, amber = Mod3.
- Dashed Lines
- Dashed lines represent the current race’s field average for each model — a score below the dashed line indicates the horse ranked below average in this model’s assessment.
- Higher is Stronger
- All three model scores are 0–100: a higher number means the model rates this horse more favorably among the field.
Mod1(W): 82 (1/8) Mod2(W): 75 (2/8) Mod3(W): 79 (3/8) Mod1-LS: 55 (6/8) Win Prob: 18.4% Value Score: 1.35 ★
Performance vs. Peers Guide
- Bars (per post)
- Blue = avg career performance • Amber = avg last 3 races • Green = last race (improved vs. avg) • Red = last race (declined vs. avg)
- Trend Line
- Angled line above the bars: rising = improving form • falling = declining form.
- Horizontal Line
- Field average — the mean career performance of all horses in this race.
- Color Circles
- Standard post-position colors below each lane — same as the Total Pace chart.
- Border
- Thicker border = this horse’s post position.
Figure Comparison
- Rating
- The three Pick Pony algorithm ratings (Algo 1, Algo 2, Algo 3) that make up the overall PP AI Rating — higher is a stronger contender rating.
- Speed
- Career average speed, recent 3-race average, and last-race speed figure — spot horses in improving or declining form.
- Pace
- Average Early (E1), Mid (E2), and Stretch (LP) pace figures — reveals pace-setters vs. closers vs. all-the-way types.
- This horse
- The horse whose stats card is open is highlighted with a darker column background.
Winning Profiles
- Axes
- X: Win % from last 10 starts — Y: In-the-money % (top-3 finishes) from last 10 starts.
- Quadrants
- Consistent Winners (top-right): high win & ITM — reliable performers.
Place Threats (top-left): boards often but doesn’t win often — good exacta/trifecta angles.
Streaky (bottom-right): wins occasionally, misses the board often — all-or-nothing.
Developing (bottom-left): still finding form — longshot territory. - Reference Lines
- Dashed lines mark field averages. Dots to the right win more; dots higher board more.
- This horse
- Highlighted with a gold border and larger dot.
AI Model Comparison
- Winner Models (green)
- Mod1(W), Mod2(W), and Mod3(W) trained to predict race winners. Higher score = stronger contender.
- Longshot Models (red)
- Mod1-LS, Mod2-LS, and Mod3-LS trained to find high-value longshots. Higher score = stronger longshot candidate.
- Form Model (blue)
- Mod4 sequence model trained on recent form patterns. Higher score = stronger recent form profile.
- This horse
- Highlighted with a darker column background.
Race Pace Simulation Guide
- Slider
- Drag left→right to advance from gate to finish. Drag all the way back to reset the race.
- Predicted Finish Order
- Factors in contested pace burn, each horse’s effort curve (peaked-early vs. peaked-late), and wide trip cost from outside posts. Updated live when Track Bias changes.
- Pace Scenario
- Lone Speed: single E horse likely rates and holds. Contested: two E horses burn each other — closers benefit. Hot Pace: speed meltdown, deep closers thrive. Soft: no early speed, moderate fractions throughout.
- Track Bias
- Slider below canvas. −2 = strong closer/wet bias; +2 = strong speed/rail bias. Recomputes the predicted finish order.
- Boxed Indicator
- Dashed orange ring = horse is surrounded (rival ahead, rival behind, wall outside). In a real race this horse must find a clear path to run.
- Running Styles
- E/EE = early speed (rushes to rail). P = presser (stalks the pace). S = stalker. SS = slow starter / closer.
| Stat | vs. Current Card | vs. All Horses |
|---|---|---|
| Averages
Career-average metrics across all AI race analysis. Performance and pace averages reflect estimated historical performance; trainer and jockey grades score in-the-money percentages. Grading scale: A = elite • B = above average • C = average • D = below average • F = poor • — = no data |
||
| Pick Pony AI Rating | A | A |
| Pace Trip Longshot | — | — |
| Connections Longshot | — | — |
| Situational Longshot | — | — |
| Speed | A | B |
| Early Pace | B | C |
| Mid Pace | A | B |
| Late Pace | A | A |
| Finish Pos | A | B |
| Dirt Speed | B | B |
| Turf Speed | C | B |
| Distance Speed | D | C |
| Trainer Effectiveness | B | C |
| Jockey Effectiveness | D | D |
| 3rd Party Ratings | A | B |
| Recent
Performance analysis from the horse's recent races, weighted to reflect current form. Sprint and Route FPS (Foot Per Second) measure pace efficiency over the horse's recent sprints and routes respectively. Grading scale: A = elite • B = above average • C = average • D = below average • F = poor • — = no data |
||
| Speed | A | B |
| Early Pace | B | C |
| Mid Pace | A | B |
| Late Pace | A | A |
| Sprint FPS | D | D |
| Route FPS | F | D |
| Trainer Effectiveness | B | C |
| Jockey Effectiveness | D | D |
| 3rd Party Ratings | A | B |
| Predictions
AI-generated projections for the upcoming race, derived from prior AI analysis for speed and pace trends, surface and distance suitability, and current conditions. Grading scale: A = elite • B = above average • C = average • D = below average • F = poor • — = no data |
||
| Speed | A | B |
| Early Pace | A | C |
| Mid Pace | A | B |
| Late Pace | C | C |
Chart Guide (2.0.36)
- Bubbles
- Color = surface: green (turf), brown (dirt), blue (synthetic)
- Top number = finishing position; bottom number in parentheses = starting post position
- Height above line = beaten lengths — closer means a smaller margin
- Border = track conditions: green (FST/GD/FM), yellow (WF/SL/YLD), red (SY/MY/FRZ/SFT/HVY)
- Connecting Line
- Solid = good conditions; dashed = bad conditions
- Line Symbol
- ▲ Triangle = sprint (7f or less); ● Circle = route (more than 7f)
- Days Between Races
- Small number above each bubble (e.g. 19d) = days since the previous race — helps spot freshness, layoffs, and tight scheduling.
- Shaded Band (Bollinger)
- Highlights volatility — a wider band means more variation in recent performance
- Performance Trend
- Straight line showing the overall performance direction — angled up = improving, angled down = declining
- Dashed Reference Line
- AI Opponent = AI analysis class-level par for the race
AI Model History Guide
- Lines
- Each solid line shows this horse’s model score over its last 10 races: blue = Mod1, green = Mod2, amber = Mod3.
- Dashed Lines
- Dashed lines represent the current race’s field average for each model — a score below the dashed line indicates the horse ranked below average in this model’s assessment.
- Higher is Stronger
- All three model scores are 0–100: a higher number means the model rates this horse more favorably among the field.
Mod1(W): 82 (1/8) Mod2(W): 75 (2/8) Mod3(W): 79 (3/8) Mod1-LS: 55 (6/8) Win Prob: 18.4% Value Score: 1.35 ★
Performance vs. Peers Guide
- Bars (per post)
- Blue = avg career performance • Amber = avg last 3 races • Green = last race (improved vs. avg) • Red = last race (declined vs. avg)
- Trend Line
- Angled line above the bars: rising = improving form • falling = declining form.
- Horizontal Line
- Field average — the mean career performance of all horses in this race.
- Color Circles
- Standard post-position colors below each lane — same as the Total Pace chart.
- Border
- Thicker border = this horse’s post position.
Figure Comparison
- Rating
- The three Pick Pony algorithm ratings (Algo 1, Algo 2, Algo 3) that make up the overall PP AI Rating — higher is a stronger contender rating.
- Speed
- Career average speed, recent 3-race average, and last-race speed figure — spot horses in improving or declining form.
- Pace
- Average Early (E1), Mid (E2), and Stretch (LP) pace figures — reveals pace-setters vs. closers vs. all-the-way types.
- This horse
- The horse whose stats card is open is highlighted with a darker column background.
Winning Profiles
- Axes
- X: Win % from last 10 starts — Y: In-the-money % (top-3 finishes) from last 10 starts.
- Quadrants
- Consistent Winners (top-right): high win & ITM — reliable performers.
Place Threats (top-left): boards often but doesn’t win often — good exacta/trifecta angles.
Streaky (bottom-right): wins occasionally, misses the board often — all-or-nothing.
Developing (bottom-left): still finding form — longshot territory. - Reference Lines
- Dashed lines mark field averages. Dots to the right win more; dots higher board more.
- This horse
- Highlighted with a gold border and larger dot.
AI Model Comparison
- Winner Models (green)
- Mod1(W), Mod2(W), and Mod3(W) trained to predict race winners. Higher score = stronger contender.
- Longshot Models (red)
- Mod1-LS, Mod2-LS, and Mod3-LS trained to find high-value longshots. Higher score = stronger longshot candidate.
- Form Model (blue)
- Mod4 sequence model trained on recent form patterns. Higher score = stronger recent form profile.
- This horse
- Highlighted with a darker column background.
Race Pace Simulation Guide
- Slider
- Drag left→right to advance from gate to finish. Drag all the way back to reset the race.
- Predicted Finish Order
- Factors in contested pace burn, each horse’s effort curve (peaked-early vs. peaked-late), and wide trip cost from outside posts. Updated live when Track Bias changes.
- Pace Scenario
- Lone Speed: single E horse likely rates and holds. Contested: two E horses burn each other — closers benefit. Hot Pace: speed meltdown, deep closers thrive. Soft: no early speed, moderate fractions throughout.
- Track Bias
- Slider below canvas. −2 = strong closer/wet bias; +2 = strong speed/rail bias. Recomputes the predicted finish order.
- Boxed Indicator
- Dashed orange ring = horse is surrounded (rival ahead, rival behind, wall outside). In a real race this horse must find a clear path to run.
- Running Styles
- E/EE = early speed (rushes to rail). P = presser (stalks the pace). S = stalker. SS = slow starter / closer.
| Stat | vs. Current Card | vs. All Horses |
|---|---|---|
| Averages
Career-average metrics across all AI race analysis. Performance and pace averages reflect estimated historical performance; trainer and jockey grades score in-the-money percentages. Grading scale: A = elite • B = above average • C = average • D = below average • F = poor • — = no data |
||
| Pick Pony AI Rating | B | C |
| Pace Trip Longshot | — | — |
| Connections Longshot | — | — |
| Situational Longshot | — | — |
| Speed | B | B |
| Early Pace | C | B |
| Mid Pace | F | C |
| Late Pace | B | A |
| Finish Pos | A | A |
| Dirt Speed | D | C |
| Turf Speed | D | D |
| Distance Speed | C | F |
| Trainer Effectiveness | A | A |
| Jockey Effectiveness | A | A |
| 3rd Party Ratings | A | A |
| Recent
Performance analysis from the horse's recent races, weighted to reflect current form. Sprint and Route FPS (Foot Per Second) measure pace efficiency over the horse's recent sprints and routes respectively. Grading scale: A = elite • B = above average • C = average • D = below average • F = poor • — = no data |
||
| Speed | B | B |
| Early Pace | D | B |
| Mid Pace | D | C |
| Late Pace | B | A |
| Sprint FPS | C | C |
| Route FPS | C | C |
| Trainer Effectiveness | A | A |
| Jockey Effectiveness | A | A |
| 3rd Party Ratings | A | A |
| Predictions
AI-generated projections for the upcoming race, derived from prior AI analysis for speed and pace trends, surface and distance suitability, and current conditions. Grading scale: A = elite • B = above average • C = average • D = below average • F = poor • — = no data |
||
| Speed | C | B |
| Early Pace | C | C |
| Mid Pace | A | A |
| Late Pace | C | C |
Chart Guide (2.0.36)
- Bubbles
- Color = surface: green (turf), brown (dirt), blue (synthetic)
- Top number = finishing position; bottom number in parentheses = starting post position
- Height above line = beaten lengths — closer means a smaller margin
- Border = track conditions: green (FST/GD/FM), yellow (WF/SL/YLD), red (SY/MY/FRZ/SFT/HVY)
- Connecting Line
- Solid = good conditions; dashed = bad conditions
- Line Symbol
- ▲ Triangle = sprint (7f or less); ● Circle = route (more than 7f)
- Days Between Races
- Small number above each bubble (e.g. 19d) = days since the previous race — helps spot freshness, layoffs, and tight scheduling.
- Shaded Band (Bollinger)
- Highlights volatility — a wider band means more variation in recent performance
- Performance Trend
- Straight line showing the overall performance direction — angled up = improving, angled down = declining
- Dashed Reference Line
- AI Opponent = AI analysis class-level par for the race
AI Model History Guide
- Lines
- Each solid line shows this horse’s model score over its last 10 races: blue = Mod1, green = Mod2, amber = Mod3.
- Dashed Lines
- Dashed lines represent the current race’s field average for each model — a score below the dashed line indicates the horse ranked below average in this model’s assessment.
- Higher is Stronger
- All three model scores are 0–100: a higher number means the model rates this horse more favorably among the field.
Mod1(W): 82 (1/8) Mod2(W): 75 (2/8) Mod3(W): 79 (3/8) Mod1-LS: 55 (6/8) Win Prob: 18.4% Value Score: 1.35 ★
Performance vs. Peers Guide
- Bars (per post)
- Blue = avg career performance • Amber = avg last 3 races • Green = last race (improved vs. avg) • Red = last race (declined vs. avg)
- Trend Line
- Angled line above the bars: rising = improving form • falling = declining form.
- Horizontal Line
- Field average — the mean career performance of all horses in this race.
- Color Circles
- Standard post-position colors below each lane — same as the Total Pace chart.
- Border
- Thicker border = this horse’s post position.
Figure Comparison
- Rating
- The three Pick Pony algorithm ratings (Algo 1, Algo 2, Algo 3) that make up the overall PP AI Rating — higher is a stronger contender rating.
- Speed
- Career average speed, recent 3-race average, and last-race speed figure — spot horses in improving or declining form.
- Pace
- Average Early (E1), Mid (E2), and Stretch (LP) pace figures — reveals pace-setters vs. closers vs. all-the-way types.
- This horse
- The horse whose stats card is open is highlighted with a darker column background.
Winning Profiles
- Axes
- X: Win % from last 10 starts — Y: In-the-money % (top-3 finishes) from last 10 starts.
- Quadrants
- Consistent Winners (top-right): high win & ITM — reliable performers.
Place Threats (top-left): boards often but doesn’t win often — good exacta/trifecta angles.
Streaky (bottom-right): wins occasionally, misses the board often — all-or-nothing.
Developing (bottom-left): still finding form — longshot territory. - Reference Lines
- Dashed lines mark field averages. Dots to the right win more; dots higher board more.
- This horse
- Highlighted with a gold border and larger dot.
AI Model Comparison
- Winner Models (green)
- Mod1(W), Mod2(W), and Mod3(W) trained to predict race winners. Higher score = stronger contender.
- Longshot Models (red)
- Mod1-LS, Mod2-LS, and Mod3-LS trained to find high-value longshots. Higher score = stronger longshot candidate.
- Form Model (blue)
- Mod4 sequence model trained on recent form patterns. Higher score = stronger recent form profile.
- This horse
- Highlighted with a darker column background.
Race Pace Simulation Guide
- Slider
- Drag left→right to advance from gate to finish. Drag all the way back to reset the race.
- Predicted Finish Order
- Factors in contested pace burn, each horse’s effort curve (peaked-early vs. peaked-late), and wide trip cost from outside posts. Updated live when Track Bias changes.
- Pace Scenario
- Lone Speed: single E horse likely rates and holds. Contested: two E horses burn each other — closers benefit. Hot Pace: speed meltdown, deep closers thrive. Soft: no early speed, moderate fractions throughout.
- Track Bias
- Slider below canvas. −2 = strong closer/wet bias; +2 = strong speed/rail bias. Recomputes the predicted finish order.
- Boxed Indicator
- Dashed orange ring = horse is surrounded (rival ahead, rival behind, wall outside). In a real race this horse must find a clear path to run.
- Running Styles
- E/EE = early speed (rushes to rail). P = presser (stalks the pace). S = stalker. SS = slow starter / closer.
| Stat | vs. Current Card | vs. All Horses |
|---|---|---|
| Averages
Career-average metrics across all AI race analysis. Performance and pace averages reflect estimated historical performance; trainer and jockey grades score in-the-money percentages. Grading scale: A = elite • B = above average • C = average • D = below average • F = poor • — = no data |
||
| Pick Pony AI Rating | A | B |
| Pace Trip Longshot | — | — |
| Connections Longshot | — | — |
| Situational Longshot | — | — |
| Speed | A | A |
| Early Pace | F | D |
| Mid Pace | D | C |
| Late Pace | A | A |
| Finish Pos | C | B |
| Dirt Speed | A | B |
| Turf Speed | D | D |
| Distance Speed | C | F |
| Trainer Effectiveness | D | C |
| Jockey Effectiveness | B | C |
| 3rd Party Ratings | A | B |
| Recent
Performance analysis from the horse's recent races, weighted to reflect current form. Sprint and Route FPS (Foot Per Second) measure pace efficiency over the horse's recent sprints and routes respectively. Grading scale: A = elite • B = above average • C = average • D = below average • F = poor • — = no data |
||
| Speed | A | B |
| Early Pace | F | D |
| Mid Pace | F | C |
| Late Pace | A | A |
| Sprint FPS | F | D |
| Route FPS | F | D |
| Trainer Effectiveness | D | C |
| Jockey Effectiveness | B | C |
| 3rd Party Ratings | A | B |
| Predictions
AI-generated projections for the upcoming race, derived from prior AI analysis for speed and pace trends, surface and distance suitability, and current conditions. Grading scale: A = elite • B = above average • C = average • D = below average • F = poor • — = no data |
||
| Speed | B | B |
| Early Pace | D | D |
| Mid Pace | C | C |
| Late Pace | C | C |
Chart Guide (2.0.36)
- Bubbles
- Color = surface: green (turf), brown (dirt), blue (synthetic)
- Top number = finishing position; bottom number in parentheses = starting post position
- Height above line = beaten lengths — closer means a smaller margin
- Border = track conditions: green (FST/GD/FM), yellow (WF/SL/YLD), red (SY/MY/FRZ/SFT/HVY)
- Connecting Line
- Solid = good conditions; dashed = bad conditions
- Line Symbol
- ▲ Triangle = sprint (7f or less); ● Circle = route (more than 7f)
- Days Between Races
- Small number above each bubble (e.g. 19d) = days since the previous race — helps spot freshness, layoffs, and tight scheduling.
- Shaded Band (Bollinger)
- Highlights volatility — a wider band means more variation in recent performance
- Performance Trend
- Straight line showing the overall performance direction — angled up = improving, angled down = declining
- Dashed Reference Line
- AI Opponent = AI analysis class-level par for the race
AI Model History Guide
- Lines
- Each solid line shows this horse’s model score over its last 10 races: blue = Mod1, green = Mod2, amber = Mod3.
- Dashed Lines
- Dashed lines represent the current race’s field average for each model — a score below the dashed line indicates the horse ranked below average in this model’s assessment.
- Higher is Stronger
- All three model scores are 0–100: a higher number means the model rates this horse more favorably among the field.
Mod1(W): 82 (1/8) Mod2(W): 75 (2/8) Mod3(W): 79 (3/8) Mod1-LS: 55 (6/8) Win Prob: 18.4% Value Score: 1.35 ★
Performance vs. Peers Guide
- Bars (per post)
- Blue = avg career performance • Amber = avg last 3 races • Green = last race (improved vs. avg) • Red = last race (declined vs. avg)
- Trend Line
- Angled line above the bars: rising = improving form • falling = declining form.
- Horizontal Line
- Field average — the mean career performance of all horses in this race.
- Color Circles
- Standard post-position colors below each lane — same as the Total Pace chart.
- Border
- Thicker border = this horse’s post position.
Figure Comparison
- Rating
- The three Pick Pony algorithm ratings (Algo 1, Algo 2, Algo 3) that make up the overall PP AI Rating — higher is a stronger contender rating.
- Speed
- Career average speed, recent 3-race average, and last-race speed figure — spot horses in improving or declining form.
- Pace
- Average Early (E1), Mid (E2), and Stretch (LP) pace figures — reveals pace-setters vs. closers vs. all-the-way types.
- This horse
- The horse whose stats card is open is highlighted with a darker column background.
Winning Profiles
- Axes
- X: Win % from last 10 starts — Y: In-the-money % (top-3 finishes) from last 10 starts.
- Quadrants
- Consistent Winners (top-right): high win & ITM — reliable performers.
Place Threats (top-left): boards often but doesn’t win often — good exacta/trifecta angles.
Streaky (bottom-right): wins occasionally, misses the board often — all-or-nothing.
Developing (bottom-left): still finding form — longshot territory. - Reference Lines
- Dashed lines mark field averages. Dots to the right win more; dots higher board more.
- This horse
- Highlighted with a gold border and larger dot.
AI Model Comparison
- Winner Models (green)
- Mod1(W), Mod2(W), and Mod3(W) trained to predict race winners. Higher score = stronger contender.
- Longshot Models (red)
- Mod1-LS, Mod2-LS, and Mod3-LS trained to find high-value longshots. Higher score = stronger longshot candidate.
- Form Model (blue)
- Mod4 sequence model trained on recent form patterns. Higher score = stronger recent form profile.
- This horse
- Highlighted with a darker column background.
Race Pace Simulation Guide
- Slider
- Drag left→right to advance from gate to finish. Drag all the way back to reset the race.
- Predicted Finish Order
- Factors in contested pace burn, each horse’s effort curve (peaked-early vs. peaked-late), and wide trip cost from outside posts. Updated live when Track Bias changes.
- Pace Scenario
- Lone Speed: single E horse likely rates and holds. Contested: two E horses burn each other — closers benefit. Hot Pace: speed meltdown, deep closers thrive. Soft: no early speed, moderate fractions throughout.
- Track Bias
- Slider below canvas. −2 = strong closer/wet bias; +2 = strong speed/rail bias. Recomputes the predicted finish order.
- Boxed Indicator
- Dashed orange ring = horse is surrounded (rival ahead, rival behind, wall outside). In a real race this horse must find a clear path to run.
- Running Styles
- E/EE = early speed (rushes to rail). P = presser (stalks the pace). S = stalker. SS = slow starter / closer.
| Stat | vs. Current Card | vs. All Horses |
|---|---|---|
| Averages
Career-average metrics across all AI race analysis. Performance and pace averages reflect estimated historical performance; trainer and jockey grades score in-the-money percentages. Grading scale: A = elite • B = above average • C = average • D = below average • F = poor • — = no data |
||
| Pick Pony AI Rating | B | C |
| Pace Trip Longshot | — | — |
| Connections Longshot | — | — |
| Situational Longshot | — | — |
| Speed | C | B |
| Early Pace | C | B |
| Mid Pace | A | A |
| Late Pace | D | C |
| Finish Pos | C | B |
| Dirt Speed | C | B |
| Turf Speed | D | D |
| Distance Speed | A | C |
| Trainer Effectiveness | C | C |
| Jockey Effectiveness | B | C |
| 3rd Party Ratings | D | B |
| Recent
Performance analysis from the horse's recent races, weighted to reflect current form. Sprint and Route FPS (Foot Per Second) measure pace efficiency over the horse's recent sprints and routes respectively. Grading scale: A = elite • B = above average • C = average • D = below average • F = poor • — = no data |
||
| Speed | D | C |
| Early Pace | C | B |
| Mid Pace | A | A |
| Late Pace | D | C |
| Sprint FPS | D | C |
| Route FPS | B | C |
| Trainer Effectiveness | C | C |
| Jockey Effectiveness | B | C |
| 3rd Party Ratings | D | B |
| Predictions
AI-generated projections for the upcoming race, derived from prior AI analysis for speed and pace trends, surface and distance suitability, and current conditions. Grading scale: A = elite • B = above average • C = average • D = below average • F = poor • — = no data |
||
| Speed | C | C |
| Early Pace | B | B |
| Mid Pace | A | A |
| Late Pace | C | C |
Chart Guide (2.0.36)
- Bubbles
- Color = surface: green (turf), brown (dirt), blue (synthetic)
- Top number = finishing position; bottom number in parentheses = starting post position
- Height above line = beaten lengths — closer means a smaller margin
- Border = track conditions: green (FST/GD/FM), yellow (WF/SL/YLD), red (SY/MY/FRZ/SFT/HVY)
- Connecting Line
- Solid = good conditions; dashed = bad conditions
- Line Symbol
- ▲ Triangle = sprint (7f or less); ● Circle = route (more than 7f)
- Days Between Races
- Small number above each bubble (e.g. 19d) = days since the previous race — helps spot freshness, layoffs, and tight scheduling.
- Shaded Band (Bollinger)
- Highlights volatility — a wider band means more variation in recent performance
- Performance Trend
- Straight line showing the overall performance direction — angled up = improving, angled down = declining
- Dashed Reference Line
- AI Opponent = AI analysis class-level par for the race
AI Model History Guide
- Lines
- Each solid line shows this horse’s model score over its last 10 races: blue = Mod1, green = Mod2, amber = Mod3.
- Dashed Lines
- Dashed lines represent the current race’s field average for each model — a score below the dashed line indicates the horse ranked below average in this model’s assessment.
- Higher is Stronger
- All three model scores are 0–100: a higher number means the model rates this horse more favorably among the field.
Mod1(W): 82 (1/8) Mod2(W): 75 (2/8) Mod3(W): 79 (3/8) Mod1-LS: 55 (6/8) Win Prob: 18.4% Value Score: 1.35 ★
Performance vs. Peers Guide
- Bars (per post)
- Blue = avg career performance • Amber = avg last 3 races • Green = last race (improved vs. avg) • Red = last race (declined vs. avg)
- Trend Line
- Angled line above the bars: rising = improving form • falling = declining form.
- Horizontal Line
- Field average — the mean career performance of all horses in this race.
- Color Circles
- Standard post-position colors below each lane — same as the Total Pace chart.
- Border
- Thicker border = this horse’s post position.
Figure Comparison
- Rating
- The three Pick Pony algorithm ratings (Algo 1, Algo 2, Algo 3) that make up the overall PP AI Rating — higher is a stronger contender rating.
- Speed
- Career average speed, recent 3-race average, and last-race speed figure — spot horses in improving or declining form.
- Pace
- Average Early (E1), Mid (E2), and Stretch (LP) pace figures — reveals pace-setters vs. closers vs. all-the-way types.
- This horse
- The horse whose stats card is open is highlighted with a darker column background.
Winning Profiles
- Axes
- X: Win % from last 10 starts — Y: In-the-money % (top-3 finishes) from last 10 starts.
- Quadrants
- Consistent Winners (top-right): high win & ITM — reliable performers.
Place Threats (top-left): boards often but doesn’t win often — good exacta/trifecta angles.
Streaky (bottom-right): wins occasionally, misses the board often — all-or-nothing.
Developing (bottom-left): still finding form — longshot territory. - Reference Lines
- Dashed lines mark field averages. Dots to the right win more; dots higher board more.
- This horse
- Highlighted with a gold border and larger dot.
AI Model Comparison
- Winner Models (green)
- Mod1(W), Mod2(W), and Mod3(W) trained to predict race winners. Higher score = stronger contender.
- Longshot Models (red)
- Mod1-LS, Mod2-LS, and Mod3-LS trained to find high-value longshots. Higher score = stronger longshot candidate.
- Form Model (blue)
- Mod4 sequence model trained on recent form patterns. Higher score = stronger recent form profile.
- This horse
- Highlighted with a darker column background.
Race Pace Simulation Guide
- Slider
- Drag left→right to advance from gate to finish. Drag all the way back to reset the race.
- Predicted Finish Order
- Factors in contested pace burn, each horse’s effort curve (peaked-early vs. peaked-late), and wide trip cost from outside posts. Updated live when Track Bias changes.
- Pace Scenario
- Lone Speed: single E horse likely rates and holds. Contested: two E horses burn each other — closers benefit. Hot Pace: speed meltdown, deep closers thrive. Soft: no early speed, moderate fractions throughout.
- Track Bias
- Slider below canvas. −2 = strong closer/wet bias; +2 = strong speed/rail bias. Recomputes the predicted finish order.
- Boxed Indicator
- Dashed orange ring = horse is surrounded (rival ahead, rival behind, wall outside). In a real race this horse must find a clear path to run.
- Running Styles
- E/EE = early speed (rushes to rail). P = presser (stalks the pace). S = stalker. SS = slow starter / closer.
| Stat | vs. Current Card | vs. All Horses |
|---|---|---|
| Averages
Career-average metrics across all AI race analysis. Performance and pace averages reflect estimated historical performance; trainer and jockey grades score in-the-money percentages. Grading scale: A = elite • B = above average • C = average • D = below average • F = poor • — = no data |
||
| Pick Pony AI Rating | A | B |
| Pace Trip Longshot | — | — |
| Connections Longshot | — | — |
| Situational Longshot | — | — |
| Speed | C | B |
| Early Pace | A | B |
| Mid Pace | B | B |
| Late Pace | F | B |
| Finish Pos | B | B |
| Dirt Speed | D | A |
| Turf Speed | F | D |
| Distance Speed | A | A |
| Trainer Effectiveness | A | A |
| Jockey Effectiveness | A | A |
| 3rd Party Ratings | B | A |
| Recent
Performance analysis from the horse's recent races, weighted to reflect current form. Sprint and Route FPS (Foot Per Second) measure pace efficiency over the horse's recent sprints and routes respectively. Grading scale: A = elite • B = above average • C = average • D = below average • F = poor • — = no data |
||
| Speed | A | A |
| Early Pace | B | C |
| Mid Pace | B | B |
| Late Pace | A | A |
| Sprint FPS | A | A |
| Route FPS | A | B |
| Trainer Effectiveness | A | A |
| Jockey Effectiveness | A | A |
| 3rd Party Ratings | B | A |
| Predictions
AI-generated projections for the upcoming race, derived from prior AI analysis for speed and pace trends, surface and distance suitability, and current conditions. Grading scale: A = elite • B = above average • C = average • D = below average • F = poor • — = no data |
||
| Speed | B | B |
| Early Pace | A | B |
| Mid Pace | B | B |
| Late Pace | C | C |
Chart Guide (2.0.36)
- Bubbles
- Color = surface: green (turf), brown (dirt), blue (synthetic)
- Top number = finishing position; bottom number in parentheses = starting post position
- Height above line = beaten lengths — closer means a smaller margin
- Border = track conditions: green (FST/GD/FM), yellow (WF/SL/YLD), red (SY/MY/FRZ/SFT/HVY)
- Connecting Line
- Solid = good conditions; dashed = bad conditions
- Line Symbol
- ▲ Triangle = sprint (7f or less); ● Circle = route (more than 7f)
- Days Between Races
- Small number above each bubble (e.g. 19d) = days since the previous race — helps spot freshness, layoffs, and tight scheduling.
- Shaded Band (Bollinger)
- Highlights volatility — a wider band means more variation in recent performance
- Performance Trend
- Straight line showing the overall performance direction — angled up = improving, angled down = declining
- Dashed Reference Line
- AI Opponent = AI analysis class-level par for the race
AI Model History Guide
- Lines
- Each solid line shows this horse’s model score over its last 10 races: blue = Mod1, green = Mod2, amber = Mod3.
- Dashed Lines
- Dashed lines represent the current race’s field average for each model — a score below the dashed line indicates the horse ranked below average in this model’s assessment.
- Higher is Stronger
- All three model scores are 0–100: a higher number means the model rates this horse more favorably among the field.
Mod1(W): 82 (1/8) Mod2(W): 75 (2/8) Mod3(W): 79 (3/8) Mod1-LS: 55 (6/8) Win Prob: 18.4% Value Score: 1.35 ★
Performance vs. Peers Guide
- Bars (per post)
- Blue = avg career performance • Amber = avg last 3 races • Green = last race (improved vs. avg) • Red = last race (declined vs. avg)
- Trend Line
- Angled line above the bars: rising = improving form • falling = declining form.
- Horizontal Line
- Field average — the mean career performance of all horses in this race.
- Color Circles
- Standard post-position colors below each lane — same as the Total Pace chart.
- Border
- Thicker border = this horse’s post position.
Figure Comparison
- Rating
- The three Pick Pony algorithm ratings (Algo 1, Algo 2, Algo 3) that make up the overall PP AI Rating — higher is a stronger contender rating.
- Speed
- Career average speed, recent 3-race average, and last-race speed figure — spot horses in improving or declining form.
- Pace
- Average Early (E1), Mid (E2), and Stretch (LP) pace figures — reveals pace-setters vs. closers vs. all-the-way types.
- This horse
- The horse whose stats card is open is highlighted with a darker column background.
Winning Profiles
- Axes
- X: Win % from last 10 starts — Y: In-the-money % (top-3 finishes) from last 10 starts.
- Quadrants
- Consistent Winners (top-right): high win & ITM — reliable performers.
Place Threats (top-left): boards often but doesn’t win often — good exacta/trifecta angles.
Streaky (bottom-right): wins occasionally, misses the board often — all-or-nothing.
Developing (bottom-left): still finding form — longshot territory. - Reference Lines
- Dashed lines mark field averages. Dots to the right win more; dots higher board more.
- This horse
- Highlighted with a gold border and larger dot.
AI Model Comparison
- Winner Models (green)
- Mod1(W), Mod2(W), and Mod3(W) trained to predict race winners. Higher score = stronger contender.
- Longshot Models (red)
- Mod1-LS, Mod2-LS, and Mod3-LS trained to find high-value longshots. Higher score = stronger longshot candidate.
- Form Model (blue)
- Mod4 sequence model trained on recent form patterns. Higher score = stronger recent form profile.
- This horse
- Highlighted with a darker column background.
Race Pace Simulation Guide
- Slider
- Drag left→right to advance from gate to finish. Drag all the way back to reset the race.
- Predicted Finish Order
- Factors in contested pace burn, each horse’s effort curve (peaked-early vs. peaked-late), and wide trip cost from outside posts. Updated live when Track Bias changes.
- Pace Scenario
- Lone Speed: single E horse likely rates and holds. Contested: two E horses burn each other — closers benefit. Hot Pace: speed meltdown, deep closers thrive. Soft: no early speed, moderate fractions throughout.
- Track Bias
- Slider below canvas. −2 = strong closer/wet bias; +2 = strong speed/rail bias. Recomputes the predicted finish order.
- Boxed Indicator
- Dashed orange ring = horse is surrounded (rival ahead, rival behind, wall outside). In a real race this horse must find a clear path to run.
- Running Styles
- E/EE = early speed (rushes to rail). P = presser (stalks the pace). S = stalker. SS = slow starter / closer.
| Stat | vs. Current Card | vs. All Horses |
|---|---|---|
| Averages
Career-average metrics across all AI race analysis. Performance and pace averages reflect estimated historical performance; trainer and jockey grades score in-the-money percentages. Grading scale: A = elite • B = above average • C = average • D = below average • F = poor • — = no data |
||
| Pick Pony AI Rating | A | B |
| Pace Trip Longshot | — | — |
| Connections Longshot | — | — |
| Situational Longshot | — | — |
| Speed | A | A |
| Early Pace | B | C |
| Mid Pace | A | B |
| Late Pace | B | A |
| Finish Pos | A | B |
| Dirt Speed | B | A |
| Turf Speed | A | A |
| Distance Speed | B | A |
| Trainer Effectiveness | A | B |
| Jockey Effectiveness | D | C |
| 3rd Party Ratings | A | A |
| Recent
Performance analysis from the horse's recent races, weighted to reflect current form. Sprint and Route FPS (Foot Per Second) measure pace efficiency over the horse's recent sprints and routes respectively. Grading scale: A = elite • B = above average • C = average • D = below average • F = poor • — = no data |
||
| Speed | C | A |
| Early Pace | B | C |
| Mid Pace | B | B |
| Late Pace | D | B |
| Sprint FPS | A | B |
| Route FPS | B | C |
| Trainer Effectiveness | A | B |
| Jockey Effectiveness | D | C |
| 3rd Party Ratings | A | A |
| Predictions
AI-generated projections for the upcoming race, derived from prior AI analysis for speed and pace trends, surface and distance suitability, and current conditions. Grading scale: A = elite • B = above average • C = average • D = below average • F = poor • — = no data |
||
| Speed | C | B |
| Early Pace | B | C |
| Mid Pace | A | B |
| Late Pace | C | C |
Chart Guide (2.0.36)
- Bubbles
- Color = surface: green (turf), brown (dirt), blue (synthetic)
- Top number = finishing position; bottom number in parentheses = starting post position
- Height above line = beaten lengths — closer means a smaller margin
- Border = track conditions: green (FST/GD/FM), yellow (WF/SL/YLD), red (SY/MY/FRZ/SFT/HVY)
- Connecting Line
- Solid = good conditions; dashed = bad conditions
- Line Symbol
- ▲ Triangle = sprint (7f or less); ● Circle = route (more than 7f)
- Days Between Races
- Small number above each bubble (e.g. 19d) = days since the previous race — helps spot freshness, layoffs, and tight scheduling.
- Shaded Band (Bollinger)
- Highlights volatility — a wider band means more variation in recent performance
- Performance Trend
- Straight line showing the overall performance direction — angled up = improving, angled down = declining
- Dashed Reference Line
- AI Opponent = AI analysis class-level par for the race
AI Model History Guide
- Lines
- Each solid line shows this horse’s model score over its last 10 races: blue = Mod1, green = Mod2, amber = Mod3.
- Dashed Lines
- Dashed lines represent the current race’s field average for each model — a score below the dashed line indicates the horse ranked below average in this model’s assessment.
- Higher is Stronger
- All three model scores are 0–100: a higher number means the model rates this horse more favorably among the field.
Mod1(W): 82 (1/8) Mod2(W): 75 (2/8) Mod3(W): 79 (3/8) Mod1-LS: 55 (6/8) Win Prob: 18.4% Value Score: 1.35 ★
Performance vs. Peers Guide
- Bars (per post)
- Blue = avg career performance • Amber = avg last 3 races • Green = last race (improved vs. avg) • Red = last race (declined vs. avg)
- Trend Line
- Angled line above the bars: rising = improving form • falling = declining form.
- Horizontal Line
- Field average — the mean career performance of all horses in this race.
- Color Circles
- Standard post-position colors below each lane — same as the Total Pace chart.
- Border
- Thicker border = this horse’s post position.
Figure Comparison
- Rating
- The three Pick Pony algorithm ratings (Algo 1, Algo 2, Algo 3) that make up the overall PP AI Rating — higher is a stronger contender rating.
- Speed
- Career average speed, recent 3-race average, and last-race speed figure — spot horses in improving or declining form.
- Pace
- Average Early (E1), Mid (E2), and Stretch (LP) pace figures — reveals pace-setters vs. closers vs. all-the-way types.
- This horse
- The horse whose stats card is open is highlighted with a darker column background.
Winning Profiles
- Axes
- X: Win % from last 10 starts — Y: In-the-money % (top-3 finishes) from last 10 starts.
- Quadrants
- Consistent Winners (top-right): high win & ITM — reliable performers.
Place Threats (top-left): boards often but doesn’t win often — good exacta/trifecta angles.
Streaky (bottom-right): wins occasionally, misses the board often — all-or-nothing.
Developing (bottom-left): still finding form — longshot territory. - Reference Lines
- Dashed lines mark field averages. Dots to the right win more; dots higher board more.
- This horse
- Highlighted with a gold border and larger dot.
AI Model Comparison
- Winner Models (green)
- Mod1(W), Mod2(W), and Mod3(W) trained to predict race winners. Higher score = stronger contender.
- Longshot Models (red)
- Mod1-LS, Mod2-LS, and Mod3-LS trained to find high-value longshots. Higher score = stronger longshot candidate.
- Form Model (blue)
- Mod4 sequence model trained on recent form patterns. Higher score = stronger recent form profile.
- This horse
- Highlighted with a darker column background.
Race Pace Simulation Guide
- Slider
- Drag left→right to advance from gate to finish. Drag all the way back to reset the race.
- Predicted Finish Order
- Factors in contested pace burn, each horse’s effort curve (peaked-early vs. peaked-late), and wide trip cost from outside posts. Updated live when Track Bias changes.
- Pace Scenario
- Lone Speed: single E horse likely rates and holds. Contested: two E horses burn each other — closers benefit. Hot Pace: speed meltdown, deep closers thrive. Soft: no early speed, moderate fractions throughout.
- Track Bias
- Slider below canvas. −2 = strong closer/wet bias; +2 = strong speed/rail bias. Recomputes the predicted finish order.
- Boxed Indicator
- Dashed orange ring = horse is surrounded (rival ahead, rival behind, wall outside). In a real race this horse must find a clear path to run.
- Running Styles
- E/EE = early speed (rushes to rail). P = presser (stalks the pace). S = stalker. SS = slow starter / closer.
| Stat | vs. Current Card | vs. All Horses |
|---|---|---|
| Averages
Career-average metrics across all AI race analysis. Performance and pace averages reflect estimated historical performance; trainer and jockey grades score in-the-money percentages. Grading scale: A = elite • B = above average • C = average • D = below average • F = poor • — = no data |
||
| Pick Pony AI Rating | B | B |
| Pace Trip Longshot | — | — |
| Connections Longshot | — | — |
| Situational Longshot | — | — |
| Speed | B | A |
| Early Pace | D | D |
| Mid Pace | C | C |
| Late Pace | A | A |
| Finish Pos | A | A |
| Dirt Speed | A | A |
| Turf Speed | C | B |
| Distance Speed | D | F |
| Trainer Effectiveness | B | B |
| Jockey Effectiveness | D | C |
| 3rd Party Ratings | A | A |
| Recent
Performance analysis from the horse's recent races, weighted to reflect current form. Sprint and Route FPS (Foot Per Second) measure pace efficiency over the horse's recent sprints and routes respectively. Grading scale: A = elite • B = above average • C = average • D = below average • F = poor • — = no data |
||
| Speed | B | A |
| Early Pace | D | D |
| Mid Pace | C | C |
| Late Pace | B | A |
| Sprint FPS | D | D |
| Route FPS | B | C |
| Trainer Effectiveness | B | B |
| Jockey Effectiveness | D | C |
| 3rd Party Ratings | A | A |
| Predictions
AI-generated projections for the upcoming race, derived from prior AI analysis for speed and pace trends, surface and distance suitability, and current conditions. Grading scale: A = elite • B = above average • C = average • D = below average • F = poor • — = no data |
||
| Speed | A | B |
| Early Pace | D | D |
| Mid Pace | D | C |
| Late Pace | C | C |
Chart Guide (2.0.36)
- Bubbles
- Color = surface: green (turf), brown (dirt), blue (synthetic)
- Top number = finishing position; bottom number in parentheses = starting post position
- Height above line = beaten lengths — closer means a smaller margin
- Border = track conditions: green (FST/GD/FM), yellow (WF/SL/YLD), red (SY/MY/FRZ/SFT/HVY)
- Connecting Line
- Solid = good conditions; dashed = bad conditions
- Line Symbol
- ▲ Triangle = sprint (7f or less); ● Circle = route (more than 7f)
- Days Between Races
- Small number above each bubble (e.g. 19d) = days since the previous race — helps spot freshness, layoffs, and tight scheduling.
- Shaded Band (Bollinger)
- Highlights volatility — a wider band means more variation in recent performance
- Performance Trend
- Straight line showing the overall performance direction — angled up = improving, angled down = declining
- Dashed Reference Line
- AI Opponent = AI analysis class-level par for the race
AI Model History Guide
- Lines
- Each solid line shows this horse’s model score over its last 10 races: blue = Mod1, green = Mod2, amber = Mod3.
- Dashed Lines
- Dashed lines represent the current race’s field average for each model — a score below the dashed line indicates the horse ranked below average in this model’s assessment.
- Higher is Stronger
- All three model scores are 0–100: a higher number means the model rates this horse more favorably among the field.
Mod1(W): 82 (1/8) Mod2(W): 75 (2/8) Mod3(W): 79 (3/8) Mod1-LS: 55 (6/8) Win Prob: 18.4% Value Score: 1.35 ★
Performance vs. Peers Guide
- Bars (per post)
- Blue = avg career performance • Amber = avg last 3 races • Green = last race (improved vs. avg) • Red = last race (declined vs. avg)
- Trend Line
- Angled line above the bars: rising = improving form • falling = declining form.
- Horizontal Line
- Field average — the mean career performance of all horses in this race.
- Color Circles
- Standard post-position colors below each lane — same as the Total Pace chart.
- Border
- Thicker border = this horse’s post position.
Figure Comparison
- Rating
- The three Pick Pony algorithm ratings (Algo 1, Algo 2, Algo 3) that make up the overall PP AI Rating — higher is a stronger contender rating.
- Speed
- Career average speed, recent 3-race average, and last-race speed figure — spot horses in improving or declining form.
- Pace
- Average Early (E1), Mid (E2), and Stretch (LP) pace figures — reveals pace-setters vs. closers vs. all-the-way types.
- This horse
- The horse whose stats card is open is highlighted with a darker column background.
Winning Profiles
- Axes
- X: Win % from last 10 starts — Y: In-the-money % (top-3 finishes) from last 10 starts.
- Quadrants
- Consistent Winners (top-right): high win & ITM — reliable performers.
Place Threats (top-left): boards often but doesn’t win often — good exacta/trifecta angles.
Streaky (bottom-right): wins occasionally, misses the board often — all-or-nothing.
Developing (bottom-left): still finding form — longshot territory. - Reference Lines
- Dashed lines mark field averages. Dots to the right win more; dots higher board more.
- This horse
- Highlighted with a gold border and larger dot.
AI Model Comparison
- Winner Models (green)
- Mod1(W), Mod2(W), and Mod3(W) trained to predict race winners. Higher score = stronger contender.
- Longshot Models (red)
- Mod1-LS, Mod2-LS, and Mod3-LS trained to find high-value longshots. Higher score = stronger longshot candidate.
- Form Model (blue)
- Mod4 sequence model trained on recent form patterns. Higher score = stronger recent form profile.
- This horse
- Highlighted with a darker column background.
Race Pace Simulation Guide
- Slider
- Drag left→right to advance from gate to finish. Drag all the way back to reset the race.
- Predicted Finish Order
- Factors in contested pace burn, each horse’s effort curve (peaked-early vs. peaked-late), and wide trip cost from outside posts. Updated live when Track Bias changes.
- Pace Scenario
- Lone Speed: single E horse likely rates and holds. Contested: two E horses burn each other — closers benefit. Hot Pace: speed meltdown, deep closers thrive. Soft: no early speed, moderate fractions throughout.
- Track Bias
- Slider below canvas. −2 = strong closer/wet bias; +2 = strong speed/rail bias. Recomputes the predicted finish order.
- Boxed Indicator
- Dashed orange ring = horse is surrounded (rival ahead, rival behind, wall outside). In a real race this horse must find a clear path to run.
- Running Styles
- E/EE = early speed (rushes to rail). P = presser (stalks the pace). S = stalker. SS = slow starter / closer.
| Stat | vs. Current Card | vs. All Horses |
|---|---|---|
| Averages
Career-average metrics across all AI race analysis. Performance and pace averages reflect estimated historical performance; trainer and jockey grades score in-the-money percentages. Grading scale: A = elite • B = above average • C = average • D = below average • F = poor • — = no data |
||
| Pick Pony AI Rating | A | B |
| Pace Trip Longshot | — | — |
| Connections Longshot | — | — |
| Situational Longshot | — | — |
| Speed | C | B |
| Early Pace | C | B |
| Mid Pace | B | A |
| Late Pace | D | B |
| Finish Pos | D | B |
| Dirt Speed | C | B |
| Turf Speed | C | D |
| Distance Speed | C | F |
| Trainer Effectiveness | A | A |
| Jockey Effectiveness | A | A |
| 3rd Party Ratings | C | A |
| Recent
Performance analysis from the horse's recent races, weighted to reflect current form. Sprint and Route FPS (Foot Per Second) measure pace efficiency over the horse's recent sprints and routes respectively. Grading scale: A = elite • B = above average • C = average • D = below average • F = poor • — = no data |
||
| Speed | A | A |
| Early Pace | C | A |
| Mid Pace | A | A |
| Late Pace | B | A |
| Sprint FPS | D | B |
| Route FPS | B | A |
| Trainer Effectiveness | A | A |
| Jockey Effectiveness | A | A |
| 3rd Party Ratings | C | A |
| Predictions
AI-generated projections for the upcoming race, derived from prior AI analysis for speed and pace trends, surface and distance suitability, and current conditions. Grading scale: A = elite • B = above average • C = average • D = below average • F = poor • — = no data |
||
| Speed | A | A |
| Early Pace | C | B |
| Mid Pace | B | A |
| Late Pace | C | C |
Chart Guide (2.0.36)
- Bubbles
- Color = surface: green (turf), brown (dirt), blue (synthetic)
- Top number = finishing position; bottom number in parentheses = starting post position
- Height above line = beaten lengths — closer means a smaller margin
- Border = track conditions: green (FST/GD/FM), yellow (WF/SL/YLD), red (SY/MY/FRZ/SFT/HVY)
- Connecting Line
- Solid = good conditions; dashed = bad conditions
- Line Symbol
- ▲ Triangle = sprint (7f or less); ● Circle = route (more than 7f)
- Days Between Races
- Small number above each bubble (e.g. 19d) = days since the previous race — helps spot freshness, layoffs, and tight scheduling.
- Shaded Band (Bollinger)
- Highlights volatility — a wider band means more variation in recent performance
- Performance Trend
- Straight line showing the overall performance direction — angled up = improving, angled down = declining
- Dashed Reference Line
- AI Opponent = AI analysis class-level par for the race
AI Model History Guide
- Lines
- Each solid line shows this horse’s model score over its last 10 races: blue = Mod1, green = Mod2, amber = Mod3.
- Dashed Lines
- Dashed lines represent the current race’s field average for each model — a score below the dashed line indicates the horse ranked below average in this model’s assessment.
- Higher is Stronger
- All three model scores are 0–100: a higher number means the model rates this horse more favorably among the field.
Mod1(W): 82 (1/8) Mod2(W): 75 (2/8) Mod3(W): 79 (3/8) Mod1-LS: 55 (6/8) Win Prob: 18.4% Value Score: 1.35 ★
Performance vs. Peers Guide
- Bars (per post)
- Blue = avg career performance • Amber = avg last 3 races • Green = last race (improved vs. avg) • Red = last race (declined vs. avg)
- Trend Line
- Angled line above the bars: rising = improving form • falling = declining form.
- Horizontal Line
- Field average — the mean career performance of all horses in this race.
- Color Circles
- Standard post-position colors below each lane — same as the Total Pace chart.
- Border
- Thicker border = this horse’s post position.
Figure Comparison
- Rating
- The three Pick Pony algorithm ratings (Algo 1, Algo 2, Algo 3) that make up the overall PP AI Rating — higher is a stronger contender rating.
- Speed
- Career average speed, recent 3-race average, and last-race speed figure — spot horses in improving or declining form.
- Pace
- Average Early (E1), Mid (E2), and Stretch (LP) pace figures — reveals pace-setters vs. closers vs. all-the-way types.
- This horse
- The horse whose stats card is open is highlighted with a darker column background.
Winning Profiles
- Axes
- X: Win % from last 10 starts — Y: In-the-money % (top-3 finishes) from last 10 starts.
- Quadrants
- Consistent Winners (top-right): high win & ITM — reliable performers.
Place Threats (top-left): boards often but doesn’t win often — good exacta/trifecta angles.
Streaky (bottom-right): wins occasionally, misses the board often — all-or-nothing.
Developing (bottom-left): still finding form — longshot territory. - Reference Lines
- Dashed lines mark field averages. Dots to the right win more; dots higher board more.
- This horse
- Highlighted with a gold border and larger dot.
AI Model Comparison
- Winner Models (green)
- Mod1(W), Mod2(W), and Mod3(W) trained to predict race winners. Higher score = stronger contender.
- Longshot Models (red)
- Mod1-LS, Mod2-LS, and Mod3-LS trained to find high-value longshots. Higher score = stronger longshot candidate.
- Form Model (blue)
- Mod4 sequence model trained on recent form patterns. Higher score = stronger recent form profile.
- This horse
- Highlighted with a darker column background.
Race Pace Simulation Guide
- Slider
- Drag left→right to advance from gate to finish. Drag all the way back to reset the race.
- Predicted Finish Order
- Factors in contested pace burn, each horse’s effort curve (peaked-early vs. peaked-late), and wide trip cost from outside posts. Updated live when Track Bias changes.
- Pace Scenario
- Lone Speed: single E horse likely rates and holds. Contested: two E horses burn each other — closers benefit. Hot Pace: speed meltdown, deep closers thrive. Soft: no early speed, moderate fractions throughout.
- Track Bias
- Slider below canvas. −2 = strong closer/wet bias; +2 = strong speed/rail bias. Recomputes the predicted finish order.
- Boxed Indicator
- Dashed orange ring = horse is surrounded (rival ahead, rival behind, wall outside). In a real race this horse must find a clear path to run.
- Running Styles
- E/EE = early speed (rushes to rail). P = presser (stalks the pace). S = stalker. SS = slow starter / closer.
| Stat | vs. Current Card | vs. All Horses |
|---|---|---|
| Averages
Career-average metrics across all AI race analysis. Performance and pace averages reflect estimated historical performance; trainer and jockey grades score in-the-money percentages. Grading scale: A = elite • B = above average • C = average • D = below average • F = poor • — = no data |
||
| Pick Pony AI Rating | B | C |
| Pace Trip Longshot | — | — |
| Connections Longshot | — | — |
| Situational Longshot | — | — |
| Speed | A | A |
| Early Pace | D | B |
| Mid Pace | C | A |
| Late Pace | A | A |
| Finish Pos | A | A |
| Dirt Speed | A | A |
| Turf Speed | A | B |
| Distance Speed | C | F |
| Trainer Effectiveness | A | B |
| Jockey Effectiveness | B | B |
| 3rd Party Ratings | B | A |
| Recent
Performance analysis from the horse's recent races, weighted to reflect current form. Sprint and Route FPS (Foot Per Second) measure pace efficiency over the horse's recent sprints and routes respectively. Grading scale: A = elite • B = above average • C = average • D = below average • F = poor • — = no data |
||
| Speed | B | A |
| Early Pace | D | B |
| Mid Pace | C | A |
| Late Pace | A | A |
| Sprint FPS | F | C |
| Route FPS | D | B |
| Trainer Effectiveness | A | B |
| Jockey Effectiveness | B | B |
| 3rd Party Ratings | B | A |
| Predictions
AI-generated projections for the upcoming race, derived from prior AI analysis for speed and pace trends, surface and distance suitability, and current conditions. Grading scale: A = elite • B = above average • C = average • D = below average • F = poor • — = no data |
||
| Speed | B | A |
| Early Pace | D | B |
| Mid Pace | C | A |
| Late Pace | C | C |
Chart Guide (2.0.36)
- Bubbles
- Color = surface: green (turf), brown (dirt), blue (synthetic)
- Top number = finishing position; bottom number in parentheses = starting post position
- Height above line = beaten lengths — closer means a smaller margin
- Border = track conditions: green (FST/GD/FM), yellow (WF/SL/YLD), red (SY/MY/FRZ/SFT/HVY)
- Connecting Line
- Solid = good conditions; dashed = bad conditions
- Line Symbol
- ▲ Triangle = sprint (7f or less); ● Circle = route (more than 7f)
- Days Between Races
- Small number above each bubble (e.g. 19d) = days since the previous race — helps spot freshness, layoffs, and tight scheduling.
- Shaded Band (Bollinger)
- Highlights volatility — a wider band means more variation in recent performance
- Performance Trend
- Straight line showing the overall performance direction — angled up = improving, angled down = declining
- Dashed Reference Line
- AI Opponent = AI analysis class-level par for the race
AI Model History Guide
- Lines
- Each solid line shows this horse’s model score over its last 10 races: blue = Mod1, green = Mod2, amber = Mod3.
- Dashed Lines
- Dashed lines represent the current race’s field average for each model — a score below the dashed line indicates the horse ranked below average in this model’s assessment.
- Higher is Stronger
- All three model scores are 0–100: a higher number means the model rates this horse more favorably among the field.
Mod1(W): 82 (1/8) Mod2(W): 75 (2/8) Mod3(W): 79 (3/8) Mod1-LS: 55 (6/8) Win Prob: 18.4% Value Score: 1.35 ★
Performance vs. Peers Guide
- Bars (per post)
- Blue = avg career performance • Amber = avg last 3 races • Green = last race (improved vs. avg) • Red = last race (declined vs. avg)
- Trend Line
- Angled line above the bars: rising = improving form • falling = declining form.
- Horizontal Line
- Field average — the mean career performance of all horses in this race.
- Color Circles
- Standard post-position colors below each lane — same as the Total Pace chart.
- Border
- Thicker border = this horse’s post position.
Figure Comparison
- Rating
- The three Pick Pony algorithm ratings (Algo 1, Algo 2, Algo 3) that make up the overall PP AI Rating — higher is a stronger contender rating.
- Speed
- Career average speed, recent 3-race average, and last-race speed figure — spot horses in improving or declining form.
- Pace
- Average Early (E1), Mid (E2), and Stretch (LP) pace figures — reveals pace-setters vs. closers vs. all-the-way types.
- This horse
- The horse whose stats card is open is highlighted with a darker column background.
Winning Profiles
- Axes
- X: Win % from last 10 starts — Y: In-the-money % (top-3 finishes) from last 10 starts.
- Quadrants
- Consistent Winners (top-right): high win & ITM — reliable performers.
Place Threats (top-left): boards often but doesn’t win often — good exacta/trifecta angles.
Streaky (bottom-right): wins occasionally, misses the board often — all-or-nothing.
Developing (bottom-left): still finding form — longshot territory. - Reference Lines
- Dashed lines mark field averages. Dots to the right win more; dots higher board more.
- This horse
- Highlighted with a gold border and larger dot.
AI Model Comparison
- Winner Models (green)
- Mod1(W), Mod2(W), and Mod3(W) trained to predict race winners. Higher score = stronger contender.
- Longshot Models (red)
- Mod1-LS, Mod2-LS, and Mod3-LS trained to find high-value longshots. Higher score = stronger longshot candidate.
- Form Model (blue)
- Mod4 sequence model trained on recent form patterns. Higher score = stronger recent form profile.
- This horse
- Highlighted with a darker column background.
Race Pace Simulation Guide
- Slider
- Drag left→right to advance from gate to finish. Drag all the way back to reset the race.
- Predicted Finish Order
- Factors in contested pace burn, each horse’s effort curve (peaked-early vs. peaked-late), and wide trip cost from outside posts. Updated live when Track Bias changes.
- Pace Scenario
- Lone Speed: single E horse likely rates and holds. Contested: two E horses burn each other — closers benefit. Hot Pace: speed meltdown, deep closers thrive. Soft: no early speed, moderate fractions throughout.
- Track Bias
- Slider below canvas. −2 = strong closer/wet bias; +2 = strong speed/rail bias. Recomputes the predicted finish order.
- Boxed Indicator
- Dashed orange ring = horse is surrounded (rival ahead, rival behind, wall outside). In a real race this horse must find a clear path to run.
- Running Styles
- E/EE = early speed (rushes to rail). P = presser (stalks the pace). S = stalker. SS = slow starter / closer.
| Stat | vs. Current Card | vs. All Horses |
|---|---|---|
| Averages
Career-average metrics across all AI race analysis. Performance and pace averages reflect estimated historical performance; trainer and jockey grades score in-the-money percentages. Grading scale: A = elite • B = above average • C = average • D = below average • F = poor • — = no data |
||
| Pick Pony AI Rating | A | B |
| Pace Trip Longshot | — | — |
| Connections Longshot | — | — |
| Situational Longshot | — | — |
| Speed | A | A |
| Early Pace | A | A |
| Mid Pace | A | A |
| Late Pace | B | A |
| Finish Pos | B | A |
| Dirt Speed | A | A |
| Turf Speed | A | A |
| Distance Speed | C | F |
| Trainer Effectiveness | C | B |
| Jockey Effectiveness | A | A |
| 3rd Party Ratings | A | A |
| Recent
Performance analysis from the horse's recent races, weighted to reflect current form. Sprint and Route FPS (Foot Per Second) measure pace efficiency over the horse's recent sprints and routes respectively. Grading scale: A = elite • B = above average • C = average • D = below average • F = poor • — = no data |
||
| Speed | B | A |
| Early Pace | A | A |
| Mid Pace | A | A |
| Late Pace | D | B |
| Sprint FPS | A | A |
| Route FPS | A | A |
| Trainer Effectiveness | C | B |
| Jockey Effectiveness | A | A |
| 3rd Party Ratings | A | A |
| Predictions
AI-generated projections for the upcoming race, derived from prior AI analysis for speed and pace trends, surface and distance suitability, and current conditions. Grading scale: A = elite • B = above average • C = average • D = below average • F = poor • — = no data |
||
| Speed | A | A |
| Early Pace | A | A |
| Mid Pace | A | A |
| Late Pace | C | C |
Chart Guide (2.0.36)
- Bubbles
- Color = surface: green (turf), brown (dirt), blue (synthetic)
- Top number = finishing position; bottom number in parentheses = starting post position
- Height above line = beaten lengths — closer means a smaller margin
- Border = track conditions: green (FST/GD/FM), yellow (WF/SL/YLD), red (SY/MY/FRZ/SFT/HVY)
- Connecting Line
- Solid = good conditions; dashed = bad conditions
- Line Symbol
- ▲ Triangle = sprint (7f or less); ● Circle = route (more than 7f)
- Days Between Races
- Small number above each bubble (e.g. 19d) = days since the previous race — helps spot freshness, layoffs, and tight scheduling.
- Shaded Band (Bollinger)
- Highlights volatility — a wider band means more variation in recent performance
- Performance Trend
- Straight line showing the overall performance direction — angled up = improving, angled down = declining
- Dashed Reference Line
- AI Opponent = AI analysis class-level par for the race
AI Model History Guide
- Lines
- Each solid line shows this horse’s model score over its last 10 races: blue = Mod1, green = Mod2, amber = Mod3.
- Dashed Lines
- Dashed lines represent the current race’s field average for each model — a score below the dashed line indicates the horse ranked below average in this model’s assessment.
- Higher is Stronger
- All three model scores are 0–100: a higher number means the model rates this horse more favorably among the field.
Mod1(W): 82 (1/8) Mod2(W): 75 (2/8) Mod3(W): 79 (3/8) Mod1-LS: 55 (6/8) Win Prob: 18.4% Value Score: 1.35 ★
Performance vs. Peers Guide
- Bars (per post)
- Blue = avg career performance • Amber = avg last 3 races • Green = last race (improved vs. avg) • Red = last race (declined vs. avg)
- Trend Line
- Angled line above the bars: rising = improving form • falling = declining form.
- Horizontal Line
- Field average — the mean career performance of all horses in this race.
- Color Circles
- Standard post-position colors below each lane — same as the Total Pace chart.
- Border
- Thicker border = this horse’s post position.
Figure Comparison
- Rating
- The three Pick Pony algorithm ratings (Algo 1, Algo 2, Algo 3) that make up the overall PP AI Rating — higher is a stronger contender rating.
- Speed
- Career average speed, recent 3-race average, and last-race speed figure — spot horses in improving or declining form.
- Pace
- Average Early (E1), Mid (E2), and Stretch (LP) pace figures — reveals pace-setters vs. closers vs. all-the-way types.
- This horse
- The horse whose stats card is open is highlighted with a darker column background.
Winning Profiles
- Axes
- X: Win % from last 10 starts — Y: In-the-money % (top-3 finishes) from last 10 starts.
- Quadrants
- Consistent Winners (top-right): high win & ITM — reliable performers.
Place Threats (top-left): boards often but doesn’t win often — good exacta/trifecta angles.
Streaky (bottom-right): wins occasionally, misses the board often — all-or-nothing.
Developing (bottom-left): still finding form — longshot territory. - Reference Lines
- Dashed lines mark field averages. Dots to the right win more; dots higher board more.
- This horse
- Highlighted with a gold border and larger dot.
AI Model Comparison
- Winner Models (green)
- Mod1(W), Mod2(W), and Mod3(W) trained to predict race winners. Higher score = stronger contender.
- Longshot Models (red)
- Mod1-LS, Mod2-LS, and Mod3-LS trained to find high-value longshots. Higher score = stronger longshot candidate.
- Form Model (blue)
- Mod4 sequence model trained on recent form patterns. Higher score = stronger recent form profile.
- This horse
- Highlighted with a darker column background.
Race Pace Simulation Guide
- Slider
- Drag left→right to advance from gate to finish. Drag all the way back to reset the race.
- Predicted Finish Order
- Factors in contested pace burn, each horse’s effort curve (peaked-early vs. peaked-late), and wide trip cost from outside posts. Updated live when Track Bias changes.
- Pace Scenario
- Lone Speed: single E horse likely rates and holds. Contested: two E horses burn each other — closers benefit. Hot Pace: speed meltdown, deep closers thrive. Soft: no early speed, moderate fractions throughout.
- Track Bias
- Slider below canvas. −2 = strong closer/wet bias; +2 = strong speed/rail bias. Recomputes the predicted finish order.
- Boxed Indicator
- Dashed orange ring = horse is surrounded (rival ahead, rival behind, wall outside). In a real race this horse must find a clear path to run.
- Running Styles
- E/EE = early speed (rushes to rail). P = presser (stalks the pace). S = stalker. SS = slow starter / closer.
| Stat | vs. Current Card | vs. All Horses |
|---|---|---|
| Averages
Career-average metrics across all AI race analysis. Performance and pace averages reflect estimated historical performance; trainer and jockey grades score in-the-money percentages. Grading scale: A = elite • B = above average • C = average • D = below average • F = poor • — = no data |
||
| Pick Pony AI Rating | A | B |
| Pace Trip Longshot | — | — |
| Connections Longshot | — | — |
| Situational Longshot | — | — |
| Speed | B | D |
| Early Pace | F | D |
| Mid Pace | F | D |
| Late Pace | A | B |
| Finish Pos | B | C |
| Dirt Speed | A | C |
| Turf Speed | A | B |
| Distance Speed | A | B |
| Trainer Effectiveness | A | A |
| Jockey Effectiveness | D | C |
| 3rd Party Ratings | B | C |
| Recent
Performance analysis from the horse's recent races, weighted to reflect current form. Sprint and Route FPS (Foot Per Second) measure pace efficiency over the horse's recent sprints and routes respectively. Grading scale: A = elite • B = above average • C = average • D = below average • F = poor • — = no data |
||
| Speed | B | C |
| Early Pace | D | D |
| Mid Pace | D | C |
| Late Pace | A | B |
| Sprint FPS | F | D |
| Route FPS | C | C |
| Trainer Effectiveness | A | A |
| Jockey Effectiveness | D | C |
| 3rd Party Ratings | B | C |
| Predictions
AI-generated projections for the upcoming race, derived from prior AI analysis for speed and pace trends, surface and distance suitability, and current conditions. Grading scale: A = elite • B = above average • C = average • D = below average • F = poor • — = no data |
||
| Speed | C | D |
| Early Pace | D | D |
| Mid Pace | D | D |
| Late Pace | C | C |
Chart Guide (2.0.36)
- Bubbles
- Color = surface: green (turf), brown (dirt), blue (synthetic)
- Top number = finishing position; bottom number in parentheses = starting post position
- Height above line = beaten lengths — closer means a smaller margin
- Border = track conditions: green (FST/GD/FM), yellow (WF/SL/YLD), red (SY/MY/FRZ/SFT/HVY)
- Connecting Line
- Solid = good conditions; dashed = bad conditions
- Line Symbol
- ▲ Triangle = sprint (7f or less); ● Circle = route (more than 7f)
- Days Between Races
- Small number above each bubble (e.g. 19d) = days since the previous race — helps spot freshness, layoffs, and tight scheduling.
- Shaded Band (Bollinger)
- Highlights volatility — a wider band means more variation in recent performance
- Performance Trend
- Straight line showing the overall performance direction — angled up = improving, angled down = declining
- Dashed Reference Line
- AI Opponent = AI analysis class-level par for the race
AI Model History Guide
- Lines
- Each solid line shows this horse’s model score over its last 10 races: blue = Mod1, green = Mod2, amber = Mod3.
- Dashed Lines
- Dashed lines represent the current race’s field average for each model — a score below the dashed line indicates the horse ranked below average in this model’s assessment.
- Higher is Stronger
- All three model scores are 0–100: a higher number means the model rates this horse more favorably among the field.
Mod1(W): 82 (1/8) Mod2(W): 75 (2/8) Mod3(W): 79 (3/8) Mod1-LS: 55 (6/8) Win Prob: 18.4% Value Score: 1.35 ★
Performance vs. Peers Guide
- Bars (per post)
- Blue = avg career performance • Amber = avg last 3 races • Green = last race (improved vs. avg) • Red = last race (declined vs. avg)
- Trend Line
- Angled line above the bars: rising = improving form • falling = declining form.
- Horizontal Line
- Field average — the mean career performance of all horses in this race.
- Color Circles
- Standard post-position colors below each lane — same as the Total Pace chart.
- Border
- Thicker border = this horse’s post position.
Figure Comparison
- Rating
- The three Pick Pony algorithm ratings (Algo 1, Algo 2, Algo 3) that make up the overall PP AI Rating — higher is a stronger contender rating.
- Speed
- Career average speed, recent 3-race average, and last-race speed figure — spot horses in improving or declining form.
- Pace
- Average Early (E1), Mid (E2), and Stretch (LP) pace figures — reveals pace-setters vs. closers vs. all-the-way types.
- This horse
- The horse whose stats card is open is highlighted with a darker column background.
Winning Profiles
- Axes
- X: Win % from last 10 starts — Y: In-the-money % (top-3 finishes) from last 10 starts.
- Quadrants
- Consistent Winners (top-right): high win & ITM — reliable performers.
Place Threats (top-left): boards often but doesn’t win often — good exacta/trifecta angles.
Streaky (bottom-right): wins occasionally, misses the board often — all-or-nothing.
Developing (bottom-left): still finding form — longshot territory. - Reference Lines
- Dashed lines mark field averages. Dots to the right win more; dots higher board more.
- This horse
- Highlighted with a gold border and larger dot.
AI Model Comparison
- Winner Models (green)
- Mod1(W), Mod2(W), and Mod3(W) trained to predict race winners. Higher score = stronger contender.
- Longshot Models (red)
- Mod1-LS, Mod2-LS, and Mod3-LS trained to find high-value longshots. Higher score = stronger longshot candidate.
- Form Model (blue)
- Mod4 sequence model trained on recent form patterns. Higher score = stronger recent form profile.
- This horse
- Highlighted with a darker column background.
Race Pace Simulation Guide
- Slider
- Drag left→right to advance from gate to finish. Drag all the way back to reset the race.
- Predicted Finish Order
- Factors in contested pace burn, each horse’s effort curve (peaked-early vs. peaked-late), and wide trip cost from outside posts. Updated live when Track Bias changes.
- Pace Scenario
- Lone Speed: single E horse likely rates and holds. Contested: two E horses burn each other — closers benefit. Hot Pace: speed meltdown, deep closers thrive. Soft: no early speed, moderate fractions throughout.
- Track Bias
- Slider below canvas. −2 = strong closer/wet bias; +2 = strong speed/rail bias. Recomputes the predicted finish order.
- Boxed Indicator
- Dashed orange ring = horse is surrounded (rival ahead, rival behind, wall outside). In a real race this horse must find a clear path to run.
- Running Styles
- E/EE = early speed (rushes to rail). P = presser (stalks the pace). S = stalker. SS = slow starter / closer.
| Stat | vs. Current Card | vs. All Horses |
|---|---|---|
| Averages
Career-average metrics across all AI race analysis. Performance and pace averages reflect estimated historical performance; trainer and jockey grades score in-the-money percentages. Grading scale: A = elite • B = above average • C = average • D = below average • F = poor • — = no data |
||
| Pick Pony AI Rating | A | B |
| Pace Trip Longshot | — | — |
| Connections Longshot | — | — |
| Situational Longshot | — | — |
| Speed | A | C |
| Early Pace | A | A |
| Mid Pace | A | A |
| Late Pace | D | D |
| Finish Pos | A | B |
| Dirt Speed | A | C |
| Turf Speed | D | D |
| Distance Speed | A | C |
| Trainer Effectiveness | A | A |
| Jockey Effectiveness | A | A |
| 3rd Party Ratings | A | B |
| Recent
Performance analysis from the horse's recent races, weighted to reflect current form. Sprint and Route FPS (Foot Per Second) measure pace efficiency over the horse's recent sprints and routes respectively. Grading scale: A = elite • B = above average • C = average • D = below average • F = poor • — = no data |
||
| Speed | A | C |
| Early Pace | A | A |
| Mid Pace | A | A |
| Late Pace | A | C |
| Sprint FPS | A | A |
| Route FPS | A | A |
| Trainer Effectiveness | A | A |
| Jockey Effectiveness | A | A |
| 3rd Party Ratings | A | B |
| Predictions
AI-generated projections for the upcoming race, derived from prior AI analysis for speed and pace trends, surface and distance suitability, and current conditions. Grading scale: A = elite • B = above average • C = average • D = below average • F = poor • — = no data |
||
| Speed | B | C |
| Early Pace | B | B |
| Mid Pace | A | A |
| Late Pace | C | C |
Chart Guide (2.0.36)
- Bubbles
- Color = surface: green (turf), brown (dirt), blue (synthetic)
- Top number = finishing position; bottom number in parentheses = starting post position
- Height above line = beaten lengths — closer means a smaller margin
- Border = track conditions: green (FST/GD/FM), yellow (WF/SL/YLD), red (SY/MY/FRZ/SFT/HVY)
- Connecting Line
- Solid = good conditions; dashed = bad conditions
- Line Symbol
- ▲ Triangle = sprint (7f or less); ● Circle = route (more than 7f)
- Days Between Races
- Small number above each bubble (e.g. 19d) = days since the previous race — helps spot freshness, layoffs, and tight scheduling.
- Shaded Band (Bollinger)
- Highlights volatility — a wider band means more variation in recent performance
- Performance Trend
- Straight line showing the overall performance direction — angled up = improving, angled down = declining
- Dashed Reference Line
- AI Opponent = AI analysis class-level par for the race
AI Model History Guide
- Lines
- Each solid line shows this horse’s model score over its last 10 races: blue = Mod1, green = Mod2, amber = Mod3.
- Dashed Lines
- Dashed lines represent the current race’s field average for each model — a score below the dashed line indicates the horse ranked below average in this model’s assessment.
- Higher is Stronger
- All three model scores are 0–100: a higher number means the model rates this horse more favorably among the field.
Mod1(W): 82 (1/8) Mod2(W): 75 (2/8) Mod3(W): 79 (3/8) Mod1-LS: 55 (6/8) Win Prob: 18.4% Value Score: 1.35 ★
Performance vs. Peers Guide
- Bars (per post)
- Blue = avg career performance • Amber = avg last 3 races • Green = last race (improved vs. avg) • Red = last race (declined vs. avg)
- Trend Line
- Angled line above the bars: rising = improving form • falling = declining form.
- Horizontal Line
- Field average — the mean career performance of all horses in this race.
- Color Circles
- Standard post-position colors below each lane — same as the Total Pace chart.
- Border
- Thicker border = this horse’s post position.
Figure Comparison
- Rating
- The three Pick Pony algorithm ratings (Algo 1, Algo 2, Algo 3) that make up the overall PP AI Rating — higher is a stronger contender rating.
- Speed
- Career average speed, recent 3-race average, and last-race speed figure — spot horses in improving or declining form.
- Pace
- Average Early (E1), Mid (E2), and Stretch (LP) pace figures — reveals pace-setters vs. closers vs. all-the-way types.
- This horse
- The horse whose stats card is open is highlighted with a darker column background.
Winning Profiles
- Axes
- X: Win % from last 10 starts — Y: In-the-money % (top-3 finishes) from last 10 starts.
- Quadrants
- Consistent Winners (top-right): high win & ITM — reliable performers.
Place Threats (top-left): boards often but doesn’t win often — good exacta/trifecta angles.
Streaky (bottom-right): wins occasionally, misses the board often — all-or-nothing.
Developing (bottom-left): still finding form — longshot territory. - Reference Lines
- Dashed lines mark field averages. Dots to the right win more; dots higher board more.
- This horse
- Highlighted with a gold border and larger dot.
AI Model Comparison
- Winner Models (green)
- Mod1(W), Mod2(W), and Mod3(W) trained to predict race winners. Higher score = stronger contender.
- Longshot Models (red)
- Mod1-LS, Mod2-LS, and Mod3-LS trained to find high-value longshots. Higher score = stronger longshot candidate.
- Form Model (blue)
- Mod4 sequence model trained on recent form patterns. Higher score = stronger recent form profile.
- This horse
- Highlighted with a darker column background.
Race Pace Simulation Guide
- Slider
- Drag left→right to advance from gate to finish. Drag all the way back to reset the race.
- Predicted Finish Order
- Factors in contested pace burn, each horse’s effort curve (peaked-early vs. peaked-late), and wide trip cost from outside posts. Updated live when Track Bias changes.
- Pace Scenario
- Lone Speed: single E horse likely rates and holds. Contested: two E horses burn each other — closers benefit. Hot Pace: speed meltdown, deep closers thrive. Soft: no early speed, moderate fractions throughout.
- Track Bias
- Slider below canvas. −2 = strong closer/wet bias; +2 = strong speed/rail bias. Recomputes the predicted finish order.
- Boxed Indicator
- Dashed orange ring = horse is surrounded (rival ahead, rival behind, wall outside). In a real race this horse must find a clear path to run.
- Running Styles
- E/EE = early speed (rushes to rail). P = presser (stalks the pace). S = stalker. SS = slow starter / closer.
| Stat | vs. Current Card | vs. All Horses |
|---|---|---|
| Averages
Career-average metrics across all AI race analysis. Performance and pace averages reflect estimated historical performance; trainer and jockey grades score in-the-money percentages. Grading scale: A = elite • B = above average • C = average • D = below average • F = poor • — = no data |
||
| Pick Pony AI Rating | C | C |
| Pace Trip Longshot | — | — |
| Connections Longshot | — | — |
| Situational Longshot | — | — |
| Speed | A | C |
| Early Pace | B | B |
| Mid Pace | A | A |
| Late Pace | A | C |
| Finish Pos | A | C |
| Dirt Speed | D | F |
| Turf Speed | D | D |
| Distance Speed | D | F |
| Trainer Effectiveness | C | B |
| Jockey Effectiveness | C | B |
| 3rd Party Ratings | A | C |
| Recent
Performance analysis from the horse's recent races, weighted to reflect current form. Sprint and Route FPS (Foot Per Second) measure pace efficiency over the horse's recent sprints and routes respectively. Grading scale: A = elite • B = above average • C = average • D = below average • F = poor • — = no data |
||
| Speed | A | C |
| Early Pace | B | B |
| Mid Pace | A | A |
| Late Pace | B | C |
| Sprint FPS | C | C |
| Route FPS | A | C |
| Trainer Effectiveness | C | B |
| Jockey Effectiveness | C | B |
| 3rd Party Ratings | A | C |
| Predictions
AI-generated projections for the upcoming race, derived from prior AI analysis for speed and pace trends, surface and distance suitability, and current conditions. Grading scale: A = elite • B = above average • C = average • D = below average • F = poor • — = no data |
||
| Speed | A | C |
| Early Pace | F | F |
| Mid Pace | F | F |
| Late Pace | C | C |
TL;DR
Toggle
Get more in-depth analysis, expert picks, handicapper reports, AI picks, handicapping tools, in-article data tooltips, NO ADVERTISEMENTS, and other membership perks with a Pick Pony subscription!
Don’t forget Pick Pony’s Expert Picks, AI Picks, and Past Performance Sheets/Racing Forms!
The Pick Pony Handicapper's Report is published daily and provides analysis of all races on the card. A Pick Pony analyst prepares the report, so selections may differ from the Pick Pony Expert Picks, which are based on the consensus of all Pick Pony analysts.
Laurel Park hosts an exciting nine-race card featuring two prestigious stakes races for juveniles. The $125,000 Maryland Juvenile Stakes (Race 6) and the $125,000 Maryland Juvenile Filly Stakes (Race 8) headline the program, restricted to Maryland-bred or sired and Virginia-bred or sired 2-year-olds. First post time is 12:00 PM EST.
The card features quality racing throughout with competitive claiming races, allowance conditions, and maiden contests providing strong betting opportunities. The track is currently offering low 12 percent takeout Value Pick 5 wagers covering races 1-5 and 3-7.
Weather and Track Conditions
The forecast for Laurel, Maryland on December 6 shows temperatures in the low-to-mid 40s Fahrenheit with partly cloudy skies. Current track conditions are listed as Good on the main dirt surface. The track was originally listed as Fast but conditions changed to Good earlier in the week.
Bettors should note that recent weather patterns in the Maryland area included potential snow on Friday December 5, though accumulations were minimal in the Laurel region. The Good track rating suggests moisture remains in the surface but racing conditions should be fair throughout the afternoon.
Track Bias and Post Position Statistics
Laurel Park features one of the widest courses in North America, which helps eliminate bias toward frontrunners. Recent meet statistics from September 5 through November 30, 2025 reveal important tendencies.
At six furlongs on dirt, 28 percent of races have been won wire-to-wire with early speed and pace-pressing running styles performing best. Middle to outside posts show a slight advantage at this distance. At seven furlongs, the wire-to-wire percentage increases to 32 percent, again favoring tactical speed from middle posts.
In route races, outside posts 7 and 8 demonstrate a clear advantage, with only 18 percent of winners emerging from the two inside posts. The long stretch at Laurel gives closers opportunities to make moves, but mid-pack stalkers who secure good position have shown the strongest results.
The track generally favors closers compared to other regional circuits, and the wide configuration allows horses drawn outside to maintain forward position without traffic issues.
Race 1 – Claiming $7,500
Post Time: 12:00 PM
Six furlongs on dirt. Purse $18,000. For three-year-olds and upward which have never won two races since June 6 or which have never won five races.
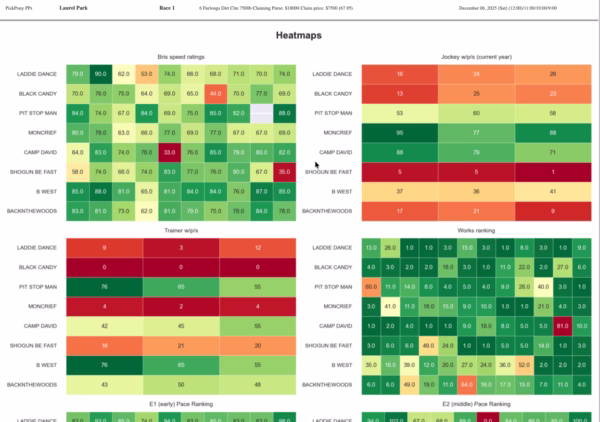
Pace Analysis
This contentious claiming sprint features multiple horses with early speed. Backnthewoods from the outside post possesses abundant gate speed and figures to gun for the early lead. Laddie Dance and Black Candy also show early lick, suggesting honest early fractions that could set up late closers.
Key Contenders
B West returns off a sharp winning effort over course and distance on November 21, nailing loose leader Excellent Timing in the final stride. The five-year-old horse has rediscovered best form since rejoining the Kieron Magee barn in mid-September. He defeated Pit Stop Man by a nose in that race and gets a favorable inside draw to secure position. The strong recent form and class edge make him the horse to beat.
Backnthewoods ships in from Delaware Park with tactical speed. This six-year-old gelding engaged in a pace duel with Borracho last out while finishing fourth. He owns sufficient early speed to cross from post 8 and control the tempo, but may face pressure from inside runners. Trainer Jose Corrales sends out a live mount with jockey Jorge Hernandez.
Secondary Choices
Pit Stop Man finished a game third behind B West two back at this level and distance. Trainer Kieron Magee, who also conditions favorite B West, gives this one tactical speed to sit a perfect trip. At 4-1 morning line, he offers value if the pace unfolds fast.
Moncrief makes his third start since joining trainer Troy Robb. The five-year-old gelding drops into the $6,000 claiming level for additional weight relief and has shown flashes of ability in past form.
Betting Strategy and Wagering Angles
B West stands out as a confident single in horizontal wagers. The post position, recent form, and trainer angle all align favorably. For vertical exotic players, structure tickets with B West on top and use Backnthewoods, Pit Stop Man, and Moncrief underneath for second and third.
Win bet: B West
Exacta: 7/3,4,8
Trifecta: 7/3,4,8/3,4,5,8
Selections
Win: B West (7)
Place: Backnthewoods (8)
Show: Pit Stop Man (3)
Race 2 – Claiming $40,000
Post Time: 12:28 PM
One mile on dirt. Purse $40,000. For three-year-olds and upward which have never won three races or three-year-olds.
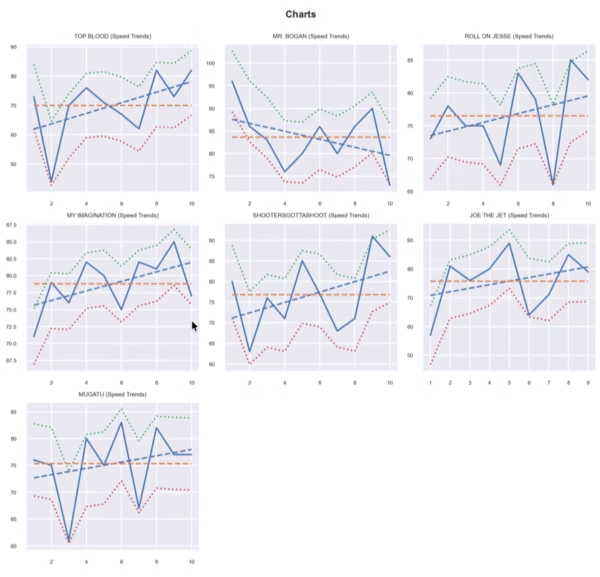
Pace Analysis
Handicappers must consider pace dynamics carefully in this middle-distance claimer. Mr. Bogan shows the most consistent early speed and figures to establish position from post 2. Shootersgottashoot also breaks alertly and will apply pressure through the opening quarter. The pace should be contested but not suicidal, potentially setting up mid-pack runners and closers.
Key Contenders
Mugatu drops significantly in class after facing allowance company in recent starts. The four-year-old gelding finished sixth going 1 1/8 miles last out but returns to one mile where he has been competitive. He shows tactical versatility to rate off the pace or make an early move. Trainer Annette Eubanks removes blinkers, suggesting a different tactical approach. Morning-line favorite status reflects the class drop.
Joe the Jet returns from a layoff after a disappointing fifth-place finish on November 27. However, he won gate-to-wire at seven furlongs in early June before going to the sidelines for 4.5 months. Trainer Hugh McMahon typically has horses ready to fire fresh, and jockey Yedsit Hazlewood takes the mount. The combination of Hazlewood and Capuano-trained horses has proven profitable, though McMahon trains this one. First race back with sharp morning drills suggests readiness.
Secondary Choices
Shootersgottashoot sits a perfect trip to win going away two starts back with a career-best 91 speed figure. He nearly matched that effort next out with an 86, finishing second behind impressive winner Winning Trip. Both races came at six furlongs, and now he stretches to a mile for the first time since a poor effort at Delaware Park in June. However, he is in improved form and the extra distance could suit his running style. Trainer Claudio Gonzalez sends him out with seven-pound apprentice Yan Rodriguez.
My Imagination possesses the best average late pace figures in the field and receives significant class relief after facing stronger at Parx Racing. The five-year-old gelding from the Alan Bedard barn ships in as a potential overlay at 15-1 morning line odds.
Betting Strategy and Wagering Angles
This race lacks a standout and offers opportunities for creative wagering. Consider boxing the top four in exactas and spreading tickets in trifectas. The class drop for Mugatu combined with tactical speed makes him the selection, but Joe the Jet looms dangerous if sharp off the bench.
Win bet: Mugatu
Exacta box: 6,7 with 5,6,7
Trifecta: 7/5,6/3,4,5,6
Selections
Win: Mugatu (7)
Place: Joe The Jet (6)
Show: Shootersgottashoot (5)
Race 3 – Maiden Claiming $40,000
Post Time: 12:57 PM
Six furlongs on dirt. Purse $41,000. For maidens three, four, five and six years old.
Pace Analysis
Maiden claiming races often produce unpredictable pace scenarios as inexperienced horses sort out positions. Lannister drops from Del Mar debut and could show early speed. Farooq has demonstrated ability to press or close depending on pace flow. Expect moderate early fractions with the race setting up for horses with tactical speed.
Key Contenders
Neverworkedaday has knocked on the door in consecutive starts, finishing second by narrow margins in his last two attempts. The three-year-old gelding trained by Gary Capuano shows consistent improvement and draws the inside post with hot rider Yedsit Hazlewood. The Capuano-Hazlewood combination delivers winners at a high percentage. He ran speed figures in the low-to-mid 60s in recent starts and should appreciate the slight class relief into maiden claiming ranks. The inside draw allows him to save ground and get first run.
Lannister makes his debut for the high-percentage Brittany Russell barn after one start at Del Mar. The three-year-old gelding by Not This Time cost connections from the SF Racing partnership and shows solid morning works. Russell leads the Laurel Park meet with 37 wins and a 33 percent strike rate. Jockey Sheldon Russell (21 percent win rate at the meet) combines with his wife for a potent team. The class drop into maiden claiming from open maiden special weight suggests connections found the right spot.
Secondary Choices
Farooq returns to dirt after two poor turf efforts and brings Maryland-sired allowance experience. The three-year-old gelding finished second at this level two starts back and has enough tactical speed to factor if returning to form. Trainer Katharine Voss removes blinkers, indicating a fresh approach. Morning line odds of 9-2 might undervalue his chances with equipment change and surface switch.
Baltic gets back to dirt for trainer Cathal Lynch after also-eligible frustration last time. The three-year-old has been competitive in recent maiden races and draws jockey Angel Cruz, who shows solid numbers at the meet.
Betting Strategy and Wagering Angles
The Capuano-Hazlewood angle with Neverworkedaday offers strong value as the favorite at projected odds. For exotic players, respect the Russell barn with Lannister as a live upset candidate. Structure multi-race wagers through Neverworkedaday but include Lannister in vertical exotic protection.
Win bet: Neverworkedaday
Exacta: 4/1,5 and 1,5/4
Trifecta: 4/1,5,6/1,5,6,7
Selections
Win: Neverworkedaday (4)
Place: Lannister (1)
Show: Farooq (5)
Race 4 – Allowance Optional Claiming
Post Time: 1:27 PM
Six furlongs on dirt. Purse $49,000. For fillies two years old which have never won a race other than maiden, claiming, waiver claiming, starter, MD sired races or MD bred races or which have never won two races.
Pace Analysis
This juvenile filly sprint features several speedsters who will contest the early lead. Prosecco Rita has shown gate-to-wire ability in maiden ranks. Noble Status broke alertly last out en route to her maiden score. Expect quick early fractions that could set up late runners, though frontrunners often prevail at six furlongs.
Key Contenders
Prosecco Rita looks the one to beat after a strong runner-up effort in stakes company. The two-year-old filly by Vino Rosso won her maiden impressively on October 10 at seven furlongs, defeating 11 rivals by open daylight. She followed with a game second in the Smart Halo Stakes behind Doc's Miracle, showing she can compete at the stakes level. Trained by high-percentage Brittany Russell and ridden by Sheldon Russell, she draws post 2 and figures to establish early position. The inside draw proves critical at Laurel where inside posts can save ground in sprints. Russell has a meet-leading 37 wins and 33 percent strike rate.
Noble Status overcame a poor start to swoop the group and defeat first-level maidens last out. The two-year-old filly shows the best late pace figures in the field by considerable margin, though she might prefer more distance. Jockey Jean Briceno takes the mount for trainer Hamilton Smith. If the pace unfolds quickly, her closing kick could prove decisive. The morning line of 5-1 suggests value potential.
Secondary Choices
Ginger Snap finished third in the Maryland Million Lassie two starts ago behind Doc's Miracle and Slewperstitus, both of whom return in Race 8. She followed that effort with an easy maiden score last out. Trainer Robert Bailes conditions this filly to sit off the pace and hope Prosecco Rita tires. The Maryland Million form ties her to elite fillies in the division. Forest Boyce, who won three races last week at Laurel, gets the call.
Sweet Shenanigans stretches out to six furlongs for trainer Gary Capuano. The two-year-old filly shows tactical speed but must overcome significant class advancement. Seven-pound apprentice Yedsit Hazlewood provides weight relief and brings momentum from his current meet-leading 51 wins.
Betting Strategy and Wagering Angles
Prosecco Rita stands out on form and connections. The Russell barn with Sheldon Russell aboard offers confidence, though the odds will be short. For value seekers, Noble Status provides exacta and trifecta protection with her strong closing kick. Consider boxing Prosecco Rita with Noble Status and Ginger Snap in exactas.
Win bet: Prosecco Rita
Exacta: 2/3,4 and 3,4/2
Trifecta: 2/3,4/1,3,4,6
Selections
Win: Prosecco Rita (2)
Place: Noble Status (3)
Show: Ginger Snap (4)
Race 5 – Claiming $12,500
Post Time: 1:56 PM
One mile on dirt. Purse $22,000. For three-year-olds and upward which have never won three races or three-year-olds.
Pace Analysis
This bottom-level claiming route features horses of varying running styles. Work Hard won easily at a mile and 70 yards last out at Delaware Park. Daddy Yankee typically closes from well off the pace. Several horses show tactical speed to rate near the front. Expect moderate early fractions with the race favoring horses able to maintain position throughout.
Key Contenders
Work Hard sat near the pace and won with authority last out at Delaware Park going a mile and 70 yards. The four-year-old gelding trained by Gary Capuano gets Yedsit Hazlewood for the first time, and this jockey-trainer combination produces winners at an exceptional rate. Hazlewood leads the meet with 51 wins and a 25 percent strike rate since returning from injury. Capuano ranks second in the trainer standings with 22 wins. The distance fits, form is sharp, and connections align perfectly. Morning line odds of 5-2 might be generous given the circumstances.
Daddy Yankee shows a powerful closing kick and has been competitive in recent starts. The three-year-old gelding with earnings exceeding $400,000 drops to the bottom claiming level for the first time. Trainer Rodolfo Sanchez-Salomon seeks the right spot, and the class drop combined with the horse's natural late kick makes him dangerous. He ran second most recently and typically closes from well back, so if the pace unfolds quickly, he looms as the major threat. Seven-pound apprentice Yan Rodriguez takes three pounds off.
Secondary Choices
Lucked In has won twice at this distance in recent efforts. The five-year-old gelding closed in the center of the track to win a non-winners of two claimer last out, defeating heavily favored Keen Surge. Trainer Katharine Voss has him spotted correctly. JG Torrealba gets the return mount.
Mortal Sin makes his debut for trainer Danielle Hodsdon after recent claiming. The four-year-old gelding has competed at higher levels and could find this group to his liking. Sheldon Russell rides, and his 21 percent meet win rate suggests he lands on quality mounts.
Betting Strategy and Wagering Angles
Work Hard offers the strongest play based on trainer-jockey statistics and recent form. The Capuano-Hazlewood angle demands respect, especially in the claiming ranks where they dominate. Use Work Hard on top of exotic wagers and include Daddy Yankee as the primary upset threat given his class advantage.
Win bet: Work Hard
Exacta: 7/3,9 and 9/7
Trifecta: 7/3,8,9/2,3,8,9
Selections
Win: Work Hard (7)
Place: Daddy Yankee (9)
Show: Lucked In (3)
Race 6 – Maryland Juvenile Stakes
Post Time: 2:26 PM
Seven furlongs on dirt. Purse $125,000. For two-year-olds registered Maryland-bred, Maryland-sired, Virginia-bred or Virginia-sired.
Pace Analysis
This prestigious stakes race surprisingly lacks abundant early speed for a seven-furlong juvenile contest. Worker Bee shows the most consistent early foot and should establish position without excessive pressure. Code of Silence rates kindly but needs racing room. The lack of pace pressure could favor frontrunners, though the seven-furlong distance provides enough ground for closers to mount bids.
Key Contenders
Worker Bee enters off two impressive victories for the red-hot Gary Capuano barn. The son of Holy Boss broke his maiden in May going 4.5 furlongs and captured allowance company at six furlongs on November 21 after posting a bullet work. Capuano conditions his horses meticulously and rarely runs them back quickly without confidence. The 15-day turnaround appears aggressive, but the trainer's last-out winners show a 5-for-14 record with a $4.27 ROI. Yedsit Hazlewood returns after guiding this colt to victory two weeks ago. The leading rider at the meet combines with the second-leading trainer for a potent duo. Worker Bee has defeated winners and should control the tempo from his inside post.
Tartabull brings the most significant pedigree to this contest as the first foal from 11-time stakes winner Anna's Bandit by super-sire Tapit. The $310,000 yearling finished third at Saratoga behind next-out stakes winner Ewing in his July debut. He returned at Saratoga in August and finished fifth in a division that produced multiple stakes winners including Further Ado. Trainer Chad Summers brought him to Laurel in late October where he broke his maiden with a green rally at six furlongs. The morning works since have been sharp, suggesting he is ready for the step forward. Xavier Perez gets the call, and the additional furlong should suit this colt's late-running style. Handicappers identified him as a major player despite modest odds.
Code of Silence suffered a troubled trip in the Maryland Million Nursery on October 11 but rebounded with a rallying victory against state-sired maidens on November 16. The Blofeld gelding is a half-brother to stakes winner Tattooed and shows the diesel engine style of his sibling. Trainer Timothy Keefe noted the colt needs time to get going but runs on powerfully once engaged. The troubled Nursery effort deserves upgrading, and the maiden victory came after he was forced to wait behind horses. Angel Cruz takes the mount on this 7-2 morning-line favorite.
Secondary Choices
Sometime shipped from Kentucky after competing in allowance company at Churchill Downs. The two-year-old colt by Maclean's Music scratched from his last start due to veterinary issues but returns with solid credentials. He finished third in quality maiden races and could improve with a surface switch to dirt.
Hell Ofa Hillbilly won his debut impressively and brings the fast-pace angle for trainer John Robb. However, the step to stakes company represents a significant class test.
Longshots
Big Bolton finished well back in his debut but shows solid breeding as a son of Blofeld. Trainer Milan Milosevic sharpens this one up, and morning line odds of 8-1 might create value if he shows significant improvement.
Betting Strategy and Wagering Angles
This race offers legitimate win candidates from multiple running styles. Worker Bee gets the call based on current form, connections, and tactical speed. However, Tartabull looms as the major exacta and trifecta threat with his pedigree and improving pattern. Code of Silence must be included in all exotic wagers given his troubled Nursery and strong rebound.
Suggested wagers:
Win: Worker Bee
Exacta box: 2,8 with 2,5,8
Trifecta: 2,8/2,5,8/2,4,5,7,8
Selections
Win: Worker Bee (2)
Place: Tartabull (8)
Show: Code Of Silence (5)
Race 7 – Allowance
Post Time: 2:56 PM
1 1/16 miles on dirt. Purse $49,000. For three-year-olds and upward which have never won a race other than maiden, claiming, waiver claiming, starter or MD sired or MD bred races or which have never won two races.
Pace Analysis
This allowance route features horses stretching out to 1 1/16 miles. Indy Charges On has shown determination on the lead at this distance in Kentucky races. Maclean's Rook won powerfully last out at this level. The pace should develop moderately with enough pressure to set up closers, though horses with tactical speed who secure position hold advantages.
Key Contenders
Maclean's Rook demolished a first-level field last out, winning by 6.75 lengths with a career-best 98 speed figure in his first start on the dirt surface. The three-year-old gelding by Irish War Cry for PrepsToThePros Racing shows significant upside and improvement. Trainer Michael Trombetta conditions stakes horses and brings this one back quickly, suggesting confidence. The ceiling appears high based on the dominant last-out performance, though this represents a tougher field than he faced in that romp. Ismerio Villalobos gets the mount, and the morning line of 2-1 reflects respect for the strong recent form. Outside post 7 provides racing room in the two-turn route.
Indy Charges On made his Laurel debut a winning one last time, leading throughout to defeat a starter optional claiming field with a career-best 93. The three-year-old gelding by Take Charge Indy finished second three times at this distance in Kentucky, showing determination on the lead each occasion. Trainer Anthony Farrior brings him back with Yedsit Hazlewood, who won four races at Laurel on November 1 and November 8. The outside post 4 allows tactical options. He ran his best figure while controlling the pace, suggesting he handles pressure.
Secondary Choices
El de Larry competed in excellent form on this track last winter and returns to dirt after spending summer months on turf in New York. The four-year-old gelding can make the lead or rate close to the pace depending on flow. Trainer Robert Bailes points him to this spot, and the return to dirt could spark improvement. Jockey Jeiron Barbosa takes the call. Morning line odds of 3-1 suggest he factors prominently.
Super Accelerate scratched his last start due to veterinary issues but returns with five months of rest. The five-year-old gelding shows tactical speed and has competed well at allowance levels. Trainer Robin Graham brings him back fresh.
Betting Strategy and Wagering Angles
Maclean's Rook offers the best value at 2-1 morning line given his dominant last performance and room for improvement. Indy Charges On provides exacta insurance with his tactical speed and the powerful Hazlewood aboard. This race could produce surprising results given the mixture of improving three-year-olds and older horses returning from layoffs.
Win bet: Maclean's Rook
Exacta: 7/4,5 and 4,5/7
Trifecta: 7/4,5/3,4,5,8
Selections
Win: Maclean's Rook (7)
Place: Indy Charges On (4)
Show: El De Larry (5)
Race 8 – Maryland Juvenile Filly Stakes
Post Time: 3:26 PM
Seven furlongs on dirt. Purse $125,000. For fillies two years old registered Maryland-bred, Maryland-sired, Virginia-bred or Virginia-sired.
Pace Analysis
This stakes showdown features several fillies with tactical speed. Doc's Miracle has shown versatility to press or make the lead. Slewperstitus typically rates off the pace before launching a sustained rally. Just Philtored can press or rate depending on circumstances. Expect contested but manageable fractions that allow the best filly to prevail.
Key Contenders
Doc's Miracle enters as the narrow 3-2 favorite after capturing the Smart Halo Stakes on November 8. The Long River filly became the first stakes winner for her young sire after stalking and pouncing to victory under Yedsit Hazlewood. She has finished first or second in her last four starts after losing her first four career races. Trainer Gary Capuano noted she remains solid and never misses a beat. Her six-length maiden score at Timonium in August served as an excellent wake-up call, and she continues improving with each start. The tactical speed allows her to secure good position, and Hazlewood knows her perfectly after their Smart Halo score. She finished second in the Maryland Million Lassie behind Slewperstitus by a neck, proving she can compete with the division's best.
Slewperstitus brings an undefeated in-the-money record to this stakes. The Great Notion filly rallied from off the pace to beat Doc's Miracle by a neck in the Maryland Million Lassie on October 11. Trainer Robert Bailes noted she tries every time and has been all racehorse from day one. She scratched from the Smart Halo due to a tooth abscess that required additional recovery time. The freshness could prove beneficial, though the 57-day layoff represents her longest absence. She worked steadily since the Smart Halo scratch, suggesting readiness. Jevian Toledo takes the mount, and his 31 wins rank third at the current meet. Morning line odds of 3-1 offer value if she returns at peak form.
Just Philtored began her career with an eight-length debut victory at Laurel for Gary Capuano before being purchased privately by London Reid Thoroughbreds. She transferred to Michael Trombetta and immediately won stakes on turf and dirt at Colonial Downs. After finishing fifth in Aqueduct's Grade 3 Matron on grass, she placed third as the favorite in the Smart Halo, beaten 4.25 lengths. Trainer Trombetta speculated she didn't handle the muddy track that day and expected drier conditions. She shows quality and previously demonstrated ability to dominate, making her dangerous if bouncing back to Colonial form. JG Torrealba rides for the first time. Morning line of 9-5 places her between the top two favorites.
Secondary Choices
Project Maximus ships from Parx Racing with two wins in her record. The two-year-old filly gets first-time Lasix and could improve with the medication addition.
Tacit Value won by nearly seven lengths at Delaware Park in late July and returns from a long layoff. The two-year-old filly now trains for Hugh McMahon after previously racing for Bobby Leaf. She posted a bullet work on December 1, suggesting sharpness despite the extended absence.
Betting Strategy and Wagering Angles
This race presents a classic rematch between Doc's Miracle and Slewperstitus with the wild card of Just Philtored seeking redemption. Doc's Miracle gets the call based on current form and the powerful Capuano-Hazlewood combination. However, Slewperstitus looms as the major danger if returning at her Lassie-winning form. Structure vertical exotics around these three fillies.
Suggested wagers:
Win: Doc's Miracle
Exacta: 2/4,6 and 4,6/2
Trifecta: 2,4,6/2,4,6/1,2,4,6
Selections
Win: Doc's Miracle (2)
Place: Slewperstitus (4)
Show: Just Philtored (6)
Race 9 – Maiden Claiming $25,000
Post Time: 3:56 PM
Seven furlongs on dirt. Purse $30,000. For maidens fillies and mares three, four, five and six years old.
Pace Analysis
This maiden claiming finale for fillies features limited experience and unpredictable pace dynamics. Several horses show early speed in past performances, suggesting contested fractions. The seven-furlong distance allows closers to mount rallies if the pace unfolds quickly.
Key Contenders
Nit Witness debuts for trainer Jamie Ness with Gary Capuano's barn listed as her previous connections. The three-year-old filly draws the inside-most favorable post and gets Yedsit Hazlewood. This combination of trainer, jockey, and post position creates a strong angle in maiden races. Ness ranks second in the Laurel trainer standings with 22 wins. Hazlewood continues his remarkable meet-leading performance. Morning line odds of 6-5 suggest she will be favored heavily.
Zen Dreams runs for the Ness stable with Martin Chuan aboard. The three-year-old filly shows morning works suggesting readiness for debut. Chuan won five races last week at Laurel and ranks highly in the jockey standings. The combination of an improving jockey with the second-leading trainer creates appeal at 2-1 morning line.
Secondary Choices
She's Not a Lad brings racing experience and tactical speed. The three-year-old filly trained by John Salzman gets Jevian Toledo, whose 31 wins rank third at the meet. Morning line of 5-1 suggests value potential if she can improve off her debut.
Beautiful McClean enters for a claiming tag for the first time after competing in maiden special weight company. Trainer Susan Cooney drops her into maiden claiming ranks, suggesting connections found the appropriate level. She battled for the lead against a tough field last out and appears to possess the most early speed in this lineup.
Betting Strategy and Wagering Angles
The Ness barn sends out two live contenders with quality riders. Nit Witness gets the nod based on the superior Hazlewood mount and inside post. This race concludes the card and offers opportunities in late Pick 4 and Pick 5 sequences through the two Ness runners.
Win bet: Nit Witness
Exacta: 4/3,5 and 3,5/4
Trifecta: 4/3,5,6/2,3,5,6
Selections
Win: Nit Witness (4)
Place: Zen Dreams (3)
Show: She's Not A Lad (5)
Jockey Notes and Insights
Yedsit Hazlewood leads the Laurel Park Fall Meet with 51 wins through December 4, holding an 18-win advantage over second-place Jorge Ruiz. The 17-year-old apprentice reached his 100th career victory on November 29 and has won at least one race on each of the last 16 racing dates at Laurel. Since returning from a two-month injury absence on August 14, he has won 78 of 310 mounts for a 25 percent strike rate. He captured three stakes races in November alone and won four races on single cards multiple times. His combination with trainer Gary Capuano produces exceptional results.
Sheldon Russell ranks third in the standings with 25 wins but leads all riders with 21.52 percent of available purse money won. His wife Brittany Russell trains the meet leader with 37 wins, and their combination proves highly effective. Sheldon won at a 36 percent clip during one recent week, including two stakes victories.
Jevian Toledo has 31 wins and ranks third in the jockey standings. He won six times during the week ending December 4, going 6-for-16. His tactical versatility makes him effective on various running styles.
Martin Chuan won five races during the week ending December 4 and shows a 20 percent win rate with 52 percent in-the-money percentage. He continues improving and delivers value at higher odds.
Forest Boyce won three races during the first week of December and rides for quality barns including Robert Bailes.
Trainer Notes and Insights
Brittany Russell dominates the Laurel Park Fall Meet with 37 wins, holding a 15-win lead over second-place Jamie Ness who has 22 victories. Russell posts a remarkable 33 percent win rate and 58 percent in-the-money percentage. Her combination with husband-jockey Sheldon Russell creates one of the most potent teams in Mid-Atlantic racing. She has won 37 of 113 starters for purse earnings exceeding $1.36 million.
Gary Capuano ranks second in wins with 22 from 112 starts. His last-out winners show strong statistics with 5-for-14 and a $4.27 ROI in recent weeks. His combination with Yedsit Hazlewood produces extraordinary results, and they team up multiple times on this card. Capuano conditions horses meticulously and rarely runs them back quickly without supreme confidence.
Jamie Ness holds second place in the standings with 22 wins from 112 starters. His tactical approach and patience with developing horses creates opportunities in maiden races.
Michael Trombetta conditions stakes-quality horses and ranks highly among Laurel trainers. His barn shows consistency in major races and brings quality stock to stakes events.
Robert Bailes ranks fifth in the standings with strong percentages in route races. He conditions Slewperstitus, one of the top juvenile fillies in the region.
Timothy Keefe trains Code of Silence and has shown patience developing this talented juvenile.
Best Wagering Strategies and Value Plays
The two stakes races in the middle of the card (Races 6 and 8) provide anchor points for horizontal wagers. Worker Bee in Race 6 and Doc's Miracle in Race 8 offer confidence plays that can be singled in Pick 3, Pick 4, and Pick 5 sequences.
The Value Pick 5 wagers carry only 12 percent takeout and span Races 1-5 and Races 3-7. These represent the best value on the card from a takeout perspective.
For Race 1-5 Value Pick 5:
Race 1: B West (7)
Race 2: Mugatu, Joe The Jet (6,7)
Race 3: Neverworkedaday (4)
Race 4: Prosecco Rita (2)
Race 5: Work Hard (7)
Cost: $4 for 50-cent ticket
For Race 3-7 Value Pick 5:
Race 3: Neverworkedaday (4)
Race 4: Prosecco Rita, Noble Status (2,3)
Race 5: Work Hard, Daddy Yankee (7,9)
Race 6: Worker Bee, Tartabull, Code Of Silence (2,5,8)
Race 7: Maclean's Rook, Indy Charges On (4,7)
Cost: $12 for 50-cent ticket
The Late Pick 4 covering Races 6-9 offers opportunities to build tickets around the two stakes races:
Race 6: 2,5,8
Race 7: 4,5,7
Race 8: 2,4,6
Race 9: 3,4,5
Cost: $27 for 50-cent ticket
Single-race value plays include Maclean's Rook in Race 7 at 2-1 morning line. His dominant last-out performance with a career-best 98 speed figure on a new surface suggests significant improvement, and the Michael Trombetta barn typically wins with horses showing this pattern.
Tartabull in Race 6 at 8-1 offers value given his prestigious pedigree and improving form. The Tapit-Anna's Bandit colt competed against eventual stakes winners at Saratoga and broke his maiden impressively at Laurel. The additional furlong suits his late-running style.
Daddy Yankee in Race 5 provides upset potential at double-digit odds. His $400,000-plus bankroll indicates quality, and the drop to bottom-level claiming for the first time creates opportunity for a score.
For conservative bettors, focus on the trainer-jockey combinations that dominate the meet:
- Brittany Russell with Sheldon Russell
- Gary Capuano with Yedsit Hazlewood
- Jamie Ness with Martin Chuan or Yedsit Hazlewood
These partnerships deliver consistent results and provide foundation for sustainable wagering approaches.

Mod1(W): 82 (1/8) Mod2(W): 75 (2/8) Mod3(W): 79 (3/8) Mod1-LS: 55 (6/8) Win Prob: 18.4% Value Score: 1.35 ★