Chart Guide (2.0.36)
- Bubbles
- Color = surface: green (turf), brown (dirt), blue (synthetic)
- Top number = finishing position; bottom number in parentheses = starting post position
- Height above line = beaten lengths — closer means a smaller margin
- Border = track conditions: green (FST/GD/FM), yellow (WF/SL/YLD), red (SY/MY/FRZ/SFT/HVY)
- Connecting Line
- Solid = good conditions; dashed = bad conditions
- Line Symbol
- ▲ Triangle = sprint (7f or less); ● Circle = route (more than 7f)
- Days Between Races
- Small number above each bubble (e.g. 19d) = days since the previous race — helps spot freshness, layoffs, and tight scheduling.
- Shaded Band (Bollinger)
- Highlights volatility — a wider band means more variation in recent performance
- Performance Trend
- Straight line showing the overall performance direction — angled up = improving, angled down = declining
- Dashed Reference Line
- AI Opponent = AI analysis class-level par for the race
AI Model History Guide
- Lines
- Each solid line shows this horse’s model score over its last 10 races: blue = Mod1, green = Mod2, amber = Mod3.
- Dashed Lines
- Dashed lines represent the current race’s field average for each model — a score below the dashed line indicates the horse ranked below average in this model’s assessment.
- Higher is Stronger
- All three model scores are 0–100: a higher number means the model rates this horse more favorably among the field.
Performance vs. Peers Guide
- Bars (per post)
- Blue = avg career performance • Amber = avg last 3 races • Green = last race (improved vs. avg) • Red = last race (declined vs. avg)
- Trend Line
- Angled line above the bars: rising = improving form • falling = declining form.
- Horizontal Line
- Field average — the mean career performance of all horses in this race.
- Color Circles
- Standard post-position colors below each lane — same as the Total Pace chart.
- Border
- Thicker border = this horse’s post position.
Figure Comparison
- Rating
- The three Pick Pony algorithm ratings (Algo 1, Algo 2, Algo 3) that make up the overall PP AI Rating — higher is a stronger contender rating.
- Speed
- Career average speed, recent 3-race average, and last-race speed figure — spot horses in improving or declining form.
- Pace
- Average Early (E1), Mid (E2), and Stretch (LP) pace figures — reveals pace-setters vs. closers vs. all-the-way types.
- This horse
- The horse whose stats card is open is highlighted with a darker column background.
Winning Profiles
- Axes
- X: Win % from last 10 starts — Y: In-the-money % (top-3 finishes) from last 10 starts.
- Quadrants
- Consistent Winners (top-right): high win & ITM — reliable performers.
Place Threats (top-left): boards often but doesn’t win often — good exacta/trifecta angles.
Streaky (bottom-right): wins occasionally, misses the board often — all-or-nothing.
Developing (bottom-left): still finding form — longshot territory. - Reference Lines
- Dashed lines mark field averages. Dots to the right win more; dots higher board more.
- This horse
- Highlighted with a gold border and larger dot.
AI Model Comparison
- Winner Models (green)
- Mod1(W), Mod2(W), and Mod3(W) trained to predict race winners. Higher score = stronger contender.
- Longshot Models (red)
- Mod1-LS, Mod2-LS, and Mod3-LS trained to find high-value longshots. Higher score = stronger longshot candidate.
- Form Model (blue)
- Mod4 sequence model trained on recent form patterns. Higher score = stronger recent form profile.
- This horse
- Highlighted with a darker column background.
Race Pace Simulation Guide
- Slider
- Drag left→right to advance from gate to finish. Drag all the way back to reset the race.
- Predicted Finish Order
- Factors in contested pace burn, each horse’s effort curve (peaked-early vs. peaked-late), and wide trip cost from outside posts. Updated live when Track Bias changes.
- Pace Scenario
- Lone Speed: single E horse likely rates and holds. Contested: two E horses burn each other — closers benefit. Hot Pace: speed meltdown, deep closers thrive. Soft: no early speed, moderate fractions throughout.
- Track Bias
- Slider below canvas. −2 = strong closer/wet bias; +2 = strong speed/rail bias. Recomputes the predicted finish order.
- Boxed Indicator
- Dashed orange ring = horse is surrounded (rival ahead, rival behind, wall outside). In a real race this horse must find a clear path to run.
- Running Styles
- E/EE = early speed (rushes to rail). P = presser (stalks the pace). S = stalker. SS = slow starter / closer.
| Stat | vs. Current Card | vs. All Horses |
|---|---|---|
| Averages
Career-average metrics across all AI race analysis. Performance and pace averages reflect estimated historical performance; trainer and jockey grades score in-the-money percentages. Grading scale: A = elite • B = above average • C = average • D = below average • F = poor • — = no data |
||
| Pick Pony AI Rating | A | C |
| Pace Trip Longshot | — | — |
| Connections Longshot | — | — |
| Situational Longshot | — | — |
| Speed | A | F |
| Early Pace | A | C |
| Mid Pace | A | D |
| Late Pace | A | D |
| Finish Pos | B | D |
| Dirt Speed | A | C |
| Turf Speed | C | D |
| Distance Speed | B | C |
| Trainer Effectiveness | A | B |
| Jockey Effectiveness | B | D |
| 3rd Party Ratings | B | D |
| Recent
Performance analysis from the horse's recent races, weighted to reflect current form. Sprint and Route FPS (Foot Per Second) measure pace efficiency over the horse's recent sprints and routes respectively. Grading scale: A = elite • B = above average • C = average • D = below average • F = poor • — = no data |
||
| Speed | A | D |
| Early Pace | B | D |
| Mid Pace | A | D |
| Late Pace | A | C |
| Sprint FPS | A | C |
| Route FPS | A | C |
| Trainer Effectiveness | A | B |
| Jockey Effectiveness | B | D |
| 3rd Party Ratings | B | D |
| Predictions
AI-generated projections for the upcoming race, derived from prior AI analysis for speed and pace trends, surface and distance suitability, and current conditions. Grading scale: A = elite • B = above average • C = average • D = below average • F = poor • — = no data |
||
| Speed | B | F |
| Early Pace | A | C |
| Mid Pace | A | D |
| Late Pace | C | C |
Chart Guide (2.0.36)
- Bubbles
- Color = surface: green (turf), brown (dirt), blue (synthetic)
- Top number = finishing position; bottom number in parentheses = starting post position
- Height above line = beaten lengths — closer means a smaller margin
- Border = track conditions: green (FST/GD/FM), yellow (WF/SL/YLD), red (SY/MY/FRZ/SFT/HVY)
- Connecting Line
- Solid = good conditions; dashed = bad conditions
- Line Symbol
- ▲ Triangle = sprint (7f or less); ● Circle = route (more than 7f)
- Days Between Races
- Small number above each bubble (e.g. 19d) = days since the previous race — helps spot freshness, layoffs, and tight scheduling.
- Shaded Band (Bollinger)
- Highlights volatility — a wider band means more variation in recent performance
- Performance Trend
- Straight line showing the overall performance direction — angled up = improving, angled down = declining
- Dashed Reference Line
- AI Opponent = AI analysis class-level par for the race
AI Model History Guide
- Lines
- Each solid line shows this horse’s model score over its last 10 races: blue = Mod1, green = Mod2, amber = Mod3.
- Dashed Lines
- Dashed lines represent the current race’s field average for each model — a score below the dashed line indicates the horse ranked below average in this model’s assessment.
- Higher is Stronger
- All three model scores are 0–100: a higher number means the model rates this horse more favorably among the field.
Mod1(W): 82 (1/8) Mod2(W): 75 (2/8) Mod3(W): 79 (3/8) Mod1-LS: 55 (6/8) Win Prob: 18.4% Value Score: 1.35 ★
Performance vs. Peers Guide
- Bars (per post)
- Blue = avg career performance • Amber = avg last 3 races • Green = last race (improved vs. avg) • Red = last race (declined vs. avg)
- Trend Line
- Angled line above the bars: rising = improving form • falling = declining form.
- Horizontal Line
- Field average — the mean career performance of all horses in this race.
- Color Circles
- Standard post-position colors below each lane — same as the Total Pace chart.
- Border
- Thicker border = this horse’s post position.
Figure Comparison
- Rating
- The three Pick Pony algorithm ratings (Algo 1, Algo 2, Algo 3) that make up the overall PP AI Rating — higher is a stronger contender rating.
- Speed
- Career average speed, recent 3-race average, and last-race speed figure — spot horses in improving or declining form.
- Pace
- Average Early (E1), Mid (E2), and Stretch (LP) pace figures — reveals pace-setters vs. closers vs. all-the-way types.
- This horse
- The horse whose stats card is open is highlighted with a darker column background.
Winning Profiles
- Axes
- X: Win % from last 10 starts — Y: In-the-money % (top-3 finishes) from last 10 starts.
- Quadrants
- Consistent Winners (top-right): high win & ITM — reliable performers.
Place Threats (top-left): boards often but doesn’t win often — good exacta/trifecta angles.
Streaky (bottom-right): wins occasionally, misses the board often — all-or-nothing.
Developing (bottom-left): still finding form — longshot territory. - Reference Lines
- Dashed lines mark field averages. Dots to the right win more; dots higher board more.
- This horse
- Highlighted with a gold border and larger dot.
AI Model Comparison
- Winner Models (green)
- Mod1(W), Mod2(W), and Mod3(W) trained to predict race winners. Higher score = stronger contender.
- Longshot Models (red)
- Mod1-LS, Mod2-LS, and Mod3-LS trained to find high-value longshots. Higher score = stronger longshot candidate.
- Form Model (blue)
- Mod4 sequence model trained on recent form patterns. Higher score = stronger recent form profile.
- This horse
- Highlighted with a darker column background.
Race Pace Simulation Guide
- Slider
- Drag left→right to advance from gate to finish. Drag all the way back to reset the race.
- Predicted Finish Order
- Factors in contested pace burn, each horse’s effort curve (peaked-early vs. peaked-late), and wide trip cost from outside posts. Updated live when Track Bias changes.
- Pace Scenario
- Lone Speed: single E horse likely rates and holds. Contested: two E horses burn each other — closers benefit. Hot Pace: speed meltdown, deep closers thrive. Soft: no early speed, moderate fractions throughout.
- Track Bias
- Slider below canvas. −2 = strong closer/wet bias; +2 = strong speed/rail bias. Recomputes the predicted finish order.
- Boxed Indicator
- Dashed orange ring = horse is surrounded (rival ahead, rival behind, wall outside). In a real race this horse must find a clear path to run.
- Running Styles
- E/EE = early speed (rushes to rail). P = presser (stalks the pace). S = stalker. SS = slow starter / closer.
| Stat | vs. Current Card | vs. All Horses |
|---|---|---|
| Averages
Career-average metrics across all AI race analysis. Performance and pace averages reflect estimated historical performance; trainer and jockey grades score in-the-money percentages. Grading scale: A = elite • B = above average • C = average • D = below average • F = poor • — = no data |
||
| Pick Pony AI Rating | A | B |
| Pace Trip Longshot | — | — |
| Connections Longshot | — | — |
| Situational Longshot | — | — |
| Speed | C | F |
| Early Pace | C | D |
| Mid Pace | B | D |
| Late Pace | C | D |
| Finish Pos | C | F |
| Dirt Speed | A | C |
| Turf Speed | C | D |
| Distance Speed | C | D |
| Trainer Effectiveness | A | C |
| Jockey Effectiveness | A | A |
| 3rd Party Ratings | A | D |
| Recent
Performance analysis from the horse's recent races, weighted to reflect current form. Sprint and Route FPS (Foot Per Second) measure pace efficiency over the horse's recent sprints and routes respectively. Grading scale: A = elite • B = above average • C = average • D = below average • F = poor • — = no data |
||
| Speed | B | F |
| Early Pace | D | D |
| Mid Pace | B | D |
| Late Pace | B | C |
| Sprint FPS | C | C |
| Route FPS | B | C |
| Trainer Effectiveness | A | C |
| Jockey Effectiveness | A | A |
| 3rd Party Ratings | A | D |
| Predictions
AI-generated projections for the upcoming race, derived from prior AI analysis for speed and pace trends, surface and distance suitability, and current conditions. Grading scale: A = elite • B = above average • C = average • D = below average • F = poor • — = no data |
||
| Speed | D | F |
| Early Pace | D | D |
| Mid Pace | B | D |
| Late Pace | C | C |
Chart Guide (2.0.36)
- Bubbles
- Color = surface: green (turf), brown (dirt), blue (synthetic)
- Top number = finishing position; bottom number in parentheses = starting post position
- Height above line = beaten lengths — closer means a smaller margin
- Border = track conditions: green (FST/GD/FM), yellow (WF/SL/YLD), red (SY/MY/FRZ/SFT/HVY)
- Connecting Line
- Solid = good conditions; dashed = bad conditions
- Line Symbol
- ▲ Triangle = sprint (7f or less); ● Circle = route (more than 7f)
- Days Between Races
- Small number above each bubble (e.g. 19d) = days since the previous race — helps spot freshness, layoffs, and tight scheduling.
- Shaded Band (Bollinger)
- Highlights volatility — a wider band means more variation in recent performance
- Performance Trend
- Straight line showing the overall performance direction — angled up = improving, angled down = declining
- Dashed Reference Line
- AI Opponent = AI analysis class-level par for the race
AI Model History Guide
- Lines
- Each solid line shows this horse’s model score over its last 10 races: blue = Mod1, green = Mod2, amber = Mod3.
- Dashed Lines
- Dashed lines represent the current race’s field average for each model — a score below the dashed line indicates the horse ranked below average in this model’s assessment.
- Higher is Stronger
- All three model scores are 0–100: a higher number means the model rates this horse more favorably among the field.
Mod1(W): 82 (1/8) Mod2(W): 75 (2/8) Mod3(W): 79 (3/8) Mod1-LS: 55 (6/8) Win Prob: 18.4% Value Score: 1.35 ★
Performance vs. Peers Guide
- Bars (per post)
- Blue = avg career performance • Amber = avg last 3 races • Green = last race (improved vs. avg) • Red = last race (declined vs. avg)
- Trend Line
- Angled line above the bars: rising = improving form • falling = declining form.
- Horizontal Line
- Field average — the mean career performance of all horses in this race.
- Color Circles
- Standard post-position colors below each lane — same as the Total Pace chart.
- Border
- Thicker border = this horse’s post position.
Figure Comparison
- Rating
- The three Pick Pony algorithm ratings (Algo 1, Algo 2, Algo 3) that make up the overall PP AI Rating — higher is a stronger contender rating.
- Speed
- Career average speed, recent 3-race average, and last-race speed figure — spot horses in improving or declining form.
- Pace
- Average Early (E1), Mid (E2), and Stretch (LP) pace figures — reveals pace-setters vs. closers vs. all-the-way types.
- This horse
- The horse whose stats card is open is highlighted with a darker column background.
Winning Profiles
- Axes
- X: Win % from last 10 starts — Y: In-the-money % (top-3 finishes) from last 10 starts.
- Quadrants
- Consistent Winners (top-right): high win & ITM — reliable performers.
Place Threats (top-left): boards often but doesn’t win often — good exacta/trifecta angles.
Streaky (bottom-right): wins occasionally, misses the board often — all-or-nothing.
Developing (bottom-left): still finding form — longshot territory. - Reference Lines
- Dashed lines mark field averages. Dots to the right win more; dots higher board more.
- This horse
- Highlighted with a gold border and larger dot.
AI Model Comparison
- Winner Models (green)
- Mod1(W), Mod2(W), and Mod3(W) trained to predict race winners. Higher score = stronger contender.
- Longshot Models (red)
- Mod1-LS, Mod2-LS, and Mod3-LS trained to find high-value longshots. Higher score = stronger longshot candidate.
- Form Model (blue)
- Mod4 sequence model trained on recent form patterns. Higher score = stronger recent form profile.
- This horse
- Highlighted with a darker column background.
Race Pace Simulation Guide
- Slider
- Drag left→right to advance from gate to finish. Drag all the way back to reset the race.
- Predicted Finish Order
- Factors in contested pace burn, each horse’s effort curve (peaked-early vs. peaked-late), and wide trip cost from outside posts. Updated live when Track Bias changes.
- Pace Scenario
- Lone Speed: single E horse likely rates and holds. Contested: two E horses burn each other — closers benefit. Hot Pace: speed meltdown, deep closers thrive. Soft: no early speed, moderate fractions throughout.
- Track Bias
- Slider below canvas. −2 = strong closer/wet bias; +2 = strong speed/rail bias. Recomputes the predicted finish order.
- Boxed Indicator
- Dashed orange ring = horse is surrounded (rival ahead, rival behind, wall outside). In a real race this horse must find a clear path to run.
- Running Styles
- E/EE = early speed (rushes to rail). P = presser (stalks the pace). S = stalker. SS = slow starter / closer.
| Stat | vs. Current Card | vs. All Horses |
|---|---|---|
| Averages
Career-average metrics across all AI race analysis. Performance and pace averages reflect estimated historical performance; trainer and jockey grades score in-the-money percentages. Grading scale: A = elite • B = above average • C = average • D = below average • F = poor • — = no data |
||
| Pick Pony AI Rating | C | C |
| Pace Trip Longshot | — | — |
| Connections Longshot | — | — |
| Situational Longshot | — | — |
| Speed | D | F |
| Early Pace | B | D |
| Mid Pace | B | D |
| Late Pace | F | F |
| Finish Pos | D | F |
| Dirt Speed | D | D |
| Turf Speed | C | D |
| Distance Speed | D | D |
| Trainer Effectiveness | D | F |
| Jockey Effectiveness | D | F |
| 3rd Party Ratings | C | D |
| Recent
Performance analysis from the horse's recent races, weighted to reflect current form. Sprint and Route FPS (Foot Per Second) measure pace efficiency over the horse's recent sprints and routes respectively. Grading scale: A = elite • B = above average • C = average • D = below average • F = poor • — = no data |
||
| Speed | C | F |
| Early Pace | C | D |
| Mid Pace | B | D |
| Late Pace | C | D |
| Sprint FPS | D | D |
| Route FPS | D | D |
| Trainer Effectiveness | D | F |
| Jockey Effectiveness | D | F |
| 3rd Party Ratings | C | D |
| Predictions
AI-generated projections for the upcoming race, derived from prior AI analysis for speed and pace trends, surface and distance suitability, and current conditions. Grading scale: A = elite • B = above average • C = average • D = below average • F = poor • — = no data |
||
| Speed | C | F |
| Early Pace | B | D |
| Mid Pace | B | D |
| Late Pace | C | C |
Chart Guide (2.0.36)
- Bubbles
- Color = surface: green (turf), brown (dirt), blue (synthetic)
- Top number = finishing position; bottom number in parentheses = starting post position
- Height above line = beaten lengths — closer means a smaller margin
- Border = track conditions: green (FST/GD/FM), yellow (WF/SL/YLD), red (SY/MY/FRZ/SFT/HVY)
- Connecting Line
- Solid = good conditions; dashed = bad conditions
- Line Symbol
- ▲ Triangle = sprint (7f or less); ● Circle = route (more than 7f)
- Days Between Races
- Small number above each bubble (e.g. 19d) = days since the previous race — helps spot freshness, layoffs, and tight scheduling.
- Shaded Band (Bollinger)
- Highlights volatility — a wider band means more variation in recent performance
- Performance Trend
- Straight line showing the overall performance direction — angled up = improving, angled down = declining
- Dashed Reference Line
- AI Opponent = AI analysis class-level par for the race
AI Model History Guide
- Lines
- Each solid line shows this horse’s model score over its last 10 races: blue = Mod1, green = Mod2, amber = Mod3.
- Dashed Lines
- Dashed lines represent the current race’s field average for each model — a score below the dashed line indicates the horse ranked below average in this model’s assessment.
- Higher is Stronger
- All three model scores are 0–100: a higher number means the model rates this horse more favorably among the field.
Mod1(W): 82 (1/8) Mod2(W): 75 (2/8) Mod3(W): 79 (3/8) Mod1-LS: 55 (6/8) Win Prob: 18.4% Value Score: 1.35 ★
Performance vs. Peers Guide
- Bars (per post)
- Blue = avg career performance • Amber = avg last 3 races • Green = last race (improved vs. avg) • Red = last race (declined vs. avg)
- Trend Line
- Angled line above the bars: rising = improving form • falling = declining form.
- Horizontal Line
- Field average — the mean career performance of all horses in this race.
- Color Circles
- Standard post-position colors below each lane — same as the Total Pace chart.
- Border
- Thicker border = this horse’s post position.
Figure Comparison
- Rating
- The three Pick Pony algorithm ratings (Algo 1, Algo 2, Algo 3) that make up the overall PP AI Rating — higher is a stronger contender rating.
- Speed
- Career average speed, recent 3-race average, and last-race speed figure — spot horses in improving or declining form.
- Pace
- Average Early (E1), Mid (E2), and Stretch (LP) pace figures — reveals pace-setters vs. closers vs. all-the-way types.
- This horse
- The horse whose stats card is open is highlighted with a darker column background.
Winning Profiles
- Axes
- X: Win % from last 10 starts — Y: In-the-money % (top-3 finishes) from last 10 starts.
- Quadrants
- Consistent Winners (top-right): high win & ITM — reliable performers.
Place Threats (top-left): boards often but doesn’t win often — good exacta/trifecta angles.
Streaky (bottom-right): wins occasionally, misses the board often — all-or-nothing.
Developing (bottom-left): still finding form — longshot territory. - Reference Lines
- Dashed lines mark field averages. Dots to the right win more; dots higher board more.
- This horse
- Highlighted with a gold border and larger dot.
AI Model Comparison
- Winner Models (green)
- Mod1(W), Mod2(W), and Mod3(W) trained to predict race winners. Higher score = stronger contender.
- Longshot Models (red)
- Mod1-LS, Mod2-LS, and Mod3-LS trained to find high-value longshots. Higher score = stronger longshot candidate.
- Form Model (blue)
- Mod4 sequence model trained on recent form patterns. Higher score = stronger recent form profile.
- This horse
- Highlighted with a darker column background.
Race Pace Simulation Guide
- Slider
- Drag left→right to advance from gate to finish. Drag all the way back to reset the race.
- Predicted Finish Order
- Factors in contested pace burn, each horse’s effort curve (peaked-early vs. peaked-late), and wide trip cost from outside posts. Updated live when Track Bias changes.
- Pace Scenario
- Lone Speed: single E horse likely rates and holds. Contested: two E horses burn each other — closers benefit. Hot Pace: speed meltdown, deep closers thrive. Soft: no early speed, moderate fractions throughout.
- Track Bias
- Slider below canvas. −2 = strong closer/wet bias; +2 = strong speed/rail bias. Recomputes the predicted finish order.
- Boxed Indicator
- Dashed orange ring = horse is surrounded (rival ahead, rival behind, wall outside). In a real race this horse must find a clear path to run.
- Running Styles
- E/EE = early speed (rushes to rail). P = presser (stalks the pace). S = stalker. SS = slow starter / closer.
| Stat | vs. Current Card | vs. All Horses |
|---|---|---|
| Averages
Career-average metrics across all AI race analysis. Performance and pace averages reflect estimated historical performance; trainer and jockey grades score in-the-money percentages. Grading scale: A = elite • B = above average • C = average • D = below average • F = poor • — = no data |
||
| Pick Pony AI Rating | B | C |
| Pace Trip Longshot | — | — |
| Connections Longshot | — | — |
| Situational Longshot | — | — |
| Speed | A | F |
| Early Pace | A | B |
| Mid Pace | A | D |
| Late Pace | C | D |
| Finish Pos | A | D |
| Dirt Speed | B | D |
| Turf Speed | C | D |
| Distance Speed | A | C |
| Trainer Effectiveness | B | D |
| Jockey Effectiveness | B | F |
| 3rd Party Ratings | A | D |
| Recent
Performance analysis from the horse's recent races, weighted to reflect current form. Sprint and Route FPS (Foot Per Second) measure pace efficiency over the horse's recent sprints and routes respectively. Grading scale: A = elite • B = above average • C = average • D = below average • F = poor • — = no data |
||
| Speed | A | D |
| Early Pace | A | C |
| Mid Pace | A | D |
| Late Pace | A | C |
| Sprint FPS | A | B |
| Route FPS | A | B |
| Trainer Effectiveness | B | D |
| Jockey Effectiveness | B | F |
| 3rd Party Ratings | A | D |
| Predictions
AI-generated projections for the upcoming race, derived from prior AI analysis for speed and pace trends, surface and distance suitability, and current conditions. Grading scale: A = elite • B = above average • C = average • D = below average • F = poor • — = no data |
||
| Speed | A | F |
| Early Pace | A | B |
| Mid Pace | A | C |
| Late Pace | C | C |
Chart Guide (2.0.36)
- Bubbles
- Color = surface: green (turf), brown (dirt), blue (synthetic)
- Top number = finishing position; bottom number in parentheses = starting post position
- Height above line = beaten lengths — closer means a smaller margin
- Border = track conditions: green (FST/GD/FM), yellow (WF/SL/YLD), red (SY/MY/FRZ/SFT/HVY)
- Connecting Line
- Solid = good conditions; dashed = bad conditions
- Line Symbol
- ▲ Triangle = sprint (7f or less); ● Circle = route (more than 7f)
- Days Between Races
- Small number above each bubble (e.g. 19d) = days since the previous race — helps spot freshness, layoffs, and tight scheduling.
- Shaded Band (Bollinger)
- Highlights volatility — a wider band means more variation in recent performance
- Performance Trend
- Straight line showing the overall performance direction — angled up = improving, angled down = declining
- Dashed Reference Line
- AI Opponent = AI analysis class-level par for the race
AI Model History Guide
- Lines
- Each solid line shows this horse’s model score over its last 10 races: blue = Mod1, green = Mod2, amber = Mod3.
- Dashed Lines
- Dashed lines represent the current race’s field average for each model — a score below the dashed line indicates the horse ranked below average in this model’s assessment.
- Higher is Stronger
- All three model scores are 0–100: a higher number means the model rates this horse more favorably among the field.
Mod1(W): 82 (1/8) Mod2(W): 75 (2/8) Mod3(W): 79 (3/8) Mod1-LS: 55 (6/8) Win Prob: 18.4% Value Score: 1.35 ★
Performance vs. Peers Guide
- Bars (per post)
- Blue = avg career performance • Amber = avg last 3 races • Green = last race (improved vs. avg) • Red = last race (declined vs. avg)
- Trend Line
- Angled line above the bars: rising = improving form • falling = declining form.
- Horizontal Line
- Field average — the mean career performance of all horses in this race.
- Color Circles
- Standard post-position colors below each lane — same as the Total Pace chart.
- Border
- Thicker border = this horse’s post position.
Figure Comparison
- Rating
- The three Pick Pony algorithm ratings (Algo 1, Algo 2, Algo 3) that make up the overall PP AI Rating — higher is a stronger contender rating.
- Speed
- Career average speed, recent 3-race average, and last-race speed figure — spot horses in improving or declining form.
- Pace
- Average Early (E1), Mid (E2), and Stretch (LP) pace figures — reveals pace-setters vs. closers vs. all-the-way types.
- This horse
- The horse whose stats card is open is highlighted with a darker column background.
Winning Profiles
- Axes
- X: Win % from last 10 starts — Y: In-the-money % (top-3 finishes) from last 10 starts.
- Quadrants
- Consistent Winners (top-right): high win & ITM — reliable performers.
Place Threats (top-left): boards often but doesn’t win often — good exacta/trifecta angles.
Streaky (bottom-right): wins occasionally, misses the board often — all-or-nothing.
Developing (bottom-left): still finding form — longshot territory. - Reference Lines
- Dashed lines mark field averages. Dots to the right win more; dots higher board more.
- This horse
- Highlighted with a gold border and larger dot.
AI Model Comparison
- Winner Models (green)
- Mod1(W), Mod2(W), and Mod3(W) trained to predict race winners. Higher score = stronger contender.
- Longshot Models (red)
- Mod1-LS, Mod2-LS, and Mod3-LS trained to find high-value longshots. Higher score = stronger longshot candidate.
- Form Model (blue)
- Mod4 sequence model trained on recent form patterns. Higher score = stronger recent form profile.
- This horse
- Highlighted with a darker column background.
Race Pace Simulation Guide
- Slider
- Drag left→right to advance from gate to finish. Drag all the way back to reset the race.
- Predicted Finish Order
- Factors in contested pace burn, each horse’s effort curve (peaked-early vs. peaked-late), and wide trip cost from outside posts. Updated live when Track Bias changes.
- Pace Scenario
- Lone Speed: single E horse likely rates and holds. Contested: two E horses burn each other — closers benefit. Hot Pace: speed meltdown, deep closers thrive. Soft: no early speed, moderate fractions throughout.
- Track Bias
- Slider below canvas. −2 = strong closer/wet bias; +2 = strong speed/rail bias. Recomputes the predicted finish order.
- Boxed Indicator
- Dashed orange ring = horse is surrounded (rival ahead, rival behind, wall outside). In a real race this horse must find a clear path to run.
- Running Styles
- E/EE = early speed (rushes to rail). P = presser (stalks the pace). S = stalker. SS = slow starter / closer.
| Stat | vs. Current Card | vs. All Horses |
|---|---|---|
| Averages
Career-average metrics across all AI race analysis. Performance and pace averages reflect estimated historical performance; trainer and jockey grades score in-the-money percentages. Grading scale: A = elite • B = above average • C = average • D = below average • F = poor • — = no data |
||
| Pick Pony AI Rating | B | C |
| Pace Trip Longshot | — | — |
| Connections Longshot | — | — |
| Situational Longshot | — | — |
| Speed | B | F |
| Early Pace | D | D |
| Mid Pace | D | D |
| Late Pace | B | D |
| Finish Pos | C | F |
| Dirt Speed | B | D |
| Turf Speed | C | D |
| Distance Speed | B | C |
| Trainer Effectiveness | C | D |
| Jockey Effectiveness | C | F |
| 3rd Party Ratings | B | D |
| Recent
Performance analysis from the horse's recent races, weighted to reflect current form. Sprint and Route FPS (Foot Per Second) measure pace efficiency over the horse's recent sprints and routes respectively. Grading scale: A = elite • B = above average • C = average • D = below average • F = poor • — = no data |
||
| Speed | B | F |
| Early Pace | C | D |
| Mid Pace | B | D |
| Late Pace | C | D |
| Sprint FPS | C | D |
| Route FPS | C | D |
| Trainer Effectiveness | C | D |
| Jockey Effectiveness | C | F |
| 3rd Party Ratings | B | D |
| Predictions
AI-generated projections for the upcoming race, derived from prior AI analysis for speed and pace trends, surface and distance suitability, and current conditions. Grading scale: A = elite • B = above average • C = average • D = below average • F = poor • — = no data |
||
| Speed | B | F |
| Early Pace | D | D |
| Mid Pace | D | D |
| Late Pace | C | C |
Chart Guide (2.0.36)
- Bubbles
- Color = surface: green (turf), brown (dirt), blue (synthetic)
- Top number = finishing position; bottom number in parentheses = starting post position
- Height above line = beaten lengths — closer means a smaller margin
- Border = track conditions: green (FST/GD/FM), yellow (WF/SL/YLD), red (SY/MY/FRZ/SFT/HVY)
- Connecting Line
- Solid = good conditions; dashed = bad conditions
- Line Symbol
- ▲ Triangle = sprint (7f or less); ● Circle = route (more than 7f)
- Days Between Races
- Small number above each bubble (e.g. 19d) = days since the previous race — helps spot freshness, layoffs, and tight scheduling.
- Shaded Band (Bollinger)
- Highlights volatility — a wider band means more variation in recent performance
- Performance Trend
- Straight line showing the overall performance direction — angled up = improving, angled down = declining
- Dashed Reference Line
- AI Opponent = AI analysis class-level par for the race
AI Model History Guide
- Lines
- Each solid line shows this horse’s model score over its last 10 races: blue = Mod1, green = Mod2, amber = Mod3.
- Dashed Lines
- Dashed lines represent the current race’s field average for each model — a score below the dashed line indicates the horse ranked below average in this model’s assessment.
- Higher is Stronger
- All three model scores are 0–100: a higher number means the model rates this horse more favorably among the field.
Mod1(W): 82 (1/8) Mod2(W): 75 (2/8) Mod3(W): 79 (3/8) Mod1-LS: 55 (6/8) Win Prob: 18.4% Value Score: 1.35 ★
Performance vs. Peers Guide
- Bars (per post)
- Blue = avg career performance • Amber = avg last 3 races • Green = last race (improved vs. avg) • Red = last race (declined vs. avg)
- Trend Line
- Angled line above the bars: rising = improving form • falling = declining form.
- Horizontal Line
- Field average — the mean career performance of all horses in this race.
- Color Circles
- Standard post-position colors below each lane — same as the Total Pace chart.
- Border
- Thicker border = this horse’s post position.
Figure Comparison
- Rating
- The three Pick Pony algorithm ratings (Algo 1, Algo 2, Algo 3) that make up the overall PP AI Rating — higher is a stronger contender rating.
- Speed
- Career average speed, recent 3-race average, and last-race speed figure — spot horses in improving or declining form.
- Pace
- Average Early (E1), Mid (E2), and Stretch (LP) pace figures — reveals pace-setters vs. closers vs. all-the-way types.
- This horse
- The horse whose stats card is open is highlighted with a darker column background.
Winning Profiles
- Axes
- X: Win % from last 10 starts — Y: In-the-money % (top-3 finishes) from last 10 starts.
- Quadrants
- Consistent Winners (top-right): high win & ITM — reliable performers.
Place Threats (top-left): boards often but doesn’t win often — good exacta/trifecta angles.
Streaky (bottom-right): wins occasionally, misses the board often — all-or-nothing.
Developing (bottom-left): still finding form — longshot territory. - Reference Lines
- Dashed lines mark field averages. Dots to the right win more; dots higher board more.
- This horse
- Highlighted with a gold border and larger dot.
AI Model Comparison
- Winner Models (green)
- Mod1(W), Mod2(W), and Mod3(W) trained to predict race winners. Higher score = stronger contender.
- Longshot Models (red)
- Mod1-LS, Mod2-LS, and Mod3-LS trained to find high-value longshots. Higher score = stronger longshot candidate.
- Form Model (blue)
- Mod4 sequence model trained on recent form patterns. Higher score = stronger recent form profile.
- This horse
- Highlighted with a darker column background.
Race Pace Simulation Guide
- Slider
- Drag left→right to advance from gate to finish. Drag all the way back to reset the race.
- Predicted Finish Order
- Factors in contested pace burn, each horse’s effort curve (peaked-early vs. peaked-late), and wide trip cost from outside posts. Updated live when Track Bias changes.
- Pace Scenario
- Lone Speed: single E horse likely rates and holds. Contested: two E horses burn each other — closers benefit. Hot Pace: speed meltdown, deep closers thrive. Soft: no early speed, moderate fractions throughout.
- Track Bias
- Slider below canvas. −2 = strong closer/wet bias; +2 = strong speed/rail bias. Recomputes the predicted finish order.
- Boxed Indicator
- Dashed orange ring = horse is surrounded (rival ahead, rival behind, wall outside). In a real race this horse must find a clear path to run.
- Running Styles
- E/EE = early speed (rushes to rail). P = presser (stalks the pace). S = stalker. SS = slow starter / closer.
| Stat | vs. Current Card | vs. All Horses |
|---|---|---|
| Averages
Career-average metrics across all AI race analysis. Performance and pace averages reflect estimated historical performance; trainer and jockey grades score in-the-money percentages. Grading scale: A = elite • B = above average • C = average • D = below average • F = poor • — = no data |
||
| Pick Pony AI Rating | D | D |
| Pace Trip Longshot | — | — |
| Connections Longshot | — | — |
| Situational Longshot | — | — |
| Speed | F | D |
| Early Pace | D | C |
| Mid Pace | D | D |
| Late Pace | B | B |
| Finish Pos | F | D |
| Dirt Speed | D | C |
| Turf Speed | C | D |
| Distance Speed | C | F |
| Trainer Effectiveness | A | A |
| Jockey Effectiveness | C | A |
| 3rd Party Ratings | F | C |
| Recent
Performance analysis from the horse's recent races, weighted to reflect current form. Sprint and Route FPS (Foot Per Second) measure pace efficiency over the horse's recent sprints and routes respectively. Grading scale: A = elite • B = above average • C = average • D = below average • F = poor • — = no data |
||
| Speed | F | D |
| Early Pace | D | C |
| Mid Pace | D | D |
| Late Pace | A | B |
| Sprint FPS | D | D |
| Route FPS | D | D |
| Trainer Effectiveness | A | A |
| Jockey Effectiveness | C | A |
| 3rd Party Ratings | F | C |
| Predictions
AI-generated projections for the upcoming race, derived from prior AI analysis for speed and pace trends, surface and distance suitability, and current conditions. Grading scale: A = elite • B = above average • C = average • D = below average • F = poor • — = no data |
||
| Speed | F | D |
| Early Pace | D | C |
| Mid Pace | C | F |
| Late Pace | C | C |
Chart Guide (2.0.36)
- Bubbles
- Color = surface: green (turf), brown (dirt), blue (synthetic)
- Top number = finishing position; bottom number in parentheses = starting post position
- Height above line = beaten lengths — closer means a smaller margin
- Border = track conditions: green (FST/GD/FM), yellow (WF/SL/YLD), red (SY/MY/FRZ/SFT/HVY)
- Connecting Line
- Solid = good conditions; dashed = bad conditions
- Line Symbol
- ▲ Triangle = sprint (7f or less); ● Circle = route (more than 7f)
- Days Between Races
- Small number above each bubble (e.g. 19d) = days since the previous race — helps spot freshness, layoffs, and tight scheduling.
- Shaded Band (Bollinger)
- Highlights volatility — a wider band means more variation in recent performance
- Performance Trend
- Straight line showing the overall performance direction — angled up = improving, angled down = declining
- Dashed Reference Line
- AI Opponent = AI analysis class-level par for the race
AI Model History Guide
- Lines
- Each solid line shows this horse’s model score over its last 10 races: blue = Mod1, green = Mod2, amber = Mod3.
- Dashed Lines
- Dashed lines represent the current race’s field average for each model — a score below the dashed line indicates the horse ranked below average in this model’s assessment.
- Higher is Stronger
- All three model scores are 0–100: a higher number means the model rates this horse more favorably among the field.
Mod1(W): 82 (1/8) Mod2(W): 75 (2/8) Mod3(W): 79 (3/8) Mod1-LS: 55 (6/8) Win Prob: 18.4% Value Score: 1.35 ★
Performance vs. Peers Guide
- Bars (per post)
- Blue = avg career performance • Amber = avg last 3 races • Green = last race (improved vs. avg) • Red = last race (declined vs. avg)
- Trend Line
- Angled line above the bars: rising = improving form • falling = declining form.
- Horizontal Line
- Field average — the mean career performance of all horses in this race.
- Color Circles
- Standard post-position colors below each lane — same as the Total Pace chart.
- Border
- Thicker border = this horse’s post position.
Figure Comparison
- Rating
- The three Pick Pony algorithm ratings (Algo 1, Algo 2, Algo 3) that make up the overall PP AI Rating — higher is a stronger contender rating.
- Speed
- Career average speed, recent 3-race average, and last-race speed figure — spot horses in improving or declining form.
- Pace
- Average Early (E1), Mid (E2), and Stretch (LP) pace figures — reveals pace-setters vs. closers vs. all-the-way types.
- This horse
- The horse whose stats card is open is highlighted with a darker column background.
Winning Profiles
- Axes
- X: Win % from last 10 starts — Y: In-the-money % (top-3 finishes) from last 10 starts.
- Quadrants
- Consistent Winners (top-right): high win & ITM — reliable performers.
Place Threats (top-left): boards often but doesn’t win often — good exacta/trifecta angles.
Streaky (bottom-right): wins occasionally, misses the board often — all-or-nothing.
Developing (bottom-left): still finding form — longshot territory. - Reference Lines
- Dashed lines mark field averages. Dots to the right win more; dots higher board more.
- This horse
- Highlighted with a gold border and larger dot.
AI Model Comparison
- Winner Models (green)
- Mod1(W), Mod2(W), and Mod3(W) trained to predict race winners. Higher score = stronger contender.
- Longshot Models (red)
- Mod1-LS, Mod2-LS, and Mod3-LS trained to find high-value longshots. Higher score = stronger longshot candidate.
- Form Model (blue)
- Mod4 sequence model trained on recent form patterns. Higher score = stronger recent form profile.
- This horse
- Highlighted with a darker column background.
Race Pace Simulation Guide
- Slider
- Drag left→right to advance from gate to finish. Drag all the way back to reset the race.
- Predicted Finish Order
- Factors in contested pace burn, each horse’s effort curve (peaked-early vs. peaked-late), and wide trip cost from outside posts. Updated live when Track Bias changes.
- Pace Scenario
- Lone Speed: single E horse likely rates and holds. Contested: two E horses burn each other — closers benefit. Hot Pace: speed meltdown, deep closers thrive. Soft: no early speed, moderate fractions throughout.
- Track Bias
- Slider below canvas. −2 = strong closer/wet bias; +2 = strong speed/rail bias. Recomputes the predicted finish order.
- Boxed Indicator
- Dashed orange ring = horse is surrounded (rival ahead, rival behind, wall outside). In a real race this horse must find a clear path to run.
- Running Styles
- E/EE = early speed (rushes to rail). P = presser (stalks the pace). S = stalker. SS = slow starter / closer.
| Stat | vs. Current Card | vs. All Horses |
|---|---|---|
| Averages
Career-average metrics across all AI race analysis. Performance and pace averages reflect estimated historical performance; trainer and jockey grades score in-the-money percentages. Grading scale: A = elite • B = above average • C = average • D = below average • F = poor • — = no data |
||
| Pick Pony AI Rating | A | B |
| Pace Trip Longshot | — | — |
| Connections Longshot | — | — |
| Situational Longshot | — | — |
| Speed | A | C |
| Early Pace | A | A |
| Mid Pace | A | A |
| Late Pace | C | C |
| Finish Pos | C | B |
| Dirt Speed | A | B |
| Turf Speed | C | D |
| Distance Speed | A | C |
| Trainer Effectiveness | B | B |
| Jockey Effectiveness | D | B |
| 3rd Party Ratings | A | B |
| Recent
Performance analysis from the horse's recent races, weighted to reflect current form. Sprint and Route FPS (Foot Per Second) measure pace efficiency over the horse's recent sprints and routes respectively. Grading scale: A = elite • B = above average • C = average • D = below average • F = poor • — = no data |
||
| Speed | A | C |
| Early Pace | A | A |
| Mid Pace | A | A |
| Late Pace | C | C |
| Sprint FPS | A | A |
| Route FPS | A | B |
| Trainer Effectiveness | B | B |
| Jockey Effectiveness | D | B |
| 3rd Party Ratings | A | B |
| Predictions
AI-generated projections for the upcoming race, derived from prior AI analysis for speed and pace trends, surface and distance suitability, and current conditions. Grading scale: A = elite • B = above average • C = average • D = below average • F = poor • — = no data |
||
| Speed | B | C |
| Early Pace | A | A |
| Mid Pace | A | A |
| Late Pace | C | C |
Chart Guide (2.0.36)
- Bubbles
- Color = surface: green (turf), brown (dirt), blue (synthetic)
- Top number = finishing position; bottom number in parentheses = starting post position
- Height above line = beaten lengths — closer means a smaller margin
- Border = track conditions: green (FST/GD/FM), yellow (WF/SL/YLD), red (SY/MY/FRZ/SFT/HVY)
- Connecting Line
- Solid = good conditions; dashed = bad conditions
- Line Symbol
- ▲ Triangle = sprint (7f or less); ● Circle = route (more than 7f)
- Days Between Races
- Small number above each bubble (e.g. 19d) = days since the previous race — helps spot freshness, layoffs, and tight scheduling.
- Shaded Band (Bollinger)
- Highlights volatility — a wider band means more variation in recent performance
- Performance Trend
- Straight line showing the overall performance direction — angled up = improving, angled down = declining
- Dashed Reference Line
- AI Opponent = AI analysis class-level par for the race
AI Model History Guide
- Lines
- Each solid line shows this horse’s model score over its last 10 races: blue = Mod1, green = Mod2, amber = Mod3.
- Dashed Lines
- Dashed lines represent the current race’s field average for each model — a score below the dashed line indicates the horse ranked below average in this model’s assessment.
- Higher is Stronger
- All three model scores are 0–100: a higher number means the model rates this horse more favorably among the field.
Mod1(W): 82 (1/8) Mod2(W): 75 (2/8) Mod3(W): 79 (3/8) Mod1-LS: 55 (6/8) Win Prob: 18.4% Value Score: 1.35 ★
Performance vs. Peers Guide
- Bars (per post)
- Blue = avg career performance • Amber = avg last 3 races • Green = last race (improved vs. avg) • Red = last race (declined vs. avg)
- Trend Line
- Angled line above the bars: rising = improving form • falling = declining form.
- Horizontal Line
- Field average — the mean career performance of all horses in this race.
- Color Circles
- Standard post-position colors below each lane — same as the Total Pace chart.
- Border
- Thicker border = this horse’s post position.
Figure Comparison
- Rating
- The three Pick Pony algorithm ratings (Algo 1, Algo 2, Algo 3) that make up the overall PP AI Rating — higher is a stronger contender rating.
- Speed
- Career average speed, recent 3-race average, and last-race speed figure — spot horses in improving or declining form.
- Pace
- Average Early (E1), Mid (E2), and Stretch (LP) pace figures — reveals pace-setters vs. closers vs. all-the-way types.
- This horse
- The horse whose stats card is open is highlighted with a darker column background.
Winning Profiles
- Axes
- X: Win % from last 10 starts — Y: In-the-money % (top-3 finishes) from last 10 starts.
- Quadrants
- Consistent Winners (top-right): high win & ITM — reliable performers.
Place Threats (top-left): boards often but doesn’t win often — good exacta/trifecta angles.
Streaky (bottom-right): wins occasionally, misses the board often — all-or-nothing.
Developing (bottom-left): still finding form — longshot territory. - Reference Lines
- Dashed lines mark field averages. Dots to the right win more; dots higher board more.
- This horse
- Highlighted with a gold border and larger dot.
AI Model Comparison
- Winner Models (green)
- Mod1(W), Mod2(W), and Mod3(W) trained to predict race winners. Higher score = stronger contender.
- Longshot Models (red)
- Mod1-LS, Mod2-LS, and Mod3-LS trained to find high-value longshots. Higher score = stronger longshot candidate.
- Form Model (blue)
- Mod4 sequence model trained on recent form patterns. Higher score = stronger recent form profile.
- This horse
- Highlighted with a darker column background.
Race Pace Simulation Guide
- Slider
- Drag left→right to advance from gate to finish. Drag all the way back to reset the race.
- Predicted Finish Order
- Factors in contested pace burn, each horse’s effort curve (peaked-early vs. peaked-late), and wide trip cost from outside posts. Updated live when Track Bias changes.
- Pace Scenario
- Lone Speed: single E horse likely rates and holds. Contested: two E horses burn each other — closers benefit. Hot Pace: speed meltdown, deep closers thrive. Soft: no early speed, moderate fractions throughout.
- Track Bias
- Slider below canvas. −2 = strong closer/wet bias; +2 = strong speed/rail bias. Recomputes the predicted finish order.
- Boxed Indicator
- Dashed orange ring = horse is surrounded (rival ahead, rival behind, wall outside). In a real race this horse must find a clear path to run.
- Running Styles
- E/EE = early speed (rushes to rail). P = presser (stalks the pace). S = stalker. SS = slow starter / closer.
| Stat | vs. Current Card | vs. All Horses |
|---|---|---|
| Averages
Career-average metrics across all AI race analysis. Performance and pace averages reflect estimated historical performance; trainer and jockey grades score in-the-money percentages. Grading scale: A = elite • B = above average • C = average • D = below average • F = poor • — = no data |
||
| Pick Pony AI Rating | A | C |
| Pace Trip Longshot | — | — |
| Connections Longshot | — | — |
| Situational Longshot | — | — |
| Speed | A | B |
| Early Pace | A | A |
| Mid Pace | F | F |
| Late Pace | A | B |
| Finish Pos | A | A |
| Dirt Speed | A | B |
| Turf Speed | C | D |
| Distance Speed | C | F |
| Trainer Effectiveness | F | D |
| Jockey Effectiveness | A | A |
| 3rd Party Ratings | A | B |
| Recent
Performance analysis from the horse's recent races, weighted to reflect current form. Sprint and Route FPS (Foot Per Second) measure pace efficiency over the horse's recent sprints and routes respectively. Grading scale: A = elite • B = above average • C = average • D = below average • F = poor • — = no data |
||
| Speed | A | B |
| Early Pace | A | A |
| Mid Pace | F | F |
| Late Pace | B | B |
| Sprint FPS | F | F |
| Route FPS | F | F |
| Trainer Effectiveness | F | D |
| Jockey Effectiveness | A | A |
| 3rd Party Ratings | A | B |
| Predictions
AI-generated projections for the upcoming race, derived from prior AI analysis for speed and pace trends, surface and distance suitability, and current conditions. Grading scale: A = elite • B = above average • C = average • D = below average • F = poor • — = no data |
||
| Speed | A | A |
| Early Pace | A | A |
| Mid Pace | C | F |
| Late Pace | C | C |
Chart Guide (2.0.36)
- Bubbles
- Color = surface: green (turf), brown (dirt), blue (synthetic)
- Top number = finishing position; bottom number in parentheses = starting post position
- Height above line = beaten lengths — closer means a smaller margin
- Border = track conditions: green (FST/GD/FM), yellow (WF/SL/YLD), red (SY/MY/FRZ/SFT/HVY)
- Connecting Line
- Solid = good conditions; dashed = bad conditions
- Line Symbol
- ▲ Triangle = sprint (7f or less); ● Circle = route (more than 7f)
- Days Between Races
- Small number above each bubble (e.g. 19d) = days since the previous race — helps spot freshness, layoffs, and tight scheduling.
- Shaded Band (Bollinger)
- Highlights volatility — a wider band means more variation in recent performance
- Performance Trend
- Straight line showing the overall performance direction — angled up = improving, angled down = declining
- Dashed Reference Line
- AI Opponent = AI analysis class-level par for the race
AI Model History Guide
- Lines
- Each solid line shows this horse’s model score over its last 10 races: blue = Mod1, green = Mod2, amber = Mod3.
- Dashed Lines
- Dashed lines represent the current race’s field average for each model — a score below the dashed line indicates the horse ranked below average in this model’s assessment.
- Higher is Stronger
- All three model scores are 0–100: a higher number means the model rates this horse more favorably among the field.
Mod1(W): 82 (1/8) Mod2(W): 75 (2/8) Mod3(W): 79 (3/8) Mod1-LS: 55 (6/8) Win Prob: 18.4% Value Score: 1.35 ★
Performance vs. Peers Guide
- Bars (per post)
- Blue = avg career performance • Amber = avg last 3 races • Green = last race (improved vs. avg) • Red = last race (declined vs. avg)
- Trend Line
- Angled line above the bars: rising = improving form • falling = declining form.
- Horizontal Line
- Field average — the mean career performance of all horses in this race.
- Color Circles
- Standard post-position colors below each lane — same as the Total Pace chart.
- Border
- Thicker border = this horse’s post position.
Figure Comparison
- Rating
- The three Pick Pony algorithm ratings (Algo 1, Algo 2, Algo 3) that make up the overall PP AI Rating — higher is a stronger contender rating.
- Speed
- Career average speed, recent 3-race average, and last-race speed figure — spot horses in improving or declining form.
- Pace
- Average Early (E1), Mid (E2), and Stretch (LP) pace figures — reveals pace-setters vs. closers vs. all-the-way types.
- This horse
- The horse whose stats card is open is highlighted with a darker column background.
Winning Profiles
- Axes
- X: Win % from last 10 starts — Y: In-the-money % (top-3 finishes) from last 10 starts.
- Quadrants
- Consistent Winners (top-right): high win & ITM — reliable performers.
Place Threats (top-left): boards often but doesn’t win often — good exacta/trifecta angles.
Streaky (bottom-right): wins occasionally, misses the board often — all-or-nothing.
Developing (bottom-left): still finding form — longshot territory. - Reference Lines
- Dashed lines mark field averages. Dots to the right win more; dots higher board more.
- This horse
- Highlighted with a gold border and larger dot.
AI Model Comparison
- Winner Models (green)
- Mod1(W), Mod2(W), and Mod3(W) trained to predict race winners. Higher score = stronger contender.
- Longshot Models (red)
- Mod1-LS, Mod2-LS, and Mod3-LS trained to find high-value longshots. Higher score = stronger longshot candidate.
- Form Model (blue)
- Mod4 sequence model trained on recent form patterns. Higher score = stronger recent form profile.
- This horse
- Highlighted with a darker column background.
Race Pace Simulation Guide
- Slider
- Drag left→right to advance from gate to finish. Drag all the way back to reset the race.
- Predicted Finish Order
- Factors in contested pace burn, each horse’s effort curve (peaked-early vs. peaked-late), and wide trip cost from outside posts. Updated live when Track Bias changes.
- Pace Scenario
- Lone Speed: single E horse likely rates and holds. Contested: two E horses burn each other — closers benefit. Hot Pace: speed meltdown, deep closers thrive. Soft: no early speed, moderate fractions throughout.
- Track Bias
- Slider below canvas. −2 = strong closer/wet bias; +2 = strong speed/rail bias. Recomputes the predicted finish order.
- Boxed Indicator
- Dashed orange ring = horse is surrounded (rival ahead, rival behind, wall outside). In a real race this horse must find a clear path to run.
- Running Styles
- E/EE = early speed (rushes to rail). P = presser (stalks the pace). S = stalker. SS = slow starter / closer.
| Stat | vs. Current Card | vs. All Horses |
|---|---|---|
| Averages
Career-average metrics across all AI race analysis. Performance and pace averages reflect estimated historical performance; trainer and jockey grades score in-the-money percentages. Grading scale: A = elite • B = above average • C = average • D = below average • F = poor • — = no data |
||
| Pick Pony AI Rating | B | D |
| Pace Trip Longshot | — | — |
| Connections Longshot | — | — |
| Situational Longshot | — | — |
| Speed | D | C |
| Early Pace | C | A |
| Mid Pace | A | B |
| Late Pace | D | C |
| Finish Pos | C | B |
| Dirt Speed | B | C |
| Turf Speed | C | D |
| Distance Speed | C | F |
| Trainer Effectiveness | C | C |
| Jockey Effectiveness | A | A |
| 3rd Party Ratings | C | B |
| Recent
Performance analysis from the horse's recent races, weighted to reflect current form. Sprint and Route FPS (Foot Per Second) measure pace efficiency over the horse's recent sprints and routes respectively. Grading scale: A = elite • B = above average • C = average • D = below average • F = poor • — = no data |
||
| Speed | D | D |
| Early Pace | B | A |
| Mid Pace | A | B |
| Late Pace | F | D |
| Sprint FPS | C | C |
| Route FPS | C | C |
| Trainer Effectiveness | C | C |
| Jockey Effectiveness | A | A |
| 3rd Party Ratings | C | B |
| Predictions
AI-generated projections for the upcoming race, derived from prior AI analysis for speed and pace trends, surface and distance suitability, and current conditions. Grading scale: A = elite • B = above average • C = average • D = below average • F = poor • — = no data |
||
| Speed | D | D |
| Early Pace | B | A |
| Mid Pace | C | F |
| Late Pace | C | C |
Chart Guide (2.0.36)
- Bubbles
- Color = surface: green (turf), brown (dirt), blue (synthetic)
- Top number = finishing position; bottom number in parentheses = starting post position
- Height above line = beaten lengths — closer means a smaller margin
- Border = track conditions: green (FST/GD/FM), yellow (WF/SL/YLD), red (SY/MY/FRZ/SFT/HVY)
- Connecting Line
- Solid = good conditions; dashed = bad conditions
- Line Symbol
- ▲ Triangle = sprint (7f or less); ● Circle = route (more than 7f)
- Days Between Races
- Small number above each bubble (e.g. 19d) = days since the previous race — helps spot freshness, layoffs, and tight scheduling.
- Shaded Band (Bollinger)
- Highlights volatility — a wider band means more variation in recent performance
- Performance Trend
- Straight line showing the overall performance direction — angled up = improving, angled down = declining
- Dashed Reference Line
- AI Opponent = AI analysis class-level par for the race
AI Model History Guide
- Lines
- Each solid line shows this horse’s model score over its last 10 races: blue = Mod1, green = Mod2, amber = Mod3.
- Dashed Lines
- Dashed lines represent the current race’s field average for each model — a score below the dashed line indicates the horse ranked below average in this model’s assessment.
- Higher is Stronger
- All three model scores are 0–100: a higher number means the model rates this horse more favorably among the field.
Mod1(W): 82 (1/8) Mod2(W): 75 (2/8) Mod3(W): 79 (3/8) Mod1-LS: 55 (6/8) Win Prob: 18.4% Value Score: 1.35 ★
Performance vs. Peers Guide
- Bars (per post)
- Blue = avg career performance • Amber = avg last 3 races • Green = last race (improved vs. avg) • Red = last race (declined vs. avg)
- Trend Line
- Angled line above the bars: rising = improving form • falling = declining form.
- Horizontal Line
- Field average — the mean career performance of all horses in this race.
- Color Circles
- Standard post-position colors below each lane — same as the Total Pace chart.
- Border
- Thicker border = this horse’s post position.
Figure Comparison
- Rating
- The three Pick Pony algorithm ratings (Algo 1, Algo 2, Algo 3) that make up the overall PP AI Rating — higher is a stronger contender rating.
- Speed
- Career average speed, recent 3-race average, and last-race speed figure — spot horses in improving or declining form.
- Pace
- Average Early (E1), Mid (E2), and Stretch (LP) pace figures — reveals pace-setters vs. closers vs. all-the-way types.
- This horse
- The horse whose stats card is open is highlighted with a darker column background.
Winning Profiles
- Axes
- X: Win % from last 10 starts — Y: In-the-money % (top-3 finishes) from last 10 starts.
- Quadrants
- Consistent Winners (top-right): high win & ITM — reliable performers.
Place Threats (top-left): boards often but doesn’t win often — good exacta/trifecta angles.
Streaky (bottom-right): wins occasionally, misses the board often — all-or-nothing.
Developing (bottom-left): still finding form — longshot territory. - Reference Lines
- Dashed lines mark field averages. Dots to the right win more; dots higher board more.
- This horse
- Highlighted with a gold border and larger dot.
AI Model Comparison
- Winner Models (green)
- Mod1(W), Mod2(W), and Mod3(W) trained to predict race winners. Higher score = stronger contender.
- Longshot Models (red)
- Mod1-LS, Mod2-LS, and Mod3-LS trained to find high-value longshots. Higher score = stronger longshot candidate.
- Form Model (blue)
- Mod4 sequence model trained on recent form patterns. Higher score = stronger recent form profile.
- This horse
- Highlighted with a darker column background.
Race Pace Simulation Guide
- Slider
- Drag left→right to advance from gate to finish. Drag all the way back to reset the race.
- Predicted Finish Order
- Factors in contested pace burn, each horse’s effort curve (peaked-early vs. peaked-late), and wide trip cost from outside posts. Updated live when Track Bias changes.
- Pace Scenario
- Lone Speed: single E horse likely rates and holds. Contested: two E horses burn each other — closers benefit. Hot Pace: speed meltdown, deep closers thrive. Soft: no early speed, moderate fractions throughout.
- Track Bias
- Slider below canvas. −2 = strong closer/wet bias; +2 = strong speed/rail bias. Recomputes the predicted finish order.
- Boxed Indicator
- Dashed orange ring = horse is surrounded (rival ahead, rival behind, wall outside). In a real race this horse must find a clear path to run.
- Running Styles
- E/EE = early speed (rushes to rail). P = presser (stalks the pace). S = stalker. SS = slow starter / closer.
| Stat | vs. Current Card | vs. All Horses |
|---|---|---|
| Averages
Career-average metrics across all AI race analysis. Performance and pace averages reflect estimated historical performance; trainer and jockey grades score in-the-money percentages. Grading scale: A = elite • B = above average • C = average • D = below average • F = poor • — = no data |
||
| Pick Pony AI Rating | C | D |
| Pace Trip Longshot | — | — |
| Connections Longshot | — | — |
| Situational Longshot | — | — |
| Speed | B | C |
| Early Pace | C | A |
| Mid Pace | B | B |
| Late Pace | F | C |
| Finish Pos | B | B |
| Dirt Speed | C | C |
| Turf Speed | C | D |
| Distance Speed | C | F |
| Trainer Effectiveness | A | A |
| Jockey Effectiveness | B | A |
| 3rd Party Ratings | B | B |
| Recent
Performance analysis from the horse's recent races, weighted to reflect current form. Sprint and Route FPS (Foot Per Second) measure pace efficiency over the horse's recent sprints and routes respectively. Grading scale: A = elite • B = above average • C = average • D = below average • F = poor • — = no data |
||
| Speed | B | C |
| Early Pace | C | A |
| Mid Pace | B | B |
| Late Pace | D | C |
| Sprint FPS | B | B |
| Route FPS | B | B |
| Trainer Effectiveness | A | A |
| Jockey Effectiveness | B | A |
| 3rd Party Ratings | B | B |
| Predictions
AI-generated projections for the upcoming race, derived from prior AI analysis for speed and pace trends, surface and distance suitability, and current conditions. Grading scale: A = elite • B = above average • C = average • D = below average • F = poor • — = no data |
||
| Speed | A | A |
| Early Pace | C | A |
| Mid Pace | C | F |
| Late Pace | C | C |
Chart Guide (2.0.36)
- Bubbles
- Color = surface: green (turf), brown (dirt), blue (synthetic)
- Top number = finishing position; bottom number in parentheses = starting post position
- Height above line = beaten lengths — closer means a smaller margin
- Border = track conditions: green (FST/GD/FM), yellow (WF/SL/YLD), red (SY/MY/FRZ/SFT/HVY)
- Connecting Line
- Solid = good conditions; dashed = bad conditions
- Line Symbol
- ▲ Triangle = sprint (7f or less); ● Circle = route (more than 7f)
- Days Between Races
- Small number above each bubble (e.g. 19d) = days since the previous race — helps spot freshness, layoffs, and tight scheduling.
- Shaded Band (Bollinger)
- Highlights volatility — a wider band means more variation in recent performance
- Performance Trend
- Straight line showing the overall performance direction — angled up = improving, angled down = declining
- Dashed Reference Line
- AI Opponent = AI analysis class-level par for the race
AI Model History Guide
- Lines
- Each solid line shows this horse’s model score over its last 10 races: blue = Mod1, green = Mod2, amber = Mod3.
- Dashed Lines
- Dashed lines represent the current race’s field average for each model — a score below the dashed line indicates the horse ranked below average in this model’s assessment.
- Higher is Stronger
- All three model scores are 0–100: a higher number means the model rates this horse more favorably among the field.
Mod1(W): 82 (1/8) Mod2(W): 75 (2/8) Mod3(W): 79 (3/8) Mod1-LS: 55 (6/8) Win Prob: 18.4% Value Score: 1.35 ★
Performance vs. Peers Guide
- Bars (per post)
- Blue = avg career performance • Amber = avg last 3 races • Green = last race (improved vs. avg) • Red = last race (declined vs. avg)
- Trend Line
- Angled line above the bars: rising = improving form • falling = declining form.
- Horizontal Line
- Field average — the mean career performance of all horses in this race.
- Color Circles
- Standard post-position colors below each lane — same as the Total Pace chart.
- Border
- Thicker border = this horse’s post position.
Figure Comparison
- Rating
- The three Pick Pony algorithm ratings (Algo 1, Algo 2, Algo 3) that make up the overall PP AI Rating — higher is a stronger contender rating.
- Speed
- Career average speed, recent 3-race average, and last-race speed figure — spot horses in improving or declining form.
- Pace
- Average Early (E1), Mid (E2), and Stretch (LP) pace figures — reveals pace-setters vs. closers vs. all-the-way types.
- This horse
- The horse whose stats card is open is highlighted with a darker column background.
Winning Profiles
- Axes
- X: Win % from last 10 starts — Y: In-the-money % (top-3 finishes) from last 10 starts.
- Quadrants
- Consistent Winners (top-right): high win & ITM — reliable performers.
Place Threats (top-left): boards often but doesn’t win often — good exacta/trifecta angles.
Streaky (bottom-right): wins occasionally, misses the board often — all-or-nothing.
Developing (bottom-left): still finding form — longshot territory. - Reference Lines
- Dashed lines mark field averages. Dots to the right win more; dots higher board more.
- This horse
- Highlighted with a gold border and larger dot.
AI Model Comparison
- Winner Models (green)
- Mod1(W), Mod2(W), and Mod3(W) trained to predict race winners. Higher score = stronger contender.
- Longshot Models (red)
- Mod1-LS, Mod2-LS, and Mod3-LS trained to find high-value longshots. Higher score = stronger longshot candidate.
- Form Model (blue)
- Mod4 sequence model trained on recent form patterns. Higher score = stronger recent form profile.
- This horse
- Highlighted with a darker column background.
Race Pace Simulation Guide
- Slider
- Drag left→right to advance from gate to finish. Drag all the way back to reset the race.
- Predicted Finish Order
- Factors in contested pace burn, each horse’s effort curve (peaked-early vs. peaked-late), and wide trip cost from outside posts. Updated live when Track Bias changes.
- Pace Scenario
- Lone Speed: single E horse likely rates and holds. Contested: two E horses burn each other — closers benefit. Hot Pace: speed meltdown, deep closers thrive. Soft: no early speed, moderate fractions throughout.
- Track Bias
- Slider below canvas. −2 = strong closer/wet bias; +2 = strong speed/rail bias. Recomputes the predicted finish order.
- Boxed Indicator
- Dashed orange ring = horse is surrounded (rival ahead, rival behind, wall outside). In a real race this horse must find a clear path to run.
- Running Styles
- E/EE = early speed (rushes to rail). P = presser (stalks the pace). S = stalker. SS = slow starter / closer.
| Stat | vs. Current Card | vs. All Horses |
|---|---|---|
| Averages
Career-average metrics across all AI race analysis. Performance and pace averages reflect estimated historical performance; trainer and jockey grades score in-the-money percentages. Grading scale: A = elite • B = above average • C = average • D = below average • F = poor • — = no data |
||
| Pick Pony AI Rating | A | D |
| Pace Trip Longshot | — | — |
| Connections Longshot | — | — |
| Situational Longshot | — | — |
| Speed | B | F |
| Early Pace | B | C |
| Mid Pace | C | F |
| Late Pace | A | F |
| Finish Pos | F | F |
| Dirt Speed | B | D |
| Turf Speed | C | D |
| Distance Speed | A | D |
| Trainer Effectiveness | F | F |
| Jockey Effectiveness | A | A |
| 3rd Party Ratings | B | D |
| Recent
Performance analysis from the horse's recent races, weighted to reflect current form. Sprint and Route FPS (Foot Per Second) measure pace efficiency over the horse's recent sprints and routes respectively. Grading scale: A = elite • B = above average • C = average • D = below average • F = poor • — = no data |
||
| Speed | B | F |
| Early Pace | B | C |
| Mid Pace | C | F |
| Late Pace | A | D |
| Sprint FPS | C | F |
| Route FPS | C | F |
| Trainer Effectiveness | F | F |
| Jockey Effectiveness | A | A |
| 3rd Party Ratings | B | D |
| Predictions
AI-generated projections for the upcoming race, derived from prior AI analysis for speed and pace trends, surface and distance suitability, and current conditions. Grading scale: A = elite • B = above average • C = average • D = below average • F = poor • — = no data |
||
| Speed | B | F |
| Early Pace | C | F |
| Mid Pace | C | F |
| Late Pace | C | C |
Chart Guide (2.0.36)
- Bubbles
- Color = surface: green (turf), brown (dirt), blue (synthetic)
- Top number = finishing position; bottom number in parentheses = starting post position
- Height above line = beaten lengths — closer means a smaller margin
- Border = track conditions: green (FST/GD/FM), yellow (WF/SL/YLD), red (SY/MY/FRZ/SFT/HVY)
- Connecting Line
- Solid = good conditions; dashed = bad conditions
- Line Symbol
- ▲ Triangle = sprint (7f or less); ● Circle = route (more than 7f)
- Days Between Races
- Small number above each bubble (e.g. 19d) = days since the previous race — helps spot freshness, layoffs, and tight scheduling.
- Shaded Band (Bollinger)
- Highlights volatility — a wider band means more variation in recent performance
- Performance Trend
- Straight line showing the overall performance direction — angled up = improving, angled down = declining
- Dashed Reference Line
- AI Opponent = AI analysis class-level par for the race
AI Model History Guide
- Lines
- Each solid line shows this horse’s model score over its last 10 races: blue = Mod1, green = Mod2, amber = Mod3.
- Dashed Lines
- Dashed lines represent the current race’s field average for each model — a score below the dashed line indicates the horse ranked below average in this model’s assessment.
- Higher is Stronger
- All three model scores are 0–100: a higher number means the model rates this horse more favorably among the field.
Mod1(W): 82 (1/8) Mod2(W): 75 (2/8) Mod3(W): 79 (3/8) Mod1-LS: 55 (6/8) Win Prob: 18.4% Value Score: 1.35 ★
Performance vs. Peers Guide
- Bars (per post)
- Blue = avg career performance • Amber = avg last 3 races • Green = last race (improved vs. avg) • Red = last race (declined vs. avg)
- Trend Line
- Angled line above the bars: rising = improving form • falling = declining form.
- Horizontal Line
- Field average — the mean career performance of all horses in this race.
- Color Circles
- Standard post-position colors below each lane — same as the Total Pace chart.
- Border
- Thicker border = this horse’s post position.
Figure Comparison
- Rating
- The three Pick Pony algorithm ratings (Algo 1, Algo 2, Algo 3) that make up the overall PP AI Rating — higher is a stronger contender rating.
- Speed
- Career average speed, recent 3-race average, and last-race speed figure — spot horses in improving or declining form.
- Pace
- Average Early (E1), Mid (E2), and Stretch (LP) pace figures — reveals pace-setters vs. closers vs. all-the-way types.
- This horse
- The horse whose stats card is open is highlighted with a darker column background.
Winning Profiles
- Axes
- X: Win % from last 10 starts — Y: In-the-money % (top-3 finishes) from last 10 starts.
- Quadrants
- Consistent Winners (top-right): high win & ITM — reliable performers.
Place Threats (top-left): boards often but doesn’t win often — good exacta/trifecta angles.
Streaky (bottom-right): wins occasionally, misses the board often — all-or-nothing.
Developing (bottom-left): still finding form — longshot territory. - Reference Lines
- Dashed lines mark field averages. Dots to the right win more; dots higher board more.
- This horse
- Highlighted with a gold border and larger dot.
AI Model Comparison
- Winner Models (green)
- Mod1(W), Mod2(W), and Mod3(W) trained to predict race winners. Higher score = stronger contender.
- Longshot Models (red)
- Mod1-LS, Mod2-LS, and Mod3-LS trained to find high-value longshots. Higher score = stronger longshot candidate.
- Form Model (blue)
- Mod4 sequence model trained on recent form patterns. Higher score = stronger recent form profile.
- This horse
- Highlighted with a darker column background.
Race Pace Simulation Guide
- Slider
- Drag left→right to advance from gate to finish. Drag all the way back to reset the race.
- Predicted Finish Order
- Factors in contested pace burn, each horse’s effort curve (peaked-early vs. peaked-late), and wide trip cost from outside posts. Updated live when Track Bias changes.
- Pace Scenario
- Lone Speed: single E horse likely rates and holds. Contested: two E horses burn each other — closers benefit. Hot Pace: speed meltdown, deep closers thrive. Soft: no early speed, moderate fractions throughout.
- Track Bias
- Slider below canvas. −2 = strong closer/wet bias; +2 = strong speed/rail bias. Recomputes the predicted finish order.
- Boxed Indicator
- Dashed orange ring = horse is surrounded (rival ahead, rival behind, wall outside). In a real race this horse must find a clear path to run.
- Running Styles
- E/EE = early speed (rushes to rail). P = presser (stalks the pace). S = stalker. SS = slow starter / closer.
| Stat | vs. Current Card | vs. All Horses |
|---|---|---|
| Averages
Career-average metrics across all AI race analysis. Performance and pace averages reflect estimated historical performance; trainer and jockey grades score in-the-money percentages. Grading scale: A = elite • B = above average • C = average • D = below average • F = poor • — = no data |
||
| Pick Pony AI Rating | A | C |
| Pace Trip Longshot | — | — |
| Connections Longshot | — | — |
| Situational Longshot | — | — |
| Speed | A | F |
| Early Pace | B | D |
| Mid Pace | A | D |
| Late Pace | A | D |
| Finish Pos | B | A |
| Dirt Speed | A | D |
| Turf Speed | C | D |
| Distance Speed | D | F |
| Trainer Effectiveness | C | C |
| Jockey Effectiveness | A | A |
| 3rd Party Ratings | A | D |
| Recent
Performance analysis from the horse's recent races, weighted to reflect current form. Sprint and Route FPS (Foot Per Second) measure pace efficiency over the horse's recent sprints and routes respectively. Grading scale: A = elite • B = above average • C = average • D = below average • F = poor • — = no data |
||
| Speed | A | F |
| Early Pace | B | D |
| Mid Pace | A | D |
| Late Pace | A | D |
| Sprint FPS | A | D |
| Route FPS | A | C |
| Trainer Effectiveness | C | C |
| Jockey Effectiveness | A | A |
| 3rd Party Ratings | A | D |
| Predictions
AI-generated projections for the upcoming race, derived from prior AI analysis for speed and pace trends, surface and distance suitability, and current conditions. Grading scale: A = elite • B = above average • C = average • D = below average • F = poor • — = no data |
||
| Speed | A | A |
| Early Pace | A | D |
| Mid Pace | C | F |
| Late Pace | C | C |
Chart Guide (2.0.36)
- Bubbles
- Color = surface: green (turf), brown (dirt), blue (synthetic)
- Top number = finishing position; bottom number in parentheses = starting post position
- Height above line = beaten lengths — closer means a smaller margin
- Border = track conditions: green (FST/GD/FM), yellow (WF/SL/YLD), red (SY/MY/FRZ/SFT/HVY)
- Connecting Line
- Solid = good conditions; dashed = bad conditions
- Line Symbol
- ▲ Triangle = sprint (7f or less); ● Circle = route (more than 7f)
- Days Between Races
- Small number above each bubble (e.g. 19d) = days since the previous race — helps spot freshness, layoffs, and tight scheduling.
- Shaded Band (Bollinger)
- Highlights volatility — a wider band means more variation in recent performance
- Performance Trend
- Straight line showing the overall performance direction — angled up = improving, angled down = declining
- Dashed Reference Line
- AI Opponent = AI analysis class-level par for the race
AI Model History Guide
- Lines
- Each solid line shows this horse’s model score over its last 10 races: blue = Mod1, green = Mod2, amber = Mod3.
- Dashed Lines
- Dashed lines represent the current race’s field average for each model — a score below the dashed line indicates the horse ranked below average in this model’s assessment.
- Higher is Stronger
- All three model scores are 0–100: a higher number means the model rates this horse more favorably among the field.
Mod1(W): 82 (1/8) Mod2(W): 75 (2/8) Mod3(W): 79 (3/8) Mod1-LS: 55 (6/8) Win Prob: 18.4% Value Score: 1.35 ★
Performance vs. Peers Guide
- Bars (per post)
- Blue = avg career performance • Amber = avg last 3 races • Green = last race (improved vs. avg) • Red = last race (declined vs. avg)
- Trend Line
- Angled line above the bars: rising = improving form • falling = declining form.
- Horizontal Line
- Field average — the mean career performance of all horses in this race.
- Color Circles
- Standard post-position colors below each lane — same as the Total Pace chart.
- Border
- Thicker border = this horse’s post position.
Figure Comparison
- Rating
- The three Pick Pony algorithm ratings (Algo 1, Algo 2, Algo 3) that make up the overall PP AI Rating — higher is a stronger contender rating.
- Speed
- Career average speed, recent 3-race average, and last-race speed figure — spot horses in improving or declining form.
- Pace
- Average Early (E1), Mid (E2), and Stretch (LP) pace figures — reveals pace-setters vs. closers vs. all-the-way types.
- This horse
- The horse whose stats card is open is highlighted with a darker column background.
Winning Profiles
- Axes
- X: Win % from last 10 starts — Y: In-the-money % (top-3 finishes) from last 10 starts.
- Quadrants
- Consistent Winners (top-right): high win & ITM — reliable performers.
Place Threats (top-left): boards often but doesn’t win often — good exacta/trifecta angles.
Streaky (bottom-right): wins occasionally, misses the board often — all-or-nothing.
Developing (bottom-left): still finding form — longshot territory. - Reference Lines
- Dashed lines mark field averages. Dots to the right win more; dots higher board more.
- This horse
- Highlighted with a gold border and larger dot.
AI Model Comparison
- Winner Models (green)
- Mod1(W), Mod2(W), and Mod3(W) trained to predict race winners. Higher score = stronger contender.
- Longshot Models (red)
- Mod1-LS, Mod2-LS, and Mod3-LS trained to find high-value longshots. Higher score = stronger longshot candidate.
- Form Model (blue)
- Mod4 sequence model trained on recent form patterns. Higher score = stronger recent form profile.
- This horse
- Highlighted with a darker column background.
Race Pace Simulation Guide
- Slider
- Drag left→right to advance from gate to finish. Drag all the way back to reset the race.
- Predicted Finish Order
- Factors in contested pace burn, each horse’s effort curve (peaked-early vs. peaked-late), and wide trip cost from outside posts. Updated live when Track Bias changes.
- Pace Scenario
- Lone Speed: single E horse likely rates and holds. Contested: two E horses burn each other — closers benefit. Hot Pace: speed meltdown, deep closers thrive. Soft: no early speed, moderate fractions throughout.
- Track Bias
- Slider below canvas. −2 = strong closer/wet bias; +2 = strong speed/rail bias. Recomputes the predicted finish order.
- Boxed Indicator
- Dashed orange ring = horse is surrounded (rival ahead, rival behind, wall outside). In a real race this horse must find a clear path to run.
- Running Styles
- E/EE = early speed (rushes to rail). P = presser (stalks the pace). S = stalker. SS = slow starter / closer.
| Stat | vs. Current Card | vs. All Horses |
|---|---|---|
| Averages
Career-average metrics across all AI race analysis. Performance and pace averages reflect estimated historical performance; trainer and jockey grades score in-the-money percentages. Grading scale: A = elite • B = above average • C = average • D = below average • F = poor • — = no data |
||
| Pick Pony AI Rating | A | B |
| Pace Trip Longshot | — | — |
| Connections Longshot | — | — |
| Situational Longshot | — | — |
| Speed | A | F |
| Early Pace | A | B |
| Mid Pace | A | C |
| Late Pace | A | D |
| Finish Pos | B | A |
| Dirt Speed | A | D |
| Turf Speed | C | D |
| Distance Speed | A | C |
| Trainer Effectiveness | A | A |
| Jockey Effectiveness | C | C |
| 3rd Party Ratings | A | C |
| Recent
Performance analysis from the horse's recent races, weighted to reflect current form. Sprint and Route FPS (Foot Per Second) measure pace efficiency over the horse's recent sprints and routes respectively. Grading scale: A = elite • B = above average • C = average • D = below average • F = poor • — = no data |
||
| Speed | A | F |
| Early Pace | A | B |
| Mid Pace | A | C |
| Late Pace | A | D |
| Sprint FPS | A | A |
| Route FPS | A | B |
| Trainer Effectiveness | A | A |
| Jockey Effectiveness | C | C |
| 3rd Party Ratings | A | C |
| Predictions
AI-generated projections for the upcoming race, derived from prior AI analysis for speed and pace trends, surface and distance suitability, and current conditions. Grading scale: A = elite • B = above average • C = average • D = below average • F = poor • — = no data |
||
| Speed | A | F |
| Early Pace | A | A |
| Mid Pace | A | B |
| Late Pace | C | C |
Chart Guide (2.0.36)
- Bubbles
- Color = surface: green (turf), brown (dirt), blue (synthetic)
- Top number = finishing position; bottom number in parentheses = starting post position
- Height above line = beaten lengths — closer means a smaller margin
- Border = track conditions: green (FST/GD/FM), yellow (WF/SL/YLD), red (SY/MY/FRZ/SFT/HVY)
- Connecting Line
- Solid = good conditions; dashed = bad conditions
- Line Symbol
- ▲ Triangle = sprint (7f or less); ● Circle = route (more than 7f)
- Days Between Races
- Small number above each bubble (e.g. 19d) = days since the previous race — helps spot freshness, layoffs, and tight scheduling.
- Shaded Band (Bollinger)
- Highlights volatility — a wider band means more variation in recent performance
- Performance Trend
- Straight line showing the overall performance direction — angled up = improving, angled down = declining
- Dashed Reference Line
- AI Opponent = AI analysis class-level par for the race
AI Model History Guide
- Lines
- Each solid line shows this horse’s model score over its last 10 races: blue = Mod1, green = Mod2, amber = Mod3.
- Dashed Lines
- Dashed lines represent the current race’s field average for each model — a score below the dashed line indicates the horse ranked below average in this model’s assessment.
- Higher is Stronger
- All three model scores are 0–100: a higher number means the model rates this horse more favorably among the field.
Mod1(W): 82 (1/8) Mod2(W): 75 (2/8) Mod3(W): 79 (3/8) Mod1-LS: 55 (6/8) Win Prob: 18.4% Value Score: 1.35 ★
Performance vs. Peers Guide
- Bars (per post)
- Blue = avg career performance • Amber = avg last 3 races • Green = last race (improved vs. avg) • Red = last race (declined vs. avg)
- Trend Line
- Angled line above the bars: rising = improving form • falling = declining form.
- Horizontal Line
- Field average — the mean career performance of all horses in this race.
- Color Circles
- Standard post-position colors below each lane — same as the Total Pace chart.
- Border
- Thicker border = this horse’s post position.
Figure Comparison
- Rating
- The three Pick Pony algorithm ratings (Algo 1, Algo 2, Algo 3) that make up the overall PP AI Rating — higher is a stronger contender rating.
- Speed
- Career average speed, recent 3-race average, and last-race speed figure — spot horses in improving or declining form.
- Pace
- Average Early (E1), Mid (E2), and Stretch (LP) pace figures — reveals pace-setters vs. closers vs. all-the-way types.
- This horse
- The horse whose stats card is open is highlighted with a darker column background.
Winning Profiles
- Axes
- X: Win % from last 10 starts — Y: In-the-money % (top-3 finishes) from last 10 starts.
- Quadrants
- Consistent Winners (top-right): high win & ITM — reliable performers.
Place Threats (top-left): boards often but doesn’t win often — good exacta/trifecta angles.
Streaky (bottom-right): wins occasionally, misses the board often — all-or-nothing.
Developing (bottom-left): still finding form — longshot territory. - Reference Lines
- Dashed lines mark field averages. Dots to the right win more; dots higher board more.
- This horse
- Highlighted with a gold border and larger dot.
AI Model Comparison
- Winner Models (green)
- Mod1(W), Mod2(W), and Mod3(W) trained to predict race winners. Higher score = stronger contender.
- Longshot Models (red)
- Mod1-LS, Mod2-LS, and Mod3-LS trained to find high-value longshots. Higher score = stronger longshot candidate.
- Form Model (blue)
- Mod4 sequence model trained on recent form patterns. Higher score = stronger recent form profile.
- This horse
- Highlighted with a darker column background.
Race Pace Simulation Guide
- Slider
- Drag left→right to advance from gate to finish. Drag all the way back to reset the race.
- Predicted Finish Order
- Factors in contested pace burn, each horse’s effort curve (peaked-early vs. peaked-late), and wide trip cost from outside posts. Updated live when Track Bias changes.
- Pace Scenario
- Lone Speed: single E horse likely rates and holds. Contested: two E horses burn each other — closers benefit. Hot Pace: speed meltdown, deep closers thrive. Soft: no early speed, moderate fractions throughout.
- Track Bias
- Slider below canvas. −2 = strong closer/wet bias; +2 = strong speed/rail bias. Recomputes the predicted finish order.
- Boxed Indicator
- Dashed orange ring = horse is surrounded (rival ahead, rival behind, wall outside). In a real race this horse must find a clear path to run.
- Running Styles
- E/EE = early speed (rushes to rail). P = presser (stalks the pace). S = stalker. SS = slow starter / closer.
| Stat | vs. Current Card | vs. All Horses |
|---|---|---|
| Averages
Career-average metrics across all AI race analysis. Performance and pace averages reflect estimated historical performance; trainer and jockey grades score in-the-money percentages. Grading scale: A = elite • B = above average • C = average • D = below average • F = poor • — = no data |
||
| Pick Pony AI Rating | B | D |
| Pace Trip Longshot | — | — |
| Connections Longshot | — | — |
| Situational Longshot | — | — |
| Speed | B | F |
| Early Pace | A | A |
| Mid Pace | C | F |
| Late Pace | B | F |
| Finish Pos | B | A |
| Dirt Speed | D | F |
| Turf Speed | C | D |
| Distance Speed | B | D |
| Trainer Effectiveness | A | C |
| Jockey Effectiveness | D | F |
| 3rd Party Ratings | B | D |
| Recent
Performance analysis from the horse's recent races, weighted to reflect current form. Sprint and Route FPS (Foot Per Second) measure pace efficiency over the horse's recent sprints and routes respectively. Grading scale: A = elite • B = above average • C = average • D = below average • F = poor • — = no data |
||
| Speed | B | F |
| Early Pace | A | B |
| Mid Pace | C | F |
| Late Pace | B | F |
| Sprint FPS | C | F |
| Route FPS | C | F |
| Trainer Effectiveness | A | C |
| Jockey Effectiveness | D | F |
| 3rd Party Ratings | B | D |
| Predictions
AI-generated projections for the upcoming race, derived from prior AI analysis for speed and pace trends, surface and distance suitability, and current conditions. Grading scale: A = elite • B = above average • C = average • D = below average • F = poor • — = no data |
||
| Speed | B | F |
| Early Pace | C | F |
| Mid Pace | C | F |
| Late Pace | C | C |
Chart Guide (2.0.36)
- Bubbles
- Color = surface: green (turf), brown (dirt), blue (synthetic)
- Top number = finishing position; bottom number in parentheses = starting post position
- Height above line = beaten lengths — closer means a smaller margin
- Border = track conditions: green (FST/GD/FM), yellow (WF/SL/YLD), red (SY/MY/FRZ/SFT/HVY)
- Connecting Line
- Solid = good conditions; dashed = bad conditions
- Line Symbol
- ▲ Triangle = sprint (7f or less); ● Circle = route (more than 7f)
- Days Between Races
- Small number above each bubble (e.g. 19d) = days since the previous race — helps spot freshness, layoffs, and tight scheduling.
- Shaded Band (Bollinger)
- Highlights volatility — a wider band means more variation in recent performance
- Performance Trend
- Straight line showing the overall performance direction — angled up = improving, angled down = declining
- Dashed Reference Line
- AI Opponent = AI analysis class-level par for the race
AI Model History Guide
- Lines
- Each solid line shows this horse’s model score over its last 10 races: blue = Mod1, green = Mod2, amber = Mod3.
- Dashed Lines
- Dashed lines represent the current race’s field average for each model — a score below the dashed line indicates the horse ranked below average in this model’s assessment.
- Higher is Stronger
- All three model scores are 0–100: a higher number means the model rates this horse more favorably among the field.
Mod1(W): 82 (1/8) Mod2(W): 75 (2/8) Mod3(W): 79 (3/8) Mod1-LS: 55 (6/8) Win Prob: 18.4% Value Score: 1.35 ★
Performance vs. Peers Guide
- Bars (per post)
- Blue = avg career performance • Amber = avg last 3 races • Green = last race (improved vs. avg) • Red = last race (declined vs. avg)
- Trend Line
- Angled line above the bars: rising = improving form • falling = declining form.
- Horizontal Line
- Field average — the mean career performance of all horses in this race.
- Color Circles
- Standard post-position colors below each lane — same as the Total Pace chart.
- Border
- Thicker border = this horse’s post position.
Figure Comparison
- Rating
- The three Pick Pony algorithm ratings (Algo 1, Algo 2, Algo 3) that make up the overall PP AI Rating — higher is a stronger contender rating.
- Speed
- Career average speed, recent 3-race average, and last-race speed figure — spot horses in improving or declining form.
- Pace
- Average Early (E1), Mid (E2), and Stretch (LP) pace figures — reveals pace-setters vs. closers vs. all-the-way types.
- This horse
- The horse whose stats card is open is highlighted with a darker column background.
Winning Profiles
- Axes
- X: Win % from last 10 starts — Y: In-the-money % (top-3 finishes) from last 10 starts.
- Quadrants
- Consistent Winners (top-right): high win & ITM — reliable performers.
Place Threats (top-left): boards often but doesn’t win often — good exacta/trifecta angles.
Streaky (bottom-right): wins occasionally, misses the board often — all-or-nothing.
Developing (bottom-left): still finding form — longshot territory. - Reference Lines
- Dashed lines mark field averages. Dots to the right win more; dots higher board more.
- This horse
- Highlighted with a gold border and larger dot.
AI Model Comparison
- Winner Models (green)
- Mod1(W), Mod2(W), and Mod3(W) trained to predict race winners. Higher score = stronger contender.
- Longshot Models (red)
- Mod1-LS, Mod2-LS, and Mod3-LS trained to find high-value longshots. Higher score = stronger longshot candidate.
- Form Model (blue)
- Mod4 sequence model trained on recent form patterns. Higher score = stronger recent form profile.
- This horse
- Highlighted with a darker column background.
Race Pace Simulation Guide
- Slider
- Drag left→right to advance from gate to finish. Drag all the way back to reset the race.
- Predicted Finish Order
- Factors in contested pace burn, each horse’s effort curve (peaked-early vs. peaked-late), and wide trip cost from outside posts. Updated live when Track Bias changes.
- Pace Scenario
- Lone Speed: single E horse likely rates and holds. Contested: two E horses burn each other — closers benefit. Hot Pace: speed meltdown, deep closers thrive. Soft: no early speed, moderate fractions throughout.
- Track Bias
- Slider below canvas. −2 = strong closer/wet bias; +2 = strong speed/rail bias. Recomputes the predicted finish order.
- Boxed Indicator
- Dashed orange ring = horse is surrounded (rival ahead, rival behind, wall outside). In a real race this horse must find a clear path to run.
- Running Styles
- E/EE = early speed (rushes to rail). P = presser (stalks the pace). S = stalker. SS = slow starter / closer.
| Stat | vs. Current Card | vs. All Horses |
|---|---|---|
| Averages
Career-average metrics across all AI race analysis. Performance and pace averages reflect estimated historical performance; trainer and jockey grades score in-the-money percentages. Grading scale: A = elite • B = above average • C = average • D = below average • F = poor • — = no data |
||
| Pick Pony AI Rating | B | D |
| Pace Trip Longshot | — | — |
| Connections Longshot | — | — |
| Situational Longshot | — | — |
| Speed | B | F |
| Early Pace | A | B |
| Mid Pace | C | F |
| Late Pace | B | F |
| Finish Pos | B | A |
| Dirt Speed | B | D |
| Turf Speed | C | D |
| Distance Speed | A | D |
| Trainer Effectiveness | A | C |
| Jockey Effectiveness | D | F |
| 3rd Party Ratings | A | D |
| Recent
Performance analysis from the horse's recent races, weighted to reflect current form. Sprint and Route FPS (Foot Per Second) measure pace efficiency over the horse's recent sprints and routes respectively. Grading scale: A = elite • B = above average • C = average • D = below average • F = poor • — = no data |
||
| Speed | B | F |
| Early Pace | A | B |
| Mid Pace | C | F |
| Late Pace | B | F |
| Sprint FPS | C | F |
| Route FPS | C | F |
| Trainer Effectiveness | A | C |
| Jockey Effectiveness | D | F |
| 3rd Party Ratings | A | D |
| Predictions
AI-generated projections for the upcoming race, derived from prior AI analysis for speed and pace trends, surface and distance suitability, and current conditions. Grading scale: A = elite • B = above average • C = average • D = below average • F = poor • — = no data |
||
| Speed | B | F |
| Early Pace | C | F |
| Mid Pace | C | F |
| Late Pace | C | C |
Chart Guide (2.0.36)
- Bubbles
- Color = surface: green (turf), brown (dirt), blue (synthetic)
- Top number = finishing position; bottom number in parentheses = starting post position
- Height above line = beaten lengths — closer means a smaller margin
- Border = track conditions: green (FST/GD/FM), yellow (WF/SL/YLD), red (SY/MY/FRZ/SFT/HVY)
- Connecting Line
- Solid = good conditions; dashed = bad conditions
- Line Symbol
- ▲ Triangle = sprint (7f or less); ● Circle = route (more than 7f)
- Days Between Races
- Small number above each bubble (e.g. 19d) = days since the previous race — helps spot freshness, layoffs, and tight scheduling.
- Shaded Band (Bollinger)
- Highlights volatility — a wider band means more variation in recent performance
- Performance Trend
- Straight line showing the overall performance direction — angled up = improving, angled down = declining
- Dashed Reference Line
- AI Opponent = AI analysis class-level par for the race
AI Model History Guide
- Lines
- Each solid line shows this horse’s model score over its last 10 races: blue = Mod1, green = Mod2, amber = Mod3.
- Dashed Lines
- Dashed lines represent the current race’s field average for each model — a score below the dashed line indicates the horse ranked below average in this model’s assessment.
- Higher is Stronger
- All three model scores are 0–100: a higher number means the model rates this horse more favorably among the field.
Mod1(W): 82 (1/8) Mod2(W): 75 (2/8) Mod3(W): 79 (3/8) Mod1-LS: 55 (6/8) Win Prob: 18.4% Value Score: 1.35 ★
Performance vs. Peers Guide
- Bars (per post)
- Blue = avg career performance • Amber = avg last 3 races • Green = last race (improved vs. avg) • Red = last race (declined vs. avg)
- Trend Line
- Angled line above the bars: rising = improving form • falling = declining form.
- Horizontal Line
- Field average — the mean career performance of all horses in this race.
- Color Circles
- Standard post-position colors below each lane — same as the Total Pace chart.
- Border
- Thicker border = this horse’s post position.
Figure Comparison
- Rating
- The three Pick Pony algorithm ratings (Algo 1, Algo 2, Algo 3) that make up the overall PP AI Rating — higher is a stronger contender rating.
- Speed
- Career average speed, recent 3-race average, and last-race speed figure — spot horses in improving or declining form.
- Pace
- Average Early (E1), Mid (E2), and Stretch (LP) pace figures — reveals pace-setters vs. closers vs. all-the-way types.
- This horse
- The horse whose stats card is open is highlighted with a darker column background.
Winning Profiles
- Axes
- X: Win % from last 10 starts — Y: In-the-money % (top-3 finishes) from last 10 starts.
- Quadrants
- Consistent Winners (top-right): high win & ITM — reliable performers.
Place Threats (top-left): boards often but doesn’t win often — good exacta/trifecta angles.
Streaky (bottom-right): wins occasionally, misses the board often — all-or-nothing.
Developing (bottom-left): still finding form — longshot territory. - Reference Lines
- Dashed lines mark field averages. Dots to the right win more; dots higher board more.
- This horse
- Highlighted with a gold border and larger dot.
AI Model Comparison
- Winner Models (green)
- Mod1(W), Mod2(W), and Mod3(W) trained to predict race winners. Higher score = stronger contender.
- Longshot Models (red)
- Mod1-LS, Mod2-LS, and Mod3-LS trained to find high-value longshots. Higher score = stronger longshot candidate.
- Form Model (blue)
- Mod4 sequence model trained on recent form patterns. Higher score = stronger recent form profile.
- This horse
- Highlighted with a darker column background.
Race Pace Simulation Guide
- Slider
- Drag left→right to advance from gate to finish. Drag all the way back to reset the race.
- Predicted Finish Order
- Factors in contested pace burn, each horse’s effort curve (peaked-early vs. peaked-late), and wide trip cost from outside posts. Updated live when Track Bias changes.
- Pace Scenario
- Lone Speed: single E horse likely rates and holds. Contested: two E horses burn each other — closers benefit. Hot Pace: speed meltdown, deep closers thrive. Soft: no early speed, moderate fractions throughout.
- Track Bias
- Slider below canvas. −2 = strong closer/wet bias; +2 = strong speed/rail bias. Recomputes the predicted finish order.
- Boxed Indicator
- Dashed orange ring = horse is surrounded (rival ahead, rival behind, wall outside). In a real race this horse must find a clear path to run.
- Running Styles
- E/EE = early speed (rushes to rail). P = presser (stalks the pace). S = stalker. SS = slow starter / closer.
| Stat | vs. Current Card | vs. All Horses |
|---|---|---|
| Averages
Career-average metrics across all AI race analysis. Performance and pace averages reflect estimated historical performance; trainer and jockey grades score in-the-money percentages. Grading scale: A = elite • B = above average • C = average • D = below average • F = poor • — = no data |
||
| Pick Pony AI Rating | F | F |
| Pace Trip Longshot | — | — |
| Connections Longshot | — | — |
| Situational Longshot | — | — |
| Speed | F | F |
| Early Pace | B | A |
| Mid Pace | F | F |
| Late Pace | F | D |
| Finish Pos | C | D |
| Dirt Speed | D | D |
| Turf Speed | C | D |
| Distance Speed | D | C |
| Trainer Effectiveness | C | B |
| Jockey Effectiveness | F | D |
| 3rd Party Ratings | F | D |
| Recent
Performance analysis from the horse's recent races, weighted to reflect current form. Sprint and Route FPS (Foot Per Second) measure pace efficiency over the horse's recent sprints and routes respectively. Grading scale: A = elite • B = above average • C = average • D = below average • F = poor • — = no data |
||
| Speed | D | F |
| Early Pace | C | B |
| Mid Pace | F | F |
| Late Pace | D | D |
| Sprint FPS | F | F |
| Route FPS | F | F |
| Trainer Effectiveness | C | B |
| Jockey Effectiveness | F | D |
| 3rd Party Ratings | F | D |
| Predictions
AI-generated projections for the upcoming race, derived from prior AI analysis for speed and pace trends, surface and distance suitability, and current conditions. Grading scale: A = elite • B = above average • C = average • D = below average • F = poor • — = no data |
||
| Speed | F | F |
| Early Pace | C | A |
| Mid Pace | D | F |
| Late Pace | C | C |
Chart Guide (2.0.36)
- Bubbles
- Color = surface: green (turf), brown (dirt), blue (synthetic)
- Top number = finishing position; bottom number in parentheses = starting post position
- Height above line = beaten lengths — closer means a smaller margin
- Border = track conditions: green (FST/GD/FM), yellow (WF/SL/YLD), red (SY/MY/FRZ/SFT/HVY)
- Connecting Line
- Solid = good conditions; dashed = bad conditions
- Line Symbol
- ▲ Triangle = sprint (7f or less); ● Circle = route (more than 7f)
- Days Between Races
- Small number above each bubble (e.g. 19d) = days since the previous race — helps spot freshness, layoffs, and tight scheduling.
- Shaded Band (Bollinger)
- Highlights volatility — a wider band means more variation in recent performance
- Performance Trend
- Straight line showing the overall performance direction — angled up = improving, angled down = declining
- Dashed Reference Line
- AI Opponent = AI analysis class-level par for the race
AI Model History Guide
- Lines
- Each solid line shows this horse’s model score over its last 10 races: blue = Mod1, green = Mod2, amber = Mod3.
- Dashed Lines
- Dashed lines represent the current race’s field average for each model — a score below the dashed line indicates the horse ranked below average in this model’s assessment.
- Higher is Stronger
- All three model scores are 0–100: a higher number means the model rates this horse more favorably among the field.
Mod1(W): 82 (1/8) Mod2(W): 75 (2/8) Mod3(W): 79 (3/8) Mod1-LS: 55 (6/8) Win Prob: 18.4% Value Score: 1.35 ★
Performance vs. Peers Guide
- Bars (per post)
- Blue = avg career performance • Amber = avg last 3 races • Green = last race (improved vs. avg) • Red = last race (declined vs. avg)
- Trend Line
- Angled line above the bars: rising = improving form • falling = declining form.
- Horizontal Line
- Field average — the mean career performance of all horses in this race.
- Color Circles
- Standard post-position colors below each lane — same as the Total Pace chart.
- Border
- Thicker border = this horse’s post position.
Figure Comparison
- Rating
- The three Pick Pony algorithm ratings (Algo 1, Algo 2, Algo 3) that make up the overall PP AI Rating — higher is a stronger contender rating.
- Speed
- Career average speed, recent 3-race average, and last-race speed figure — spot horses in improving or declining form.
- Pace
- Average Early (E1), Mid (E2), and Stretch (LP) pace figures — reveals pace-setters vs. closers vs. all-the-way types.
- This horse
- The horse whose stats card is open is highlighted with a darker column background.
Winning Profiles
- Axes
- X: Win % from last 10 starts — Y: In-the-money % (top-3 finishes) from last 10 starts.
- Quadrants
- Consistent Winners (top-right): high win & ITM — reliable performers.
Place Threats (top-left): boards often but doesn’t win often — good exacta/trifecta angles.
Streaky (bottom-right): wins occasionally, misses the board often — all-or-nothing.
Developing (bottom-left): still finding form — longshot territory. - Reference Lines
- Dashed lines mark field averages. Dots to the right win more; dots higher board more.
- This horse
- Highlighted with a gold border and larger dot.
AI Model Comparison
- Winner Models (green)
- Mod1(W), Mod2(W), and Mod3(W) trained to predict race winners. Higher score = stronger contender.
- Longshot Models (red)
- Mod1-LS, Mod2-LS, and Mod3-LS trained to find high-value longshots. Higher score = stronger longshot candidate.
- Form Model (blue)
- Mod4 sequence model trained on recent form patterns. Higher score = stronger recent form profile.
- This horse
- Highlighted with a darker column background.
Race Pace Simulation Guide
- Slider
- Drag left→right to advance from gate to finish. Drag all the way back to reset the race.
- Predicted Finish Order
- Factors in contested pace burn, each horse’s effort curve (peaked-early vs. peaked-late), and wide trip cost from outside posts. Updated live when Track Bias changes.
- Pace Scenario
- Lone Speed: single E horse likely rates and holds. Contested: two E horses burn each other — closers benefit. Hot Pace: speed meltdown, deep closers thrive. Soft: no early speed, moderate fractions throughout.
- Track Bias
- Slider below canvas. −2 = strong closer/wet bias; +2 = strong speed/rail bias. Recomputes the predicted finish order.
- Boxed Indicator
- Dashed orange ring = horse is surrounded (rival ahead, rival behind, wall outside). In a real race this horse must find a clear path to run.
- Running Styles
- E/EE = early speed (rushes to rail). P = presser (stalks the pace). S = stalker. SS = slow starter / closer.
| Stat | vs. Current Card | vs. All Horses |
|---|---|---|
| Averages
Career-average metrics across all AI race analysis. Performance and pace averages reflect estimated historical performance; trainer and jockey grades score in-the-money percentages. Grading scale: A = elite • B = above average • C = average • D = below average • F = poor • — = no data |
||
| Pick Pony AI Rating | C | C |
| Pace Trip Longshot | — | — |
| Connections Longshot | — | — |
| Situational Longshot | — | — |
| Speed | D | F |
| Early Pace | A | A |
| Mid Pace | B | B |
| Late Pace | D | D |
| Finish Pos | B | B |
| Dirt Speed | C | C |
| Turf Speed | C | D |
| Distance Speed | C | C |
| Trainer Effectiveness | D | C |
| Jockey Effectiveness | C | C |
| 3rd Party Ratings | D | D |
| Recent
Performance analysis from the horse's recent races, weighted to reflect current form. Sprint and Route FPS (Foot Per Second) measure pace efficiency over the horse's recent sprints and routes respectively. Grading scale: A = elite • B = above average • C = average • D = below average • F = poor • — = no data |
||
| Speed | F | F |
| Early Pace | B | B |
| Mid Pace | C | B |
| Late Pace | D | D |
| Sprint FPS | A | A |
| Route FPS | A | A |
| Trainer Effectiveness | D | C |
| Jockey Effectiveness | C | C |
| 3rd Party Ratings | D | D |
| Predictions
AI-generated projections for the upcoming race, derived from prior AI analysis for speed and pace trends, surface and distance suitability, and current conditions. Grading scale: A = elite • B = above average • C = average • D = below average • F = poor • — = no data |
||
| Speed | C | D |
| Early Pace | B | A |
| Mid Pace | A | B |
| Late Pace | C | C |
Chart Guide (2.0.36)
- Bubbles
- Color = surface: green (turf), brown (dirt), blue (synthetic)
- Top number = finishing position; bottom number in parentheses = starting post position
- Height above line = beaten lengths — closer means a smaller margin
- Border = track conditions: green (FST/GD/FM), yellow (WF/SL/YLD), red (SY/MY/FRZ/SFT/HVY)
- Connecting Line
- Solid = good conditions; dashed = bad conditions
- Line Symbol
- ▲ Triangle = sprint (7f or less); ● Circle = route (more than 7f)
- Days Between Races
- Small number above each bubble (e.g. 19d) = days since the previous race — helps spot freshness, layoffs, and tight scheduling.
- Shaded Band (Bollinger)
- Highlights volatility — a wider band means more variation in recent performance
- Performance Trend
- Straight line showing the overall performance direction — angled up = improving, angled down = declining
- Dashed Reference Line
- AI Opponent = AI analysis class-level par for the race
AI Model History Guide
- Lines
- Each solid line shows this horse’s model score over its last 10 races: blue = Mod1, green = Mod2, amber = Mod3.
- Dashed Lines
- Dashed lines represent the current race’s field average for each model — a score below the dashed line indicates the horse ranked below average in this model’s assessment.
- Higher is Stronger
- All three model scores are 0–100: a higher number means the model rates this horse more favorably among the field.
Mod1(W): 82 (1/8) Mod2(W): 75 (2/8) Mod3(W): 79 (3/8) Mod1-LS: 55 (6/8) Win Prob: 18.4% Value Score: 1.35 ★
Performance vs. Peers Guide
- Bars (per post)
- Blue = avg career performance • Amber = avg last 3 races • Green = last race (improved vs. avg) • Red = last race (declined vs. avg)
- Trend Line
- Angled line above the bars: rising = improving form • falling = declining form.
- Horizontal Line
- Field average — the mean career performance of all horses in this race.
- Color Circles
- Standard post-position colors below each lane — same as the Total Pace chart.
- Border
- Thicker border = this horse’s post position.
Figure Comparison
- Rating
- The three Pick Pony algorithm ratings (Algo 1, Algo 2, Algo 3) that make up the overall PP AI Rating — higher is a stronger contender rating.
- Speed
- Career average speed, recent 3-race average, and last-race speed figure — spot horses in improving or declining form.
- Pace
- Average Early (E1), Mid (E2), and Stretch (LP) pace figures — reveals pace-setters vs. closers vs. all-the-way types.
- This horse
- The horse whose stats card is open is highlighted with a darker column background.
Winning Profiles
- Axes
- X: Win % from last 10 starts — Y: In-the-money % (top-3 finishes) from last 10 starts.
- Quadrants
- Consistent Winners (top-right): high win & ITM — reliable performers.
Place Threats (top-left): boards often but doesn’t win often — good exacta/trifecta angles.
Streaky (bottom-right): wins occasionally, misses the board often — all-or-nothing.
Developing (bottom-left): still finding form — longshot territory. - Reference Lines
- Dashed lines mark field averages. Dots to the right win more; dots higher board more.
- This horse
- Highlighted with a gold border and larger dot.
AI Model Comparison
- Winner Models (green)
- Mod1(W), Mod2(W), and Mod3(W) trained to predict race winners. Higher score = stronger contender.
- Longshot Models (red)
- Mod1-LS, Mod2-LS, and Mod3-LS trained to find high-value longshots. Higher score = stronger longshot candidate.
- Form Model (blue)
- Mod4 sequence model trained on recent form patterns. Higher score = stronger recent form profile.
- This horse
- Highlighted with a darker column background.
Race Pace Simulation Guide
- Slider
- Drag left→right to advance from gate to finish. Drag all the way back to reset the race.
- Predicted Finish Order
- Factors in contested pace burn, each horse’s effort curve (peaked-early vs. peaked-late), and wide trip cost from outside posts. Updated live when Track Bias changes.
- Pace Scenario
- Lone Speed: single E horse likely rates and holds. Contested: two E horses burn each other — closers benefit. Hot Pace: speed meltdown, deep closers thrive. Soft: no early speed, moderate fractions throughout.
- Track Bias
- Slider below canvas. −2 = strong closer/wet bias; +2 = strong speed/rail bias. Recomputes the predicted finish order.
- Boxed Indicator
- Dashed orange ring = horse is surrounded (rival ahead, rival behind, wall outside). In a real race this horse must find a clear path to run.
- Running Styles
- E/EE = early speed (rushes to rail). P = presser (stalks the pace). S = stalker. SS = slow starter / closer.
| Stat | vs. Current Card | vs. All Horses |
|---|---|---|
| Averages
Career-average metrics across all AI race analysis. Performance and pace averages reflect estimated historical performance; trainer and jockey grades score in-the-money percentages. Grading scale: A = elite • B = above average • C = average • D = below average • F = poor • — = no data |
||
| Pick Pony AI Rating | C | C |
| Pace Trip Longshot | — | — |
| Connections Longshot | — | — |
| Situational Longshot | — | — |
| Speed | A | D |
| Early Pace | C | B |
| Mid Pace | C | C |
| Late Pace | A | C |
| Finish Pos | A | B |
| Dirt Speed | A | C |
| Turf Speed | C | D |
| Distance Speed | A | C |
| Trainer Effectiveness | B | A |
| Jockey Effectiveness | B | A |
| 3rd Party Ratings | C | B |
| Recent
Performance analysis from the horse's recent races, weighted to reflect current form. Sprint and Route FPS (Foot Per Second) measure pace efficiency over the horse's recent sprints and routes respectively. Grading scale: A = elite • B = above average • C = average • D = below average • F = poor • — = no data |
||
| Speed | B | D |
| Early Pace | D | B |
| Mid Pace | C | C |
| Late Pace | A | C |
| Sprint FPS | C | B |
| Route FPS | C | C |
| Trainer Effectiveness | B | A |
| Jockey Effectiveness | B | A |
| 3rd Party Ratings | C | B |
| Predictions
AI-generated projections for the upcoming race, derived from prior AI analysis for speed and pace trends, surface and distance suitability, and current conditions. Grading scale: A = elite • B = above average • C = average • D = below average • F = poor • — = no data |
||
| Speed | B | D |
| Early Pace | A | A |
| Mid Pace | D | F |
| Late Pace | C | C |
Chart Guide (2.0.36)
- Bubbles
- Color = surface: green (turf), brown (dirt), blue (synthetic)
- Top number = finishing position; bottom number in parentheses = starting post position
- Height above line = beaten lengths — closer means a smaller margin
- Border = track conditions: green (FST/GD/FM), yellow (WF/SL/YLD), red (SY/MY/FRZ/SFT/HVY)
- Connecting Line
- Solid = good conditions; dashed = bad conditions
- Line Symbol
- ▲ Triangle = sprint (7f or less); ● Circle = route (more than 7f)
- Days Between Races
- Small number above each bubble (e.g. 19d) = days since the previous race — helps spot freshness, layoffs, and tight scheduling.
- Shaded Band (Bollinger)
- Highlights volatility — a wider band means more variation in recent performance
- Performance Trend
- Straight line showing the overall performance direction — angled up = improving, angled down = declining
- Dashed Reference Line
- AI Opponent = AI analysis class-level par for the race
AI Model History Guide
- Lines
- Each solid line shows this horse’s model score over its last 10 races: blue = Mod1, green = Mod2, amber = Mod3.
- Dashed Lines
- Dashed lines represent the current race’s field average for each model — a score below the dashed line indicates the horse ranked below average in this model’s assessment.
- Higher is Stronger
- All three model scores are 0–100: a higher number means the model rates this horse more favorably among the field.
Mod1(W): 82 (1/8) Mod2(W): 75 (2/8) Mod3(W): 79 (3/8) Mod1-LS: 55 (6/8) Win Prob: 18.4% Value Score: 1.35 ★
Performance vs. Peers Guide
- Bars (per post)
- Blue = avg career performance • Amber = avg last 3 races • Green = last race (improved vs. avg) • Red = last race (declined vs. avg)
- Trend Line
- Angled line above the bars: rising = improving form • falling = declining form.
- Horizontal Line
- Field average — the mean career performance of all horses in this race.
- Color Circles
- Standard post-position colors below each lane — same as the Total Pace chart.
- Border
- Thicker border = this horse’s post position.
Figure Comparison
- Rating
- The three Pick Pony algorithm ratings (Algo 1, Algo 2, Algo 3) that make up the overall PP AI Rating — higher is a stronger contender rating.
- Speed
- Career average speed, recent 3-race average, and last-race speed figure — spot horses in improving or declining form.
- Pace
- Average Early (E1), Mid (E2), and Stretch (LP) pace figures — reveals pace-setters vs. closers vs. all-the-way types.
- This horse
- The horse whose stats card is open is highlighted with a darker column background.
Winning Profiles
- Axes
- X: Win % from last 10 starts — Y: In-the-money % (top-3 finishes) from last 10 starts.
- Quadrants
- Consistent Winners (top-right): high win & ITM — reliable performers.
Place Threats (top-left): boards often but doesn’t win often — good exacta/trifecta angles.
Streaky (bottom-right): wins occasionally, misses the board often — all-or-nothing.
Developing (bottom-left): still finding form — longshot territory. - Reference Lines
- Dashed lines mark field averages. Dots to the right win more; dots higher board more.
- This horse
- Highlighted with a gold border and larger dot.
AI Model Comparison
- Winner Models (green)
- Mod1(W), Mod2(W), and Mod3(W) trained to predict race winners. Higher score = stronger contender.
- Longshot Models (red)
- Mod1-LS, Mod2-LS, and Mod3-LS trained to find high-value longshots. Higher score = stronger longshot candidate.
- Form Model (blue)
- Mod4 sequence model trained on recent form patterns. Higher score = stronger recent form profile.
- This horse
- Highlighted with a darker column background.
Race Pace Simulation Guide
- Slider
- Drag left→right to advance from gate to finish. Drag all the way back to reset the race.
- Predicted Finish Order
- Factors in contested pace burn, each horse’s effort curve (peaked-early vs. peaked-late), and wide trip cost from outside posts. Updated live when Track Bias changes.
- Pace Scenario
- Lone Speed: single E horse likely rates and holds. Contested: two E horses burn each other — closers benefit. Hot Pace: speed meltdown, deep closers thrive. Soft: no early speed, moderate fractions throughout.
- Track Bias
- Slider below canvas. −2 = strong closer/wet bias; +2 = strong speed/rail bias. Recomputes the predicted finish order.
- Boxed Indicator
- Dashed orange ring = horse is surrounded (rival ahead, rival behind, wall outside). In a real race this horse must find a clear path to run.
- Running Styles
- E/EE = early speed (rushes to rail). P = presser (stalks the pace). S = stalker. SS = slow starter / closer.
| Stat | vs. Current Card | vs. All Horses |
|---|---|---|
| Averages
Career-average metrics across all AI race analysis. Performance and pace averages reflect estimated historical performance; trainer and jockey grades score in-the-money percentages. Grading scale: A = elite • B = above average • C = average • D = below average • F = poor • — = no data |
||
| Pick Pony AI Rating | A | B |
| Pace Trip Longshot | — | — |
| Connections Longshot | — | — |
| Situational Longshot | — | — |
| Speed | B | D |
| Early Pace | D | B |
| Mid Pace | A | B |
| Late Pace | B | D |
| Finish Pos | A | A |
| Dirt Speed | F | D |
| Turf Speed | A | C |
| Distance Speed | B | C |
| Trainer Effectiveness | A | A |
| Jockey Effectiveness | A | A |
| 3rd Party Ratings | A | B |
| Recent
Performance analysis from the horse's recent races, weighted to reflect current form. Sprint and Route FPS (Foot Per Second) measure pace efficiency over the horse's recent sprints and routes respectively. Grading scale: A = elite • B = above average • C = average • D = below average • F = poor • — = no data |
||
| Speed | A | D |
| Early Pace | B | B |
| Mid Pace | A | B |
| Late Pace | A | C |
| Sprint FPS | B | B |
| Route FPS | B | B |
| Trainer Effectiveness | A | A |
| Jockey Effectiveness | A | A |
| 3rd Party Ratings | A | B |
| Predictions
AI-generated projections for the upcoming race, derived from prior AI analysis for speed and pace trends, surface and distance suitability, and current conditions. Grading scale: A = elite • B = above average • C = average • D = below average • F = poor • — = no data |
||
| Speed | C | D |
| Early Pace | D | B |
| Mid Pace | A | B |
| Late Pace | C | C |
Chart Guide (2.0.36)
- Bubbles
- Color = surface: green (turf), brown (dirt), blue (synthetic)
- Top number = finishing position; bottom number in parentheses = starting post position
- Height above line = beaten lengths — closer means a smaller margin
- Border = track conditions: green (FST/GD/FM), yellow (WF/SL/YLD), red (SY/MY/FRZ/SFT/HVY)
- Connecting Line
- Solid = good conditions; dashed = bad conditions
- Line Symbol
- ▲ Triangle = sprint (7f or less); ● Circle = route (more than 7f)
- Days Between Races
- Small number above each bubble (e.g. 19d) = days since the previous race — helps spot freshness, layoffs, and tight scheduling.
- Shaded Band (Bollinger)
- Highlights volatility — a wider band means more variation in recent performance
- Performance Trend
- Straight line showing the overall performance direction — angled up = improving, angled down = declining
- Dashed Reference Line
- AI Opponent = AI analysis class-level par for the race
AI Model History Guide
- Lines
- Each solid line shows this horse’s model score over its last 10 races: blue = Mod1, green = Mod2, amber = Mod3.
- Dashed Lines
- Dashed lines represent the current race’s field average for each model — a score below the dashed line indicates the horse ranked below average in this model’s assessment.
- Higher is Stronger
- All three model scores are 0–100: a higher number means the model rates this horse more favorably among the field.
Mod1(W): 82 (1/8) Mod2(W): 75 (2/8) Mod3(W): 79 (3/8) Mod1-LS: 55 (6/8) Win Prob: 18.4% Value Score: 1.35 ★
Performance vs. Peers Guide
- Bars (per post)
- Blue = avg career performance • Amber = avg last 3 races • Green = last race (improved vs. avg) • Red = last race (declined vs. avg)
- Trend Line
- Angled line above the bars: rising = improving form • falling = declining form.
- Horizontal Line
- Field average — the mean career performance of all horses in this race.
- Color Circles
- Standard post-position colors below each lane — same as the Total Pace chart.
- Border
- Thicker border = this horse’s post position.
Figure Comparison
- Rating
- The three Pick Pony algorithm ratings (Algo 1, Algo 2, Algo 3) that make up the overall PP AI Rating — higher is a stronger contender rating.
- Speed
- Career average speed, recent 3-race average, and last-race speed figure — spot horses in improving or declining form.
- Pace
- Average Early (E1), Mid (E2), and Stretch (LP) pace figures — reveals pace-setters vs. closers vs. all-the-way types.
- This horse
- The horse whose stats card is open is highlighted with a darker column background.
Winning Profiles
- Axes
- X: Win % from last 10 starts — Y: In-the-money % (top-3 finishes) from last 10 starts.
- Quadrants
- Consistent Winners (top-right): high win & ITM — reliable performers.
Place Threats (top-left): boards often but doesn’t win often — good exacta/trifecta angles.
Streaky (bottom-right): wins occasionally, misses the board often — all-or-nothing.
Developing (bottom-left): still finding form — longshot territory. - Reference Lines
- Dashed lines mark field averages. Dots to the right win more; dots higher board more.
- This horse
- Highlighted with a gold border and larger dot.
AI Model Comparison
- Winner Models (green)
- Mod1(W), Mod2(W), and Mod3(W) trained to predict race winners. Higher score = stronger contender.
- Longshot Models (red)
- Mod1-LS, Mod2-LS, and Mod3-LS trained to find high-value longshots. Higher score = stronger longshot candidate.
- Form Model (blue)
- Mod4 sequence model trained on recent form patterns. Higher score = stronger recent form profile.
- This horse
- Highlighted with a darker column background.
Race Pace Simulation Guide
- Slider
- Drag left→right to advance from gate to finish. Drag all the way back to reset the race.
- Predicted Finish Order
- Factors in contested pace burn, each horse’s effort curve (peaked-early vs. peaked-late), and wide trip cost from outside posts. Updated live when Track Bias changes.
- Pace Scenario
- Lone Speed: single E horse likely rates and holds. Contested: two E horses burn each other — closers benefit. Hot Pace: speed meltdown, deep closers thrive. Soft: no early speed, moderate fractions throughout.
- Track Bias
- Slider below canvas. −2 = strong closer/wet bias; +2 = strong speed/rail bias. Recomputes the predicted finish order.
- Boxed Indicator
- Dashed orange ring = horse is surrounded (rival ahead, rival behind, wall outside). In a real race this horse must find a clear path to run.
- Running Styles
- E/EE = early speed (rushes to rail). P = presser (stalks the pace). S = stalker. SS = slow starter / closer.
| Stat | vs. Current Card | vs. All Horses |
|---|---|---|
| Averages
Career-average metrics across all AI race analysis. Performance and pace averages reflect estimated historical performance; trainer and jockey grades score in-the-money percentages. Grading scale: A = elite • B = above average • C = average • D = below average • F = poor • — = no data |
||
| Pick Pony AI Rating | A | B |
| Pace Trip Longshot | — | — |
| Connections Longshot | — | — |
| Situational Longshot | — | — |
| Speed | A | C |
| Early Pace | A | A |
| Mid Pace | A | A |
| Late Pace | A | D |
| Finish Pos | D | D |
| Dirt Speed | B | C |
| Turf Speed | C | D |
| Distance Speed | A | C |
| Trainer Effectiveness | C | C |
| Jockey Effectiveness | A | A |
| 3rd Party Ratings | A | B |
| Recent
Performance analysis from the horse's recent races, weighted to reflect current form. Sprint and Route FPS (Foot Per Second) measure pace efficiency over the horse's recent sprints and routes respectively. Grading scale: A = elite • B = above average • C = average • D = below average • F = poor • — = no data |
||
| Speed | A | C |
| Early Pace | A | A |
| Mid Pace | A | B |
| Late Pace | B | C |
| Sprint FPS | C | C |
| Route FPS | C | C |
| Trainer Effectiveness | C | C |
| Jockey Effectiveness | A | A |
| 3rd Party Ratings | A | B |
| Predictions
AI-generated projections for the upcoming race, derived from prior AI analysis for speed and pace trends, surface and distance suitability, and current conditions. Grading scale: A = elite • B = above average • C = average • D = below average • F = poor • — = no data |
||
| Speed | A | D |
| Early Pace | A | A |
| Mid Pace | D | F |
| Late Pace | C | C |
Chart Guide (2.0.36)
- Bubbles
- Color = surface: green (turf), brown (dirt), blue (synthetic)
- Top number = finishing position; bottom number in parentheses = starting post position
- Height above line = beaten lengths — closer means a smaller margin
- Border = track conditions: green (FST/GD/FM), yellow (WF/SL/YLD), red (SY/MY/FRZ/SFT/HVY)
- Connecting Line
- Solid = good conditions; dashed = bad conditions
- Line Symbol
- ▲ Triangle = sprint (7f or less); ● Circle = route (more than 7f)
- Days Between Races
- Small number above each bubble (e.g. 19d) = days since the previous race — helps spot freshness, layoffs, and tight scheduling.
- Shaded Band (Bollinger)
- Highlights volatility — a wider band means more variation in recent performance
- Performance Trend
- Straight line showing the overall performance direction — angled up = improving, angled down = declining
- Dashed Reference Line
- AI Opponent = AI analysis class-level par for the race
AI Model History Guide
- Lines
- Each solid line shows this horse’s model score over its last 10 races: blue = Mod1, green = Mod2, amber = Mod3.
- Dashed Lines
- Dashed lines represent the current race’s field average for each model — a score below the dashed line indicates the horse ranked below average in this model’s assessment.
- Higher is Stronger
- All three model scores are 0–100: a higher number means the model rates this horse more favorably among the field.
Mod1(W): 82 (1/8) Mod2(W): 75 (2/8) Mod3(W): 79 (3/8) Mod1-LS: 55 (6/8) Win Prob: 18.4% Value Score: 1.35 ★
Performance vs. Peers Guide
- Bars (per post)
- Blue = avg career performance • Amber = avg last 3 races • Green = last race (improved vs. avg) • Red = last race (declined vs. avg)
- Trend Line
- Angled line above the bars: rising = improving form • falling = declining form.
- Horizontal Line
- Field average — the mean career performance of all horses in this race.
- Color Circles
- Standard post-position colors below each lane — same as the Total Pace chart.
- Border
- Thicker border = this horse’s post position.
Figure Comparison
- Rating
- The three Pick Pony algorithm ratings (Algo 1, Algo 2, Algo 3) that make up the overall PP AI Rating — higher is a stronger contender rating.
- Speed
- Career average speed, recent 3-race average, and last-race speed figure — spot horses in improving or declining form.
- Pace
- Average Early (E1), Mid (E2), and Stretch (LP) pace figures — reveals pace-setters vs. closers vs. all-the-way types.
- This horse
- The horse whose stats card is open is highlighted with a darker column background.
Winning Profiles
- Axes
- X: Win % from last 10 starts — Y: In-the-money % (top-3 finishes) from last 10 starts.
- Quadrants
- Consistent Winners (top-right): high win & ITM — reliable performers.
Place Threats (top-left): boards often but doesn’t win often — good exacta/trifecta angles.
Streaky (bottom-right): wins occasionally, misses the board often — all-or-nothing.
Developing (bottom-left): still finding form — longshot territory. - Reference Lines
- Dashed lines mark field averages. Dots to the right win more; dots higher board more.
- This horse
- Highlighted with a gold border and larger dot.
AI Model Comparison
- Winner Models (green)
- Mod1(W), Mod2(W), and Mod3(W) trained to predict race winners. Higher score = stronger contender.
- Longshot Models (red)
- Mod1-LS, Mod2-LS, and Mod3-LS trained to find high-value longshots. Higher score = stronger longshot candidate.
- Form Model (blue)
- Mod4 sequence model trained on recent form patterns. Higher score = stronger recent form profile.
- This horse
- Highlighted with a darker column background.
Race Pace Simulation Guide
- Slider
- Drag left→right to advance from gate to finish. Drag all the way back to reset the race.
- Predicted Finish Order
- Factors in contested pace burn, each horse’s effort curve (peaked-early vs. peaked-late), and wide trip cost from outside posts. Updated live when Track Bias changes.
- Pace Scenario
- Lone Speed: single E horse likely rates and holds. Contested: two E horses burn each other — closers benefit. Hot Pace: speed meltdown, deep closers thrive. Soft: no early speed, moderate fractions throughout.
- Track Bias
- Slider below canvas. −2 = strong closer/wet bias; +2 = strong speed/rail bias. Recomputes the predicted finish order.
- Boxed Indicator
- Dashed orange ring = horse is surrounded (rival ahead, rival behind, wall outside). In a real race this horse must find a clear path to run.
- Running Styles
- E/EE = early speed (rushes to rail). P = presser (stalks the pace). S = stalker. SS = slow starter / closer.
| Stat | vs. Current Card | vs. All Horses |
|---|---|---|
| Averages
Career-average metrics across all AI race analysis. Performance and pace averages reflect estimated historical performance; trainer and jockey grades score in-the-money percentages. Grading scale: A = elite • B = above average • C = average • D = below average • F = poor • — = no data |
||
| Pick Pony AI Rating | A | C |
| Pace Trip Longshot | — | — |
| Connections Longshot | — | — |
| Situational Longshot | — | — |
| Speed | B | B |
| Early Pace | A | B |
| Mid Pace | A | A |
| Late Pace | B | B |
| Finish Pos | A | B |
| Dirt Speed | A | A |
| Turf Speed | D | B |
| Distance Speed | B | B |
| Trainer Effectiveness | A | C |
| Jockey Effectiveness | A | A |
| 3rd Party Ratings | B | B |
| Recent
Performance analysis from the horse's recent races, weighted to reflect current form. Sprint and Route FPS (Foot Per Second) measure pace efficiency over the horse's recent sprints and routes respectively. Grading scale: A = elite • B = above average • C = average • D = below average • F = poor • — = no data |
||
| Speed | A | B |
| Early Pace | A | B |
| Mid Pace | A | A |
| Late Pace | A | A |
| Sprint FPS | A | B |
| Route FPS | B | A |
| Trainer Effectiveness | A | C |
| Jockey Effectiveness | A | A |
| 3rd Party Ratings | B | B |
| Predictions
AI-generated projections for the upcoming race, derived from prior AI analysis for speed and pace trends, surface and distance suitability, and current conditions. Grading scale: A = elite • B = above average • C = average • D = below average • F = poor • — = no data |
||
| Speed | B | B |
| Early Pace | A | B |
| Mid Pace | A | A |
| Late Pace | C | C |
Chart Guide (2.0.36)
- Bubbles
- Color = surface: green (turf), brown (dirt), blue (synthetic)
- Top number = finishing position; bottom number in parentheses = starting post position
- Height above line = beaten lengths — closer means a smaller margin
- Border = track conditions: green (FST/GD/FM), yellow (WF/SL/YLD), red (SY/MY/FRZ/SFT/HVY)
- Connecting Line
- Solid = good conditions; dashed = bad conditions
- Line Symbol
- ▲ Triangle = sprint (7f or less); ● Circle = route (more than 7f)
- Days Between Races
- Small number above each bubble (e.g. 19d) = days since the previous race — helps spot freshness, layoffs, and tight scheduling.
- Shaded Band (Bollinger)
- Highlights volatility — a wider band means more variation in recent performance
- Performance Trend
- Straight line showing the overall performance direction — angled up = improving, angled down = declining
- Dashed Reference Line
- AI Opponent = AI analysis class-level par for the race
AI Model History Guide
- Lines
- Each solid line shows this horse’s model score over its last 10 races: blue = Mod1, green = Mod2, amber = Mod3.
- Dashed Lines
- Dashed lines represent the current race’s field average for each model — a score below the dashed line indicates the horse ranked below average in this model’s assessment.
- Higher is Stronger
- All three model scores are 0–100: a higher number means the model rates this horse more favorably among the field.
Mod1(W): 82 (1/8) Mod2(W): 75 (2/8) Mod3(W): 79 (3/8) Mod1-LS: 55 (6/8) Win Prob: 18.4% Value Score: 1.35 ★
Performance vs. Peers Guide
- Bars (per post)
- Blue = avg career performance • Amber = avg last 3 races • Green = last race (improved vs. avg) • Red = last race (declined vs. avg)
- Trend Line
- Angled line above the bars: rising = improving form • falling = declining form.
- Horizontal Line
- Field average — the mean career performance of all horses in this race.
- Color Circles
- Standard post-position colors below each lane — same as the Total Pace chart.
- Border
- Thicker border = this horse’s post position.
Figure Comparison
- Rating
- The three Pick Pony algorithm ratings (Algo 1, Algo 2, Algo 3) that make up the overall PP AI Rating — higher is a stronger contender rating.
- Speed
- Career average speed, recent 3-race average, and last-race speed figure — spot horses in improving or declining form.
- Pace
- Average Early (E1), Mid (E2), and Stretch (LP) pace figures — reveals pace-setters vs. closers vs. all-the-way types.
- This horse
- The horse whose stats card is open is highlighted with a darker column background.
Winning Profiles
- Axes
- X: Win % from last 10 starts — Y: In-the-money % (top-3 finishes) from last 10 starts.
- Quadrants
- Consistent Winners (top-right): high win & ITM — reliable performers.
Place Threats (top-left): boards often but doesn’t win often — good exacta/trifecta angles.
Streaky (bottom-right): wins occasionally, misses the board often — all-or-nothing.
Developing (bottom-left): still finding form — longshot territory. - Reference Lines
- Dashed lines mark field averages. Dots to the right win more; dots higher board more.
- This horse
- Highlighted with a gold border and larger dot.
AI Model Comparison
- Winner Models (green)
- Mod1(W), Mod2(W), and Mod3(W) trained to predict race winners. Higher score = stronger contender.
- Longshot Models (red)
- Mod1-LS, Mod2-LS, and Mod3-LS trained to find high-value longshots. Higher score = stronger longshot candidate.
- Form Model (blue)
- Mod4 sequence model trained on recent form patterns. Higher score = stronger recent form profile.
- This horse
- Highlighted with a darker column background.
Race Pace Simulation Guide
- Slider
- Drag left→right to advance from gate to finish. Drag all the way back to reset the race.
- Predicted Finish Order
- Factors in contested pace burn, each horse’s effort curve (peaked-early vs. peaked-late), and wide trip cost from outside posts. Updated live when Track Bias changes.
- Pace Scenario
- Lone Speed: single E horse likely rates and holds. Contested: two E horses burn each other — closers benefit. Hot Pace: speed meltdown, deep closers thrive. Soft: no early speed, moderate fractions throughout.
- Track Bias
- Slider below canvas. −2 = strong closer/wet bias; +2 = strong speed/rail bias. Recomputes the predicted finish order.
- Boxed Indicator
- Dashed orange ring = horse is surrounded (rival ahead, rival behind, wall outside). In a real race this horse must find a clear path to run.
- Running Styles
- E/EE = early speed (rushes to rail). P = presser (stalks the pace). S = stalker. SS = slow starter / closer.
| Stat | vs. Current Card | vs. All Horses |
|---|---|---|
| Averages
Career-average metrics across all AI race analysis. Performance and pace averages reflect estimated historical performance; trainer and jockey grades score in-the-money percentages. Grading scale: A = elite • B = above average • C = average • D = below average • F = poor • — = no data |
||
| Pick Pony AI Rating | A | B |
| Pace Trip Longshot | — | — |
| Connections Longshot | — | — |
| Situational Longshot | — | — |
| Speed | A | A |
| Early Pace | F | D |
| Mid Pace | F | D |
| Late Pace | A | A |
| Finish Pos | A | B |
| Dirt Speed | C | B |
| Turf Speed | B | A |
| Distance Speed | B | A |
| Trainer Effectiveness | B | D |
| Jockey Effectiveness | A | A |
| 3rd Party Ratings | B | B |
| Recent
Performance analysis from the horse's recent races, weighted to reflect current form. Sprint and Route FPS (Foot Per Second) measure pace efficiency over the horse's recent sprints and routes respectively. Grading scale: A = elite • B = above average • C = average • D = below average • F = poor • — = no data |
||
| Speed | B | B |
| Early Pace | F | D |
| Mid Pace | F | D |
| Late Pace | A | A |
| Sprint FPS | F | D |
| Route FPS | D | D |
| Trainer Effectiveness | B | D |
| Jockey Effectiveness | A | A |
| 3rd Party Ratings | B | B |
| Predictions
AI-generated projections for the upcoming race, derived from prior AI analysis for speed and pace trends, surface and distance suitability, and current conditions. Grading scale: A = elite • B = above average • C = average • D = below average • F = poor • — = no data |
||
| Speed | A | B |
| Early Pace | D | D |
| Mid Pace | F | D |
| Late Pace | C | C |
Chart Guide (2.0.36)
- Bubbles
- Color = surface: green (turf), brown (dirt), blue (synthetic)
- Top number = finishing position; bottom number in parentheses = starting post position
- Height above line = beaten lengths — closer means a smaller margin
- Border = track conditions: green (FST/GD/FM), yellow (WF/SL/YLD), red (SY/MY/FRZ/SFT/HVY)
- Connecting Line
- Solid = good conditions; dashed = bad conditions
- Line Symbol
- ▲ Triangle = sprint (7f or less); ● Circle = route (more than 7f)
- Days Between Races
- Small number above each bubble (e.g. 19d) = days since the previous race — helps spot freshness, layoffs, and tight scheduling.
- Shaded Band (Bollinger)
- Highlights volatility — a wider band means more variation in recent performance
- Performance Trend
- Straight line showing the overall performance direction — angled up = improving, angled down = declining
- Dashed Reference Line
- AI Opponent = AI analysis class-level par for the race
AI Model History Guide
- Lines
- Each solid line shows this horse’s model score over its last 10 races: blue = Mod1, green = Mod2, amber = Mod3.
- Dashed Lines
- Dashed lines represent the current race’s field average for each model — a score below the dashed line indicates the horse ranked below average in this model’s assessment.
- Higher is Stronger
- All three model scores are 0–100: a higher number means the model rates this horse more favorably among the field.
Mod1(W): 82 (1/8) Mod2(W): 75 (2/8) Mod3(W): 79 (3/8) Mod1-LS: 55 (6/8) Win Prob: 18.4% Value Score: 1.35 ★
Performance vs. Peers Guide
- Bars (per post)
- Blue = avg career performance • Amber = avg last 3 races • Green = last race (improved vs. avg) • Red = last race (declined vs. avg)
- Trend Line
- Angled line above the bars: rising = improving form • falling = declining form.
- Horizontal Line
- Field average — the mean career performance of all horses in this race.
- Color Circles
- Standard post-position colors below each lane — same as the Total Pace chart.
- Border
- Thicker border = this horse’s post position.
Figure Comparison
- Rating
- The three Pick Pony algorithm ratings (Algo 1, Algo 2, Algo 3) that make up the overall PP AI Rating — higher is a stronger contender rating.
- Speed
- Career average speed, recent 3-race average, and last-race speed figure — spot horses in improving or declining form.
- Pace
- Average Early (E1), Mid (E2), and Stretch (LP) pace figures — reveals pace-setters vs. closers vs. all-the-way types.
- This horse
- The horse whose stats card is open is highlighted with a darker column background.
Winning Profiles
- Axes
- X: Win % from last 10 starts — Y: In-the-money % (top-3 finishes) from last 10 starts.
- Quadrants
- Consistent Winners (top-right): high win & ITM — reliable performers.
Place Threats (top-left): boards often but doesn’t win often — good exacta/trifecta angles.
Streaky (bottom-right): wins occasionally, misses the board often — all-or-nothing.
Developing (bottom-left): still finding form — longshot territory. - Reference Lines
- Dashed lines mark field averages. Dots to the right win more; dots higher board more.
- This horse
- Highlighted with a gold border and larger dot.
AI Model Comparison
- Winner Models (green)
- Mod1(W), Mod2(W), and Mod3(W) trained to predict race winners. Higher score = stronger contender.
- Longshot Models (red)
- Mod1-LS, Mod2-LS, and Mod3-LS trained to find high-value longshots. Higher score = stronger longshot candidate.
- Form Model (blue)
- Mod4 sequence model trained on recent form patterns. Higher score = stronger recent form profile.
- This horse
- Highlighted with a darker column background.
Race Pace Simulation Guide
- Slider
- Drag left→right to advance from gate to finish. Drag all the way back to reset the race.
- Predicted Finish Order
- Factors in contested pace burn, each horse’s effort curve (peaked-early vs. peaked-late), and wide trip cost from outside posts. Updated live when Track Bias changes.
- Pace Scenario
- Lone Speed: single E horse likely rates and holds. Contested: two E horses burn each other — closers benefit. Hot Pace: speed meltdown, deep closers thrive. Soft: no early speed, moderate fractions throughout.
- Track Bias
- Slider below canvas. −2 = strong closer/wet bias; +2 = strong speed/rail bias. Recomputes the predicted finish order.
- Boxed Indicator
- Dashed orange ring = horse is surrounded (rival ahead, rival behind, wall outside). In a real race this horse must find a clear path to run.
- Running Styles
- E/EE = early speed (rushes to rail). P = presser (stalks the pace). S = stalker. SS = slow starter / closer.
| Stat | vs. Current Card | vs. All Horses |
|---|---|---|
| Averages
Career-average metrics across all AI race analysis. Performance and pace averages reflect estimated historical performance; trainer and jockey grades score in-the-money percentages. Grading scale: A = elite • B = above average • C = average • D = below average • F = poor • — = no data |
||
| Pick Pony AI Rating | C | C |
| Pace Trip Longshot | — | — |
| Connections Longshot | — | — |
| Situational Longshot | — | — |
| Speed | D | C |
| Early Pace | B | B |
| Mid Pace | B | B |
| Late Pace | D | C |
| Finish Pos | F | D |
| Dirt Speed | A | A |
| Turf Speed | C | A |
| Distance Speed | A | A |
| Trainer Effectiveness | C | D |
| Jockey Effectiveness | D | C |
| 3rd Party Ratings | C | B |
| Recent
Performance analysis from the horse's recent races, weighted to reflect current form. Sprint and Route FPS (Foot Per Second) measure pace efficiency over the horse's recent sprints and routes respectively. Grading scale: A = elite • B = above average • C = average • D = below average • F = poor • — = no data |
||
| Speed | F | C |
| Early Pace | B | C |
| Mid Pace | C | C |
| Late Pace | F | C |
| Sprint FPS | D | C |
| Route FPS | D | B |
| Trainer Effectiveness | C | D |
| Jockey Effectiveness | D | C |
| 3rd Party Ratings | C | B |
| Predictions
AI-generated projections for the upcoming race, derived from prior AI analysis for speed and pace trends, surface and distance suitability, and current conditions. Grading scale: A = elite • B = above average • C = average • D = below average • F = poor • — = no data |
||
| Speed | D | C |
| Early Pace | B | B |
| Mid Pace | B | B |
| Late Pace | C | C |
Chart Guide (2.0.36)
- Bubbles
- Color = surface: green (turf), brown (dirt), blue (synthetic)
- Top number = finishing position; bottom number in parentheses = starting post position
- Height above line = beaten lengths — closer means a smaller margin
- Border = track conditions: green (FST/GD/FM), yellow (WF/SL/YLD), red (SY/MY/FRZ/SFT/HVY)
- Connecting Line
- Solid = good conditions; dashed = bad conditions
- Line Symbol
- ▲ Triangle = sprint (7f or less); ● Circle = route (more than 7f)
- Days Between Races
- Small number above each bubble (e.g. 19d) = days since the previous race — helps spot freshness, layoffs, and tight scheduling.
- Shaded Band (Bollinger)
- Highlights volatility — a wider band means more variation in recent performance
- Performance Trend
- Straight line showing the overall performance direction — angled up = improving, angled down = declining
- Dashed Reference Line
- AI Opponent = AI analysis class-level par for the race
AI Model History Guide
- Lines
- Each solid line shows this horse’s model score over its last 10 races: blue = Mod1, green = Mod2, amber = Mod3.
- Dashed Lines
- Dashed lines represent the current race’s field average for each model — a score below the dashed line indicates the horse ranked below average in this model’s assessment.
- Higher is Stronger
- All three model scores are 0–100: a higher number means the model rates this horse more favorably among the field.
Mod1(W): 82 (1/8) Mod2(W): 75 (2/8) Mod3(W): 79 (3/8) Mod1-LS: 55 (6/8) Win Prob: 18.4% Value Score: 1.35 ★
Performance vs. Peers Guide
- Bars (per post)
- Blue = avg career performance • Amber = avg last 3 races • Green = last race (improved vs. avg) • Red = last race (declined vs. avg)
- Trend Line
- Angled line above the bars: rising = improving form • falling = declining form.
- Horizontal Line
- Field average — the mean career performance of all horses in this race.
- Color Circles
- Standard post-position colors below each lane — same as the Total Pace chart.
- Border
- Thicker border = this horse’s post position.
Figure Comparison
- Rating
- The three Pick Pony algorithm ratings (Algo 1, Algo 2, Algo 3) that make up the overall PP AI Rating — higher is a stronger contender rating.
- Speed
- Career average speed, recent 3-race average, and last-race speed figure — spot horses in improving or declining form.
- Pace
- Average Early (E1), Mid (E2), and Stretch (LP) pace figures — reveals pace-setters vs. closers vs. all-the-way types.
- This horse
- The horse whose stats card is open is highlighted with a darker column background.
Winning Profiles
- Axes
- X: Win % from last 10 starts — Y: In-the-money % (top-3 finishes) from last 10 starts.
- Quadrants
- Consistent Winners (top-right): high win & ITM — reliable performers.
Place Threats (top-left): boards often but doesn’t win often — good exacta/trifecta angles.
Streaky (bottom-right): wins occasionally, misses the board often — all-or-nothing.
Developing (bottom-left): still finding form — longshot territory. - Reference Lines
- Dashed lines mark field averages. Dots to the right win more; dots higher board more.
- This horse
- Highlighted with a gold border and larger dot.
AI Model Comparison
- Winner Models (green)
- Mod1(W), Mod2(W), and Mod3(W) trained to predict race winners. Higher score = stronger contender.
- Longshot Models (red)
- Mod1-LS, Mod2-LS, and Mod3-LS trained to find high-value longshots. Higher score = stronger longshot candidate.
- Form Model (blue)
- Mod4 sequence model trained on recent form patterns. Higher score = stronger recent form profile.
- This horse
- Highlighted with a darker column background.
Race Pace Simulation Guide
- Slider
- Drag left→right to advance from gate to finish. Drag all the way back to reset the race.
- Predicted Finish Order
- Factors in contested pace burn, each horse’s effort curve (peaked-early vs. peaked-late), and wide trip cost from outside posts. Updated live when Track Bias changes.
- Pace Scenario
- Lone Speed: single E horse likely rates and holds. Contested: two E horses burn each other — closers benefit. Hot Pace: speed meltdown, deep closers thrive. Soft: no early speed, moderate fractions throughout.
- Track Bias
- Slider below canvas. −2 = strong closer/wet bias; +2 = strong speed/rail bias. Recomputes the predicted finish order.
- Boxed Indicator
- Dashed orange ring = horse is surrounded (rival ahead, rival behind, wall outside). In a real race this horse must find a clear path to run.
- Running Styles
- E/EE = early speed (rushes to rail). P = presser (stalks the pace). S = stalker. SS = slow starter / closer.
| Stat | vs. Current Card | vs. All Horses |
|---|---|---|
| Averages
Career-average metrics across all AI race analysis. Performance and pace averages reflect estimated historical performance; trainer and jockey grades score in-the-money percentages. Grading scale: A = elite • B = above average • C = average • D = below average • F = poor • — = no data |
||
| Pick Pony AI Rating | B | C |
| Pace Trip Longshot | — | — |
| Connections Longshot | — | — |
| Situational Longshot | — | — |
| Speed | A | A |
| Early Pace | D | D |
| Mid Pace | D | C |
| Late Pace | A | A |
| Finish Pos | B | B |
| Dirt Speed | B | A |
| Turf Speed | A | A |
| Distance Speed | A | A |
| Trainer Effectiveness | A | B |
| Jockey Effectiveness | C | C |
| 3rd Party Ratings | A | A |
| Recent
Performance analysis from the horse's recent races, weighted to reflect current form. Sprint and Route FPS (Foot Per Second) measure pace efficiency over the horse's recent sprints and routes respectively. Grading scale: A = elite • B = above average • C = average • D = below average • F = poor • — = no data |
||
| Speed | A | B |
| Early Pace | D | D |
| Mid Pace | B | B |
| Late Pace | B | B |
| Sprint FPS | B | B |
| Route FPS | B | A |
| Trainer Effectiveness | A | B |
| Jockey Effectiveness | C | C |
| 3rd Party Ratings | A | A |
| Predictions
AI-generated projections for the upcoming race, derived from prior AI analysis for speed and pace trends, surface and distance suitability, and current conditions. Grading scale: A = elite • B = above average • C = average • D = below average • F = poor • — = no data |
||
| Speed | A | A |
| Early Pace | F | D |
| Mid Pace | D | C |
| Late Pace | C | C |
Chart Guide (2.0.36)
- Bubbles
- Color = surface: green (turf), brown (dirt), blue (synthetic)
- Top number = finishing position; bottom number in parentheses = starting post position
- Height above line = beaten lengths — closer means a smaller margin
- Border = track conditions: green (FST/GD/FM), yellow (WF/SL/YLD), red (SY/MY/FRZ/SFT/HVY)
- Connecting Line
- Solid = good conditions; dashed = bad conditions
- Line Symbol
- ▲ Triangle = sprint (7f or less); ● Circle = route (more than 7f)
- Days Between Races
- Small number above each bubble (e.g. 19d) = days since the previous race — helps spot freshness, layoffs, and tight scheduling.
- Shaded Band (Bollinger)
- Highlights volatility — a wider band means more variation in recent performance
- Performance Trend
- Straight line showing the overall performance direction — angled up = improving, angled down = declining
- Dashed Reference Line
- AI Opponent = AI analysis class-level par for the race
AI Model History Guide
- Lines
- Each solid line shows this horse’s model score over its last 10 races: blue = Mod1, green = Mod2, amber = Mod3.
- Dashed Lines
- Dashed lines represent the current race’s field average for each model — a score below the dashed line indicates the horse ranked below average in this model’s assessment.
- Higher is Stronger
- All three model scores are 0–100: a higher number means the model rates this horse more favorably among the field.
Mod1(W): 82 (1/8) Mod2(W): 75 (2/8) Mod3(W): 79 (3/8) Mod1-LS: 55 (6/8) Win Prob: 18.4% Value Score: 1.35 ★
Performance vs. Peers Guide
- Bars (per post)
- Blue = avg career performance • Amber = avg last 3 races • Green = last race (improved vs. avg) • Red = last race (declined vs. avg)
- Trend Line
- Angled line above the bars: rising = improving form • falling = declining form.
- Horizontal Line
- Field average — the mean career performance of all horses in this race.
- Color Circles
- Standard post-position colors below each lane — same as the Total Pace chart.
- Border
- Thicker border = this horse’s post position.
Figure Comparison
- Rating
- The three Pick Pony algorithm ratings (Algo 1, Algo 2, Algo 3) that make up the overall PP AI Rating — higher is a stronger contender rating.
- Speed
- Career average speed, recent 3-race average, and last-race speed figure — spot horses in improving or declining form.
- Pace
- Average Early (E1), Mid (E2), and Stretch (LP) pace figures — reveals pace-setters vs. closers vs. all-the-way types.
- This horse
- The horse whose stats card is open is highlighted with a darker column background.
Winning Profiles
- Axes
- X: Win % from last 10 starts — Y: In-the-money % (top-3 finishes) from last 10 starts.
- Quadrants
- Consistent Winners (top-right): high win & ITM — reliable performers.
Place Threats (top-left): boards often but doesn’t win often — good exacta/trifecta angles.
Streaky (bottom-right): wins occasionally, misses the board often — all-or-nothing.
Developing (bottom-left): still finding form — longshot territory. - Reference Lines
- Dashed lines mark field averages. Dots to the right win more; dots higher board more.
- This horse
- Highlighted with a gold border and larger dot.
AI Model Comparison
- Winner Models (green)
- Mod1(W), Mod2(W), and Mod3(W) trained to predict race winners. Higher score = stronger contender.
- Longshot Models (red)
- Mod1-LS, Mod2-LS, and Mod3-LS trained to find high-value longshots. Higher score = stronger longshot candidate.
- Form Model (blue)
- Mod4 sequence model trained on recent form patterns. Higher score = stronger recent form profile.
- This horse
- Highlighted with a darker column background.
Race Pace Simulation Guide
- Slider
- Drag left→right to advance from gate to finish. Drag all the way back to reset the race.
- Predicted Finish Order
- Factors in contested pace burn, each horse’s effort curve (peaked-early vs. peaked-late), and wide trip cost from outside posts. Updated live when Track Bias changes.
- Pace Scenario
- Lone Speed: single E horse likely rates and holds. Contested: two E horses burn each other — closers benefit. Hot Pace: speed meltdown, deep closers thrive. Soft: no early speed, moderate fractions throughout.
- Track Bias
- Slider below canvas. −2 = strong closer/wet bias; +2 = strong speed/rail bias. Recomputes the predicted finish order.
- Boxed Indicator
- Dashed orange ring = horse is surrounded (rival ahead, rival behind, wall outside). In a real race this horse must find a clear path to run.
- Running Styles
- E/EE = early speed (rushes to rail). P = presser (stalks the pace). S = stalker. SS = slow starter / closer.
| Stat | vs. Current Card | vs. All Horses |
|---|---|---|
| Averages
Career-average metrics across all AI race analysis. Performance and pace averages reflect estimated historical performance; trainer and jockey grades score in-the-money percentages. Grading scale: A = elite • B = above average • C = average • D = below average • F = poor • — = no data |
||
| Pick Pony AI Rating | A | B |
| Pace Trip Longshot | — | — |
| Connections Longshot | — | — |
| Situational Longshot | — | — |
| Speed | A | C |
| Early Pace | B | B |
| Mid Pace | A | A |
| Late Pace | A | B |
| Finish Pos | A | D |
| Dirt Speed | A | C |
| Turf Speed | C | C |
| Distance Speed | A | B |
| Trainer Effectiveness | A | B |
| Jockey Effectiveness | A | A |
| 3rd Party Ratings | A | B |
| Recent
Performance analysis from the horse's recent races, weighted to reflect current form. Sprint and Route FPS (Foot Per Second) measure pace efficiency over the horse's recent sprints and routes respectively. Grading scale: A = elite • B = above average • C = average • D = below average • F = poor • — = no data |
||
| Speed | A | D |
| Early Pace | C | B |
| Mid Pace | A | B |
| Late Pace | B | C |
| Sprint FPS | D | B |
| Route FPS | B | B |
| Trainer Effectiveness | A | B |
| Jockey Effectiveness | A | A |
| 3rd Party Ratings | A | B |
| Predictions
AI-generated projections for the upcoming race, derived from prior AI analysis for speed and pace trends, surface and distance suitability, and current conditions. Grading scale: A = elite • B = above average • C = average • D = below average • F = poor • — = no data |
||
| Speed | A | C |
| Early Pace | C | B |
| Mid Pace | A | A |
| Late Pace | C | C |
Chart Guide (2.0.36)
- Bubbles
- Color = surface: green (turf), brown (dirt), blue (synthetic)
- Top number = finishing position; bottom number in parentheses = starting post position
- Height above line = beaten lengths — closer means a smaller margin
- Border = track conditions: green (FST/GD/FM), yellow (WF/SL/YLD), red (SY/MY/FRZ/SFT/HVY)
- Connecting Line
- Solid = good conditions; dashed = bad conditions
- Line Symbol
- ▲ Triangle = sprint (7f or less); ● Circle = route (more than 7f)
- Days Between Races
- Small number above each bubble (e.g. 19d) = days since the previous race — helps spot freshness, layoffs, and tight scheduling.
- Shaded Band (Bollinger)
- Highlights volatility — a wider band means more variation in recent performance
- Performance Trend
- Straight line showing the overall performance direction — angled up = improving, angled down = declining
- Dashed Reference Line
- AI Opponent = AI analysis class-level par for the race
AI Model History Guide
- Lines
- Each solid line shows this horse’s model score over its last 10 races: blue = Mod1, green = Mod2, amber = Mod3.
- Dashed Lines
- Dashed lines represent the current race’s field average for each model — a score below the dashed line indicates the horse ranked below average in this model’s assessment.
- Higher is Stronger
- All three model scores are 0–100: a higher number means the model rates this horse more favorably among the field.
Mod1(W): 82 (1/8) Mod2(W): 75 (2/8) Mod3(W): 79 (3/8) Mod1-LS: 55 (6/8) Win Prob: 18.4% Value Score: 1.35 ★
Performance vs. Peers Guide
- Bars (per post)
- Blue = avg career performance • Amber = avg last 3 races • Green = last race (improved vs. avg) • Red = last race (declined vs. avg)
- Trend Line
- Angled line above the bars: rising = improving form • falling = declining form.
- Horizontal Line
- Field average — the mean career performance of all horses in this race.
- Color Circles
- Standard post-position colors below each lane — same as the Total Pace chart.
- Border
- Thicker border = this horse’s post position.
Figure Comparison
- Rating
- The three Pick Pony algorithm ratings (Algo 1, Algo 2, Algo 3) that make up the overall PP AI Rating — higher is a stronger contender rating.
- Speed
- Career average speed, recent 3-race average, and last-race speed figure — spot horses in improving or declining form.
- Pace
- Average Early (E1), Mid (E2), and Stretch (LP) pace figures — reveals pace-setters vs. closers vs. all-the-way types.
- This horse
- The horse whose stats card is open is highlighted with a darker column background.
Winning Profiles
- Axes
- X: Win % from last 10 starts — Y: In-the-money % (top-3 finishes) from last 10 starts.
- Quadrants
- Consistent Winners (top-right): high win & ITM — reliable performers.
Place Threats (top-left): boards often but doesn’t win often — good exacta/trifecta angles.
Streaky (bottom-right): wins occasionally, misses the board often — all-or-nothing.
Developing (bottom-left): still finding form — longshot territory. - Reference Lines
- Dashed lines mark field averages. Dots to the right win more; dots higher board more.
- This horse
- Highlighted with a gold border and larger dot.
AI Model Comparison
- Winner Models (green)
- Mod1(W), Mod2(W), and Mod3(W) trained to predict race winners. Higher score = stronger contender.
- Longshot Models (red)
- Mod1-LS, Mod2-LS, and Mod3-LS trained to find high-value longshots. Higher score = stronger longshot candidate.
- Form Model (blue)
- Mod4 sequence model trained on recent form patterns. Higher score = stronger recent form profile.
- This horse
- Highlighted with a darker column background.
Race Pace Simulation Guide
- Slider
- Drag left→right to advance from gate to finish. Drag all the way back to reset the race.
- Predicted Finish Order
- Factors in contested pace burn, each horse’s effort curve (peaked-early vs. peaked-late), and wide trip cost from outside posts. Updated live when Track Bias changes.
- Pace Scenario
- Lone Speed: single E horse likely rates and holds. Contested: two E horses burn each other — closers benefit. Hot Pace: speed meltdown, deep closers thrive. Soft: no early speed, moderate fractions throughout.
- Track Bias
- Slider below canvas. −2 = strong closer/wet bias; +2 = strong speed/rail bias. Recomputes the predicted finish order.
- Boxed Indicator
- Dashed orange ring = horse is surrounded (rival ahead, rival behind, wall outside). In a real race this horse must find a clear path to run.
- Running Styles
- E/EE = early speed (rushes to rail). P = presser (stalks the pace). S = stalker. SS = slow starter / closer.
| Stat | vs. Current Card | vs. All Horses |
|---|---|---|
| Averages
Career-average metrics across all AI race analysis. Performance and pace averages reflect estimated historical performance; trainer and jockey grades score in-the-money percentages. Grading scale: A = elite • B = above average • C = average • D = below average • F = poor • — = no data |
||
| Pick Pony AI Rating | C | C |
| Pace Trip Longshot | — | — |
| Connections Longshot | — | — |
| Situational Longshot | — | — |
| Speed | A | D |
| Early Pace | A | A |
| Mid Pace | B | B |
| Late Pace | A | D |
| Finish Pos | C | D |
| Dirt Speed | B | C |
| Turf Speed | A | B |
| Distance Speed | A | B |
| Trainer Effectiveness | C | B |
| Jockey Effectiveness | C | C |
| 3rd Party Ratings | A | C |
| Recent
Performance analysis from the horse's recent races, weighted to reflect current form. Sprint and Route FPS (Foot Per Second) measure pace efficiency over the horse's recent sprints and routes respectively. Grading scale: A = elite • B = above average • C = average • D = below average • F = poor • — = no data |
||
| Speed | A | D |
| Early Pace | B | B |
| Mid Pace | B | B |
| Late Pace | A | C |
| Sprint FPS | A | A |
| Route FPS | A | A |
| Trainer Effectiveness | C | B |
| Jockey Effectiveness | C | C |
| 3rd Party Ratings | A | C |
| Predictions
AI-generated projections for the upcoming race, derived from prior AI analysis for speed and pace trends, surface and distance suitability, and current conditions. Grading scale: A = elite • B = above average • C = average • D = below average • F = poor • — = no data |
||
| Speed | B | D |
| Early Pace | A | A |
| Mid Pace | B | B |
| Late Pace | C | C |
Chart Guide (2.0.36)
- Bubbles
- Color = surface: green (turf), brown (dirt), blue (synthetic)
- Top number = finishing position; bottom number in parentheses = starting post position
- Height above line = beaten lengths — closer means a smaller margin
- Border = track conditions: green (FST/GD/FM), yellow (WF/SL/YLD), red (SY/MY/FRZ/SFT/HVY)
- Connecting Line
- Solid = good conditions; dashed = bad conditions
- Line Symbol
- ▲ Triangle = sprint (7f or less); ● Circle = route (more than 7f)
- Days Between Races
- Small number above each bubble (e.g. 19d) = days since the previous race — helps spot freshness, layoffs, and tight scheduling.
- Shaded Band (Bollinger)
- Highlights volatility — a wider band means more variation in recent performance
- Performance Trend
- Straight line showing the overall performance direction — angled up = improving, angled down = declining
- Dashed Reference Line
- AI Opponent = AI analysis class-level par for the race
AI Model History Guide
- Lines
- Each solid line shows this horse’s model score over its last 10 races: blue = Mod1, green = Mod2, amber = Mod3.
- Dashed Lines
- Dashed lines represent the current race’s field average for each model — a score below the dashed line indicates the horse ranked below average in this model’s assessment.
- Higher is Stronger
- All three model scores are 0–100: a higher number means the model rates this horse more favorably among the field.
Mod1(W): 82 (1/8) Mod2(W): 75 (2/8) Mod3(W): 79 (3/8) Mod1-LS: 55 (6/8) Win Prob: 18.4% Value Score: 1.35 ★
Performance vs. Peers Guide
- Bars (per post)
- Blue = avg career performance • Amber = avg last 3 races • Green = last race (improved vs. avg) • Red = last race (declined vs. avg)
- Trend Line
- Angled line above the bars: rising = improving form • falling = declining form.
- Horizontal Line
- Field average — the mean career performance of all horses in this race.
- Color Circles
- Standard post-position colors below each lane — same as the Total Pace chart.
- Border
- Thicker border = this horse’s post position.
Figure Comparison
- Rating
- The three Pick Pony algorithm ratings (Algo 1, Algo 2, Algo 3) that make up the overall PP AI Rating — higher is a stronger contender rating.
- Speed
- Career average speed, recent 3-race average, and last-race speed figure — spot horses in improving or declining form.
- Pace
- Average Early (E1), Mid (E2), and Stretch (LP) pace figures — reveals pace-setters vs. closers vs. all-the-way types.
- This horse
- The horse whose stats card is open is highlighted with a darker column background.
Winning Profiles
- Axes
- X: Win % from last 10 starts — Y: In-the-money % (top-3 finishes) from last 10 starts.
- Quadrants
- Consistent Winners (top-right): high win & ITM — reliable performers.
Place Threats (top-left): boards often but doesn’t win often — good exacta/trifecta angles.
Streaky (bottom-right): wins occasionally, misses the board often — all-or-nothing.
Developing (bottom-left): still finding form — longshot territory. - Reference Lines
- Dashed lines mark field averages. Dots to the right win more; dots higher board more.
- This horse
- Highlighted with a gold border and larger dot.
AI Model Comparison
- Winner Models (green)
- Mod1(W), Mod2(W), and Mod3(W) trained to predict race winners. Higher score = stronger contender.
- Longshot Models (red)
- Mod1-LS, Mod2-LS, and Mod3-LS trained to find high-value longshots. Higher score = stronger longshot candidate.
- Form Model (blue)
- Mod4 sequence model trained on recent form patterns. Higher score = stronger recent form profile.
- This horse
- Highlighted with a darker column background.
Race Pace Simulation Guide
- Slider
- Drag left→right to advance from gate to finish. Drag all the way back to reset the race.
- Predicted Finish Order
- Factors in contested pace burn, each horse’s effort curve (peaked-early vs. peaked-late), and wide trip cost from outside posts. Updated live when Track Bias changes.
- Pace Scenario
- Lone Speed: single E horse likely rates and holds. Contested: two E horses burn each other — closers benefit. Hot Pace: speed meltdown, deep closers thrive. Soft: no early speed, moderate fractions throughout.
- Track Bias
- Slider below canvas. −2 = strong closer/wet bias; +2 = strong speed/rail bias. Recomputes the predicted finish order.
- Boxed Indicator
- Dashed orange ring = horse is surrounded (rival ahead, rival behind, wall outside). In a real race this horse must find a clear path to run.
- Running Styles
- E/EE = early speed (rushes to rail). P = presser (stalks the pace). S = stalker. SS = slow starter / closer.
| Stat | vs. Current Card | vs. All Horses |
|---|---|---|
| Averages
Career-average metrics across all AI race analysis. Performance and pace averages reflect estimated historical performance; trainer and jockey grades score in-the-money percentages. Grading scale: A = elite • B = above average • C = average • D = below average • F = poor • — = no data |
||
| Pick Pony AI Rating | C | C |
| Pace Trip Longshot | — | — |
| Connections Longshot | — | — |
| Situational Longshot | — | — |
| Speed | F | F |
| Early Pace | F | C |
| Mid Pace | F | C |
| Late Pace | D | D |
| Finish Pos | D | F |
| Dirt Speed | F | D |
| Turf Speed | C | C |
| Distance Speed | F | C |
| Trainer Effectiveness | F | D |
| Jockey Effectiveness | D | F |
| 3rd Party Ratings | D | D |
| Recent
Performance analysis from the horse's recent races, weighted to reflect current form. Sprint and Route FPS (Foot Per Second) measure pace efficiency over the horse's recent sprints and routes respectively. Grading scale: A = elite • B = above average • C = average • D = below average • F = poor • — = no data |
||
| Speed | D | F |
| Early Pace | D | B |
| Mid Pace | D | C |
| Late Pace | C | D |
| Sprint FPS | B | A |
| Route FPS | D | B |
| Trainer Effectiveness | F | D |
| Jockey Effectiveness | D | F |
| 3rd Party Ratings | D | D |
| Predictions
AI-generated projections for the upcoming race, derived from prior AI analysis for speed and pace trends, surface and distance suitability, and current conditions. Grading scale: A = elite • B = above average • C = average • D = below average • F = poor • — = no data |
||
| Speed | F | F |
| Early Pace | F | C |
| Mid Pace | D | C |
| Late Pace | C | C |
Chart Guide (2.0.36)
- Bubbles
- Color = surface: green (turf), brown (dirt), blue (synthetic)
- Top number = finishing position; bottom number in parentheses = starting post position
- Height above line = beaten lengths — closer means a smaller margin
- Border = track conditions: green (FST/GD/FM), yellow (WF/SL/YLD), red (SY/MY/FRZ/SFT/HVY)
- Connecting Line
- Solid = good conditions; dashed = bad conditions
- Line Symbol
- ▲ Triangle = sprint (7f or less); ● Circle = route (more than 7f)
- Days Between Races
- Small number above each bubble (e.g. 19d) = days since the previous race — helps spot freshness, layoffs, and tight scheduling.
- Shaded Band (Bollinger)
- Highlights volatility — a wider band means more variation in recent performance
- Performance Trend
- Straight line showing the overall performance direction — angled up = improving, angled down = declining
- Dashed Reference Line
- AI Opponent = AI analysis class-level par for the race
AI Model History Guide
- Lines
- Each solid line shows this horse’s model score over its last 10 races: blue = Mod1, green = Mod2, amber = Mod3.
- Dashed Lines
- Dashed lines represent the current race’s field average for each model — a score below the dashed line indicates the horse ranked below average in this model’s assessment.
- Higher is Stronger
- All three model scores are 0–100: a higher number means the model rates this horse more favorably among the field.
Mod1(W): 82 (1/8) Mod2(W): 75 (2/8) Mod3(W): 79 (3/8) Mod1-LS: 55 (6/8) Win Prob: 18.4% Value Score: 1.35 ★
Performance vs. Peers Guide
- Bars (per post)
- Blue = avg career performance • Amber = avg last 3 races • Green = last race (improved vs. avg) • Red = last race (declined vs. avg)
- Trend Line
- Angled line above the bars: rising = improving form • falling = declining form.
- Horizontal Line
- Field average — the mean career performance of all horses in this race.
- Color Circles
- Standard post-position colors below each lane — same as the Total Pace chart.
- Border
- Thicker border = this horse’s post position.
Figure Comparison
- Rating
- The three Pick Pony algorithm ratings (Algo 1, Algo 2, Algo 3) that make up the overall PP AI Rating — higher is a stronger contender rating.
- Speed
- Career average speed, recent 3-race average, and last-race speed figure — spot horses in improving or declining form.
- Pace
- Average Early (E1), Mid (E2), and Stretch (LP) pace figures — reveals pace-setters vs. closers vs. all-the-way types.
- This horse
- The horse whose stats card is open is highlighted with a darker column background.
Winning Profiles
- Axes
- X: Win % from last 10 starts — Y: In-the-money % (top-3 finishes) from last 10 starts.
- Quadrants
- Consistent Winners (top-right): high win & ITM — reliable performers.
Place Threats (top-left): boards often but doesn’t win often — good exacta/trifecta angles.
Streaky (bottom-right): wins occasionally, misses the board often — all-or-nothing.
Developing (bottom-left): still finding form — longshot territory. - Reference Lines
- Dashed lines mark field averages. Dots to the right win more; dots higher board more.
- This horse
- Highlighted with a gold border and larger dot.
AI Model Comparison
- Winner Models (green)
- Mod1(W), Mod2(W), and Mod3(W) trained to predict race winners. Higher score = stronger contender.
- Longshot Models (red)
- Mod1-LS, Mod2-LS, and Mod3-LS trained to find high-value longshots. Higher score = stronger longshot candidate.
- Form Model (blue)
- Mod4 sequence model trained on recent form patterns. Higher score = stronger recent form profile.
- This horse
- Highlighted with a darker column background.
Race Pace Simulation Guide
- Slider
- Drag left→right to advance from gate to finish. Drag all the way back to reset the race.
- Predicted Finish Order
- Factors in contested pace burn, each horse’s effort curve (peaked-early vs. peaked-late), and wide trip cost from outside posts. Updated live when Track Bias changes.
- Pace Scenario
- Lone Speed: single E horse likely rates and holds. Contested: two E horses burn each other — closers benefit. Hot Pace: speed meltdown, deep closers thrive. Soft: no early speed, moderate fractions throughout.
- Track Bias
- Slider below canvas. −2 = strong closer/wet bias; +2 = strong speed/rail bias. Recomputes the predicted finish order.
- Boxed Indicator
- Dashed orange ring = horse is surrounded (rival ahead, rival behind, wall outside). In a real race this horse must find a clear path to run.
- Running Styles
- E/EE = early speed (rushes to rail). P = presser (stalks the pace). S = stalker. SS = slow starter / closer.
| Stat | vs. Current Card | vs. All Horses |
|---|---|---|
| Averages
Career-average metrics across all AI race analysis. Performance and pace averages reflect estimated historical performance; trainer and jockey grades score in-the-money percentages. Grading scale: A = elite • B = above average • C = average • D = below average • F = poor • — = no data |
||
| Pick Pony AI Rating | D | C |
| Pace Trip Longshot | — | — |
| Connections Longshot | — | — |
| Situational Longshot | — | — |
| Speed | C | D |
| Early Pace | D | C |
| Mid Pace | C | C |
| Late Pace | B | D |
| Finish Pos | C | F |
| Dirt Speed | A | C |
| Turf Speed | F | D |
| Distance Speed | B | C |
| Trainer Effectiveness | A | B |
| Jockey Effectiveness | A | A |
| 3rd Party Ratings | C | D |
| Recent
Performance analysis from the horse's recent races, weighted to reflect current form. Sprint and Route FPS (Foot Per Second) measure pace efficiency over the horse's recent sprints and routes respectively. Grading scale: A = elite • B = above average • C = average • D = below average • F = poor • — = no data |
||
| Speed | B | D |
| Early Pace | F | C |
| Mid Pace | C | C |
| Late Pace | A | C |
| Sprint FPS | C | B |
| Route FPS | F | C |
| Trainer Effectiveness | A | B |
| Jockey Effectiveness | A | A |
| 3rd Party Ratings | C | D |
| Predictions
AI-generated projections for the upcoming race, derived from prior AI analysis for speed and pace trends, surface and distance suitability, and current conditions. Grading scale: A = elite • B = above average • C = average • D = below average • F = poor • — = no data |
||
| Speed | C | F |
| Early Pace | D | C |
| Mid Pace | C | C |
| Late Pace | C | C |
Chart Guide (2.0.36)
- Bubbles
- Color = surface: green (turf), brown (dirt), blue (synthetic)
- Top number = finishing position; bottom number in parentheses = starting post position
- Height above line = beaten lengths — closer means a smaller margin
- Border = track conditions: green (FST/GD/FM), yellow (WF/SL/YLD), red (SY/MY/FRZ/SFT/HVY)
- Connecting Line
- Solid = good conditions; dashed = bad conditions
- Line Symbol
- ▲ Triangle = sprint (7f or less); ● Circle = route (more than 7f)
- Days Between Races
- Small number above each bubble (e.g. 19d) = days since the previous race — helps spot freshness, layoffs, and tight scheduling.
- Shaded Band (Bollinger)
- Highlights volatility — a wider band means more variation in recent performance
- Performance Trend
- Straight line showing the overall performance direction — angled up = improving, angled down = declining
- Dashed Reference Line
- AI Opponent = AI analysis class-level par for the race
AI Model History Guide
- Lines
- Each solid line shows this horse’s model score over its last 10 races: blue = Mod1, green = Mod2, amber = Mod3.
- Dashed Lines
- Dashed lines represent the current race’s field average for each model — a score below the dashed line indicates the horse ranked below average in this model’s assessment.
- Higher is Stronger
- All three model scores are 0–100: a higher number means the model rates this horse more favorably among the field.
Mod1(W): 82 (1/8) Mod2(W): 75 (2/8) Mod3(W): 79 (3/8) Mod1-LS: 55 (6/8) Win Prob: 18.4% Value Score: 1.35 ★
Performance vs. Peers Guide
- Bars (per post)
- Blue = avg career performance • Amber = avg last 3 races • Green = last race (improved vs. avg) • Red = last race (declined vs. avg)
- Trend Line
- Angled line above the bars: rising = improving form • falling = declining form.
- Horizontal Line
- Field average — the mean career performance of all horses in this race.
- Color Circles
- Standard post-position colors below each lane — same as the Total Pace chart.
- Border
- Thicker border = this horse’s post position.
Figure Comparison
- Rating
- The three Pick Pony algorithm ratings (Algo 1, Algo 2, Algo 3) that make up the overall PP AI Rating — higher is a stronger contender rating.
- Speed
- Career average speed, recent 3-race average, and last-race speed figure — spot horses in improving or declining form.
- Pace
- Average Early (E1), Mid (E2), and Stretch (LP) pace figures — reveals pace-setters vs. closers vs. all-the-way types.
- This horse
- The horse whose stats card is open is highlighted with a darker column background.
Winning Profiles
- Axes
- X: Win % from last 10 starts — Y: In-the-money % (top-3 finishes) from last 10 starts.
- Quadrants
- Consistent Winners (top-right): high win & ITM — reliable performers.
Place Threats (top-left): boards often but doesn’t win often — good exacta/trifecta angles.
Streaky (bottom-right): wins occasionally, misses the board often — all-or-nothing.
Developing (bottom-left): still finding form — longshot territory. - Reference Lines
- Dashed lines mark field averages. Dots to the right win more; dots higher board more.
- This horse
- Highlighted with a gold border and larger dot.
AI Model Comparison
- Winner Models (green)
- Mod1(W), Mod2(W), and Mod3(W) trained to predict race winners. Higher score = stronger contender.
- Longshot Models (red)
- Mod1-LS, Mod2-LS, and Mod3-LS trained to find high-value longshots. Higher score = stronger longshot candidate.
- Form Model (blue)
- Mod4 sequence model trained on recent form patterns. Higher score = stronger recent form profile.
- This horse
- Highlighted with a darker column background.
Race Pace Simulation Guide
- Slider
- Drag left→right to advance from gate to finish. Drag all the way back to reset the race.
- Predicted Finish Order
- Factors in contested pace burn, each horse’s effort curve (peaked-early vs. peaked-late), and wide trip cost from outside posts. Updated live when Track Bias changes.
- Pace Scenario
- Lone Speed: single E horse likely rates and holds. Contested: two E horses burn each other — closers benefit. Hot Pace: speed meltdown, deep closers thrive. Soft: no early speed, moderate fractions throughout.
- Track Bias
- Slider below canvas. −2 = strong closer/wet bias; +2 = strong speed/rail bias. Recomputes the predicted finish order.
- Boxed Indicator
- Dashed orange ring = horse is surrounded (rival ahead, rival behind, wall outside). In a real race this horse must find a clear path to run.
- Running Styles
- E/EE = early speed (rushes to rail). P = presser (stalks the pace). S = stalker. SS = slow starter / closer.
| Stat | vs. Current Card | vs. All Horses |
|---|---|---|
| Averages
Career-average metrics across all AI race analysis. Performance and pace averages reflect estimated historical performance; trainer and jockey grades score in-the-money percentages. Grading scale: A = elite • B = above average • C = average • D = below average • F = poor • — = no data |
||
| Pick Pony AI Rating | C | C |
| Pace Trip Longshot | — | — |
| Connections Longshot | — | — |
| Situational Longshot | — | — |
| Speed | D | C |
| Early Pace | D | D |
| Mid Pace | D | D |
| Late Pace | C | B |
| Finish Pos | C | D |
| Dirt Speed | F | C |
| Turf Speed | D | D |
| Distance Speed | C | B |
| Trainer Effectiveness | C | B |
| Jockey Effectiveness | B | B |
| 3rd Party Ratings | C | B |
| Recent
Performance analysis from the horse's recent races, weighted to reflect current form. Sprint and Route FPS (Foot Per Second) measure pace efficiency over the horse's recent sprints and routes respectively. Grading scale: A = elite • B = above average • C = average • D = below average • F = poor • — = no data |
||
| Speed | D | C |
| Early Pace | B | C |
| Mid Pace | A | C |
| Late Pace | F | C |
| Sprint FPS | D | C |
| Route FPS | B | B |
| Trainer Effectiveness | C | B |
| Jockey Effectiveness | B | B |
| 3rd Party Ratings | C | B |
| Predictions
AI-generated projections for the upcoming race, derived from prior AI analysis for speed and pace trends, surface and distance suitability, and current conditions. Grading scale: A = elite • B = above average • C = average • D = below average • F = poor • — = no data |
||
| Speed | A | A |
| Early Pace | C | D |
| Mid Pace | D | C |
| Late Pace | C | C |
Chart Guide (2.0.36)
- Bubbles
- Color = surface: green (turf), brown (dirt), blue (synthetic)
- Top number = finishing position; bottom number in parentheses = starting post position
- Height above line = beaten lengths — closer means a smaller margin
- Border = track conditions: green (FST/GD/FM), yellow (WF/SL/YLD), red (SY/MY/FRZ/SFT/HVY)
- Connecting Line
- Solid = good conditions; dashed = bad conditions
- Line Symbol
- ▲ Triangle = sprint (7f or less); ● Circle = route (more than 7f)
- Days Between Races
- Small number above each bubble (e.g. 19d) = days since the previous race — helps spot freshness, layoffs, and tight scheduling.
- Shaded Band (Bollinger)
- Highlights volatility — a wider band means more variation in recent performance
- Performance Trend
- Straight line showing the overall performance direction — angled up = improving, angled down = declining
- Dashed Reference Line
- AI Opponent = AI analysis class-level par for the race
AI Model History Guide
- Lines
- Each solid line shows this horse’s model score over its last 10 races: blue = Mod1, green = Mod2, amber = Mod3.
- Dashed Lines
- Dashed lines represent the current race’s field average for each model — a score below the dashed line indicates the horse ranked below average in this model’s assessment.
- Higher is Stronger
- All three model scores are 0–100: a higher number means the model rates this horse more favorably among the field.
Mod1(W): 82 (1/8) Mod2(W): 75 (2/8) Mod3(W): 79 (3/8) Mod1-LS: 55 (6/8) Win Prob: 18.4% Value Score: 1.35 ★
Performance vs. Peers Guide
- Bars (per post)
- Blue = avg career performance • Amber = avg last 3 races • Green = last race (improved vs. avg) • Red = last race (declined vs. avg)
- Trend Line
- Angled line above the bars: rising = improving form • falling = declining form.
- Horizontal Line
- Field average — the mean career performance of all horses in this race.
- Color Circles
- Standard post-position colors below each lane — same as the Total Pace chart.
- Border
- Thicker border = this horse’s post position.
Figure Comparison
- Rating
- The three Pick Pony algorithm ratings (Algo 1, Algo 2, Algo 3) that make up the overall PP AI Rating — higher is a stronger contender rating.
- Speed
- Career average speed, recent 3-race average, and last-race speed figure — spot horses in improving or declining form.
- Pace
- Average Early (E1), Mid (E2), and Stretch (LP) pace figures — reveals pace-setters vs. closers vs. all-the-way types.
- This horse
- The horse whose stats card is open is highlighted with a darker column background.
Winning Profiles
- Axes
- X: Win % from last 10 starts — Y: In-the-money % (top-3 finishes) from last 10 starts.
- Quadrants
- Consistent Winners (top-right): high win & ITM — reliable performers.
Place Threats (top-left): boards often but doesn’t win often — good exacta/trifecta angles.
Streaky (bottom-right): wins occasionally, misses the board often — all-or-nothing.
Developing (bottom-left): still finding form — longshot territory. - Reference Lines
- Dashed lines mark field averages. Dots to the right win more; dots higher board more.
- This horse
- Highlighted with a gold border and larger dot.
AI Model Comparison
- Winner Models (green)
- Mod1(W), Mod2(W), and Mod3(W) trained to predict race winners. Higher score = stronger contender.
- Longshot Models (red)
- Mod1-LS, Mod2-LS, and Mod3-LS trained to find high-value longshots. Higher score = stronger longshot candidate.
- Form Model (blue)
- Mod4 sequence model trained on recent form patterns. Higher score = stronger recent form profile.
- This horse
- Highlighted with a darker column background.
Race Pace Simulation Guide
- Slider
- Drag left→right to advance from gate to finish. Drag all the way back to reset the race.
- Predicted Finish Order
- Factors in contested pace burn, each horse’s effort curve (peaked-early vs. peaked-late), and wide trip cost from outside posts. Updated live when Track Bias changes.
- Pace Scenario
- Lone Speed: single E horse likely rates and holds. Contested: two E horses burn each other — closers benefit. Hot Pace: speed meltdown, deep closers thrive. Soft: no early speed, moderate fractions throughout.
- Track Bias
- Slider below canvas. −2 = strong closer/wet bias; +2 = strong speed/rail bias. Recomputes the predicted finish order.
- Boxed Indicator
- Dashed orange ring = horse is surrounded (rival ahead, rival behind, wall outside). In a real race this horse must find a clear path to run.
- Running Styles
- E/EE = early speed (rushes to rail). P = presser (stalks the pace). S = stalker. SS = slow starter / closer.
| Stat | vs. Current Card | vs. All Horses |
|---|---|---|
| Averages
Career-average metrics across all AI race analysis. Performance and pace averages reflect estimated historical performance; trainer and jockey grades score in-the-money percentages. Grading scale: A = elite • B = above average • C = average • D = below average • F = poor • — = no data |
||
| Pick Pony AI Rating | D | D |
| Pace Trip Longshot | — | — |
| Connections Longshot | — | — |
| Situational Longshot | — | — |
| Speed | B | B |
| Early Pace | C | D |
| Mid Pace | B | C |
| Late Pace | B | B |
| Finish Pos | C | C |
| Dirt Speed | C | B |
| Turf Speed | C | C |
| Distance Speed | B | B |
| Trainer Effectiveness | C | D |
| Jockey Effectiveness | D | C |
| 3rd Party Ratings | F | C |
| Recent
Performance analysis from the horse's recent races, weighted to reflect current form. Sprint and Route FPS (Foot Per Second) measure pace efficiency over the horse's recent sprints and routes respectively. Grading scale: A = elite • B = above average • C = average • D = below average • F = poor • — = no data |
||
| Speed | B | B |
| Early Pace | D | D |
| Mid Pace | B | C |
| Late Pace | C | B |
| Sprint FPS | F | D |
| Route FPS | D | C |
| Trainer Effectiveness | C | D |
| Jockey Effectiveness | D | C |
| 3rd Party Ratings | F | C |
| Predictions
AI-generated projections for the upcoming race, derived from prior AI analysis for speed and pace trends, surface and distance suitability, and current conditions. Grading scale: A = elite • B = above average • C = average • D = below average • F = poor • — = no data |
||
| Speed | C | C |
| Early Pace | B | C |
| Mid Pace | A | C |
| Late Pace | C | C |
Chart Guide (2.0.36)
- Bubbles
- Color = surface: green (turf), brown (dirt), blue (synthetic)
- Top number = finishing position; bottom number in parentheses = starting post position
- Height above line = beaten lengths — closer means a smaller margin
- Border = track conditions: green (FST/GD/FM), yellow (WF/SL/YLD), red (SY/MY/FRZ/SFT/HVY)
- Connecting Line
- Solid = good conditions; dashed = bad conditions
- Line Symbol
- ▲ Triangle = sprint (7f or less); ● Circle = route (more than 7f)
- Days Between Races
- Small number above each bubble (e.g. 19d) = days since the previous race — helps spot freshness, layoffs, and tight scheduling.
- Shaded Band (Bollinger)
- Highlights volatility — a wider band means more variation in recent performance
- Performance Trend
- Straight line showing the overall performance direction — angled up = improving, angled down = declining
- Dashed Reference Line
- AI Opponent = AI analysis class-level par for the race
AI Model History Guide
- Lines
- Each solid line shows this horse’s model score over its last 10 races: blue = Mod1, green = Mod2, amber = Mod3.
- Dashed Lines
- Dashed lines represent the current race’s field average for each model — a score below the dashed line indicates the horse ranked below average in this model’s assessment.
- Higher is Stronger
- All three model scores are 0–100: a higher number means the model rates this horse more favorably among the field.
Mod1(W): 82 (1/8) Mod2(W): 75 (2/8) Mod3(W): 79 (3/8) Mod1-LS: 55 (6/8) Win Prob: 18.4% Value Score: 1.35 ★
Performance vs. Peers Guide
- Bars (per post)
- Blue = avg career performance • Amber = avg last 3 races • Green = last race (improved vs. avg) • Red = last race (declined vs. avg)
- Trend Line
- Angled line above the bars: rising = improving form • falling = declining form.
- Horizontal Line
- Field average — the mean career performance of all horses in this race.
- Color Circles
- Standard post-position colors below each lane — same as the Total Pace chart.
- Border
- Thicker border = this horse’s post position.
Figure Comparison
- Rating
- The three Pick Pony algorithm ratings (Algo 1, Algo 2, Algo 3) that make up the overall PP AI Rating — higher is a stronger contender rating.
- Speed
- Career average speed, recent 3-race average, and last-race speed figure — spot horses in improving or declining form.
- Pace
- Average Early (E1), Mid (E2), and Stretch (LP) pace figures — reveals pace-setters vs. closers vs. all-the-way types.
- This horse
- The horse whose stats card is open is highlighted with a darker column background.
Winning Profiles
- Axes
- X: Win % from last 10 starts — Y: In-the-money % (top-3 finishes) from last 10 starts.
- Quadrants
- Consistent Winners (top-right): high win & ITM — reliable performers.
Place Threats (top-left): boards often but doesn’t win often — good exacta/trifecta angles.
Streaky (bottom-right): wins occasionally, misses the board often — all-or-nothing.
Developing (bottom-left): still finding form — longshot territory. - Reference Lines
- Dashed lines mark field averages. Dots to the right win more; dots higher board more.
- This horse
- Highlighted with a gold border and larger dot.
AI Model Comparison
- Winner Models (green)
- Mod1(W), Mod2(W), and Mod3(W) trained to predict race winners. Higher score = stronger contender.
- Longshot Models (red)
- Mod1-LS, Mod2-LS, and Mod3-LS trained to find high-value longshots. Higher score = stronger longshot candidate.
- Form Model (blue)
- Mod4 sequence model trained on recent form patterns. Higher score = stronger recent form profile.
- This horse
- Highlighted with a darker column background.
Race Pace Simulation Guide
- Slider
- Drag left→right to advance from gate to finish. Drag all the way back to reset the race.
- Predicted Finish Order
- Factors in contested pace burn, each horse’s effort curve (peaked-early vs. peaked-late), and wide trip cost from outside posts. Updated live when Track Bias changes.
- Pace Scenario
- Lone Speed: single E horse likely rates and holds. Contested: two E horses burn each other — closers benefit. Hot Pace: speed meltdown, deep closers thrive. Soft: no early speed, moderate fractions throughout.
- Track Bias
- Slider below canvas. −2 = strong closer/wet bias; +2 = strong speed/rail bias. Recomputes the predicted finish order.
- Boxed Indicator
- Dashed orange ring = horse is surrounded (rival ahead, rival behind, wall outside). In a real race this horse must find a clear path to run.
- Running Styles
- E/EE = early speed (rushes to rail). P = presser (stalks the pace). S = stalker. SS = slow starter / closer.
| Stat | vs. Current Card | vs. All Horses |
|---|---|---|
| Averages
Career-average metrics across all AI race analysis. Performance and pace averages reflect estimated historical performance; trainer and jockey grades score in-the-money percentages. Grading scale: A = elite • B = above average • C = average • D = below average • F = poor • — = no data |
||
| Pick Pony AI Rating | A | B |
| Pace Trip Longshot | — | — |
| Connections Longshot | — | — |
| Situational Longshot | — | — |
| Speed | C | C |
| Early Pace | A | A |
| Mid Pace | A | A |
| Late Pace | F | C |
| Finish Pos | F | D |
| Dirt Speed | C | B |
| Turf Speed | C | B |
| Distance Speed | C | C |
| Trainer Effectiveness | B | B |
| Jockey Effectiveness | A | A |
| 3rd Party Ratings | A | A |
| Recent
Performance analysis from the horse's recent races, weighted to reflect current form. Sprint and Route FPS (Foot Per Second) measure pace efficiency over the horse's recent sprints and routes respectively. Grading scale: A = elite • B = above average • C = average • D = below average • F = poor • — = no data |
||
| Speed | C | C |
| Early Pace | A | A |
| Mid Pace | A | A |
| Late Pace | D | C |
| Sprint FPS | A | B |
| Route FPS | A | A |
| Trainer Effectiveness | B | B |
| Jockey Effectiveness | A | A |
| 3rd Party Ratings | A | A |
| Predictions
AI-generated projections for the upcoming race, derived from prior AI analysis for speed and pace trends, surface and distance suitability, and current conditions. Grading scale: A = elite • B = above average • C = average • D = below average • F = poor • — = no data |
||
| Speed | D | C |
| Early Pace | A | A |
| Mid Pace | A | A |
| Late Pace | C | C |
Chart Guide (2.0.36)
- Bubbles
- Color = surface: green (turf), brown (dirt), blue (synthetic)
- Top number = finishing position; bottom number in parentheses = starting post position
- Height above line = beaten lengths — closer means a smaller margin
- Border = track conditions: green (FST/GD/FM), yellow (WF/SL/YLD), red (SY/MY/FRZ/SFT/HVY)
- Connecting Line
- Solid = good conditions; dashed = bad conditions
- Line Symbol
- ▲ Triangle = sprint (7f or less); ● Circle = route (more than 7f)
- Days Between Races
- Small number above each bubble (e.g. 19d) = days since the previous race — helps spot freshness, layoffs, and tight scheduling.
- Shaded Band (Bollinger)
- Highlights volatility — a wider band means more variation in recent performance
- Performance Trend
- Straight line showing the overall performance direction — angled up = improving, angled down = declining
- Dashed Reference Line
- AI Opponent = AI analysis class-level par for the race
AI Model History Guide
- Lines
- Each solid line shows this horse’s model score over its last 10 races: blue = Mod1, green = Mod2, amber = Mod3.
- Dashed Lines
- Dashed lines represent the current race’s field average for each model — a score below the dashed line indicates the horse ranked below average in this model’s assessment.
- Higher is Stronger
- All three model scores are 0–100: a higher number means the model rates this horse more favorably among the field.
Mod1(W): 82 (1/8) Mod2(W): 75 (2/8) Mod3(W): 79 (3/8) Mod1-LS: 55 (6/8) Win Prob: 18.4% Value Score: 1.35 ★
Performance vs. Peers Guide
- Bars (per post)
- Blue = avg career performance • Amber = avg last 3 races • Green = last race (improved vs. avg) • Red = last race (declined vs. avg)
- Trend Line
- Angled line above the bars: rising = improving form • falling = declining form.
- Horizontal Line
- Field average — the mean career performance of all horses in this race.
- Color Circles
- Standard post-position colors below each lane — same as the Total Pace chart.
- Border
- Thicker border = this horse’s post position.
Figure Comparison
- Rating
- The three Pick Pony algorithm ratings (Algo 1, Algo 2, Algo 3) that make up the overall PP AI Rating — higher is a stronger contender rating.
- Speed
- Career average speed, recent 3-race average, and last-race speed figure — spot horses in improving or declining form.
- Pace
- Average Early (E1), Mid (E2), and Stretch (LP) pace figures — reveals pace-setters vs. closers vs. all-the-way types.
- This horse
- The horse whose stats card is open is highlighted with a darker column background.
Winning Profiles
- Axes
- X: Win % from last 10 starts — Y: In-the-money % (top-3 finishes) from last 10 starts.
- Quadrants
- Consistent Winners (top-right): high win & ITM — reliable performers.
Place Threats (top-left): boards often but doesn’t win often — good exacta/trifecta angles.
Streaky (bottom-right): wins occasionally, misses the board often — all-or-nothing.
Developing (bottom-left): still finding form — longshot territory. - Reference Lines
- Dashed lines mark field averages. Dots to the right win more; dots higher board more.
- This horse
- Highlighted with a gold border and larger dot.
AI Model Comparison
- Winner Models (green)
- Mod1(W), Mod2(W), and Mod3(W) trained to predict race winners. Higher score = stronger contender.
- Longshot Models (red)
- Mod1-LS, Mod2-LS, and Mod3-LS trained to find high-value longshots. Higher score = stronger longshot candidate.
- Form Model (blue)
- Mod4 sequence model trained on recent form patterns. Higher score = stronger recent form profile.
- This horse
- Highlighted with a darker column background.
Race Pace Simulation Guide
- Slider
- Drag left→right to advance from gate to finish. Drag all the way back to reset the race.
- Predicted Finish Order
- Factors in contested pace burn, each horse’s effort curve (peaked-early vs. peaked-late), and wide trip cost from outside posts. Updated live when Track Bias changes.
- Pace Scenario
- Lone Speed: single E horse likely rates and holds. Contested: two E horses burn each other — closers benefit. Hot Pace: speed meltdown, deep closers thrive. Soft: no early speed, moderate fractions throughout.
- Track Bias
- Slider below canvas. −2 = strong closer/wet bias; +2 = strong speed/rail bias. Recomputes the predicted finish order.
- Boxed Indicator
- Dashed orange ring = horse is surrounded (rival ahead, rival behind, wall outside). In a real race this horse must find a clear path to run.
- Running Styles
- E/EE = early speed (rushes to rail). P = presser (stalks the pace). S = stalker. SS = slow starter / closer.
| Stat | vs. Current Card | vs. All Horses |
|---|---|---|
| Averages
Career-average metrics across all AI race analysis. Performance and pace averages reflect estimated historical performance; trainer and jockey grades score in-the-money percentages. Grading scale: A = elite • B = above average • C = average • D = below average • F = poor • — = no data |
||
| Pick Pony AI Rating | A | B |
| Pace Trip Longshot | — | — |
| Connections Longshot | — | — |
| Situational Longshot | — | — |
| Speed | A | B |
| Early Pace | C | D |
| Mid Pace | C | C |
| Late Pace | C | B |
| Finish Pos | D | D |
| Dirt Speed | A | A |
| Turf Speed | A | A |
| Distance Speed | A | A |
| Trainer Effectiveness | A | A |
| Jockey Effectiveness | C | C |
| 3rd Party Ratings | C | B |
| Recent
Performance analysis from the horse's recent races, weighted to reflect current form. Sprint and Route FPS (Foot Per Second) measure pace efficiency over the horse's recent sprints and routes respectively. Grading scale: A = elite • B = above average • C = average • D = below average • F = poor • — = no data |
||
| Speed | A | B |
| Early Pace | C | D |
| Mid Pace | C | C |
| Late Pace | A | A |
| Sprint FPS | B | C |
| Route FPS | C | C |
| Trainer Effectiveness | A | A |
| Jockey Effectiveness | C | C |
| 3rd Party Ratings | C | B |
| Predictions
AI-generated projections for the upcoming race, derived from prior AI analysis for speed and pace trends, surface and distance suitability, and current conditions. Grading scale: A = elite • B = above average • C = average • D = below average • F = poor • — = no data |
||
| Speed | A | B |
| Early Pace | F | D |
| Mid Pace | C | C |
| Late Pace | C | C |
Chart Guide (2.0.36)
- Bubbles
- Color = surface: green (turf), brown (dirt), blue (synthetic)
- Top number = finishing position; bottom number in parentheses = starting post position
- Height above line = beaten lengths — closer means a smaller margin
- Border = track conditions: green (FST/GD/FM), yellow (WF/SL/YLD), red (SY/MY/FRZ/SFT/HVY)
- Connecting Line
- Solid = good conditions; dashed = bad conditions
- Line Symbol
- ▲ Triangle = sprint (7f or less); ● Circle = route (more than 7f)
- Days Between Races
- Small number above each bubble (e.g. 19d) = days since the previous race — helps spot freshness, layoffs, and tight scheduling.
- Shaded Band (Bollinger)
- Highlights volatility — a wider band means more variation in recent performance
- Performance Trend
- Straight line showing the overall performance direction — angled up = improving, angled down = declining
- Dashed Reference Line
- AI Opponent = AI analysis class-level par for the race
AI Model History Guide
- Lines
- Each solid line shows this horse’s model score over its last 10 races: blue = Mod1, green = Mod2, amber = Mod3.
- Dashed Lines
- Dashed lines represent the current race’s field average for each model — a score below the dashed line indicates the horse ranked below average in this model’s assessment.
- Higher is Stronger
- All three model scores are 0–100: a higher number means the model rates this horse more favorably among the field.
Mod1(W): 82 (1/8) Mod2(W): 75 (2/8) Mod3(W): 79 (3/8) Mod1-LS: 55 (6/8) Win Prob: 18.4% Value Score: 1.35 ★
Performance vs. Peers Guide
- Bars (per post)
- Blue = avg career performance • Amber = avg last 3 races • Green = last race (improved vs. avg) • Red = last race (declined vs. avg)
- Trend Line
- Angled line above the bars: rising = improving form • falling = declining form.
- Horizontal Line
- Field average — the mean career performance of all horses in this race.
- Color Circles
- Standard post-position colors below each lane — same as the Total Pace chart.
- Border
- Thicker border = this horse’s post position.
Figure Comparison
- Rating
- The three Pick Pony algorithm ratings (Algo 1, Algo 2, Algo 3) that make up the overall PP AI Rating — higher is a stronger contender rating.
- Speed
- Career average speed, recent 3-race average, and last-race speed figure — spot horses in improving or declining form.
- Pace
- Average Early (E1), Mid (E2), and Stretch (LP) pace figures — reveals pace-setters vs. closers vs. all-the-way types.
- This horse
- The horse whose stats card is open is highlighted with a darker column background.
Winning Profiles
- Axes
- X: Win % from last 10 starts — Y: In-the-money % (top-3 finishes) from last 10 starts.
- Quadrants
- Consistent Winners (top-right): high win & ITM — reliable performers.
Place Threats (top-left): boards often but doesn’t win often — good exacta/trifecta angles.
Streaky (bottom-right): wins occasionally, misses the board often — all-or-nothing.
Developing (bottom-left): still finding form — longshot territory. - Reference Lines
- Dashed lines mark field averages. Dots to the right win more; dots higher board more.
- This horse
- Highlighted with a gold border and larger dot.
AI Model Comparison
- Winner Models (green)
- Mod1(W), Mod2(W), and Mod3(W) trained to predict race winners. Higher score = stronger contender.
- Longshot Models (red)
- Mod1-LS, Mod2-LS, and Mod3-LS trained to find high-value longshots. Higher score = stronger longshot candidate.
- Form Model (blue)
- Mod4 sequence model trained on recent form patterns. Higher score = stronger recent form profile.
- This horse
- Highlighted with a darker column background.
Race Pace Simulation Guide
- Slider
- Drag left→right to advance from gate to finish. Drag all the way back to reset the race.
- Predicted Finish Order
- Factors in contested pace burn, each horse’s effort curve (peaked-early vs. peaked-late), and wide trip cost from outside posts. Updated live when Track Bias changes.
- Pace Scenario
- Lone Speed: single E horse likely rates and holds. Contested: two E horses burn each other — closers benefit. Hot Pace: speed meltdown, deep closers thrive. Soft: no early speed, moderate fractions throughout.
- Track Bias
- Slider below canvas. −2 = strong closer/wet bias; +2 = strong speed/rail bias. Recomputes the predicted finish order.
- Boxed Indicator
- Dashed orange ring = horse is surrounded (rival ahead, rival behind, wall outside). In a real race this horse must find a clear path to run.
- Running Styles
- E/EE = early speed (rushes to rail). P = presser (stalks the pace). S = stalker. SS = slow starter / closer.
| Stat | vs. Current Card | vs. All Horses |
|---|---|---|
| Averages
Career-average metrics across all AI race analysis. Performance and pace averages reflect estimated historical performance; trainer and jockey grades score in-the-money percentages. Grading scale: A = elite • B = above average • C = average • D = below average • F = poor • — = no data |
||
| Pick Pony AI Rating | C | C |
| Pace Trip Longshot | — | — |
| Connections Longshot | — | — |
| Situational Longshot | — | — |
| Speed | F | C |
| Early Pace | F | D |
| Mid Pace | F | D |
| Late Pace | A | A |
| Finish Pos | A | C |
| Dirt Speed | B | B |
| Turf Speed | A | A |
| Distance Speed | A | B |
| Trainer Effectiveness | D | D |
| Jockey Effectiveness | C | B |
| 3rd Party Ratings | B | B |
| Recent
Performance analysis from the horse's recent races, weighted to reflect current form. Sprint and Route FPS (Foot Per Second) measure pace efficiency over the horse's recent sprints and routes respectively. Grading scale: A = elite • B = above average • C = average • D = below average • F = poor • — = no data |
||
| Speed | C | C |
| Early Pace | F | D |
| Mid Pace | F | D |
| Late Pace | B | B |
| Sprint FPS | C | C |
| Route FPS | C | C |
| Trainer Effectiveness | D | D |
| Jockey Effectiveness | C | B |
| 3rd Party Ratings | B | B |
| Predictions
AI-generated projections for the upcoming race, derived from prior AI analysis for speed and pace trends, surface and distance suitability, and current conditions. Grading scale: A = elite • B = above average • C = average • D = below average • F = poor • — = no data |
||
| Speed | F | C |
| Early Pace | D | D |
| Mid Pace | F | C |
| Late Pace | C | C |
Chart Guide (2.0.36)
- Bubbles
- Color = surface: green (turf), brown (dirt), blue (synthetic)
- Top number = finishing position; bottom number in parentheses = starting post position
- Height above line = beaten lengths — closer means a smaller margin
- Border = track conditions: green (FST/GD/FM), yellow (WF/SL/YLD), red (SY/MY/FRZ/SFT/HVY)
- Connecting Line
- Solid = good conditions; dashed = bad conditions
- Line Symbol
- ▲ Triangle = sprint (7f or less); ● Circle = route (more than 7f)
- Days Between Races
- Small number above each bubble (e.g. 19d) = days since the previous race — helps spot freshness, layoffs, and tight scheduling.
- Shaded Band (Bollinger)
- Highlights volatility — a wider band means more variation in recent performance
- Performance Trend
- Straight line showing the overall performance direction — angled up = improving, angled down = declining
- Dashed Reference Line
- AI Opponent = AI analysis class-level par for the race
AI Model History Guide
- Lines
- Each solid line shows this horse’s model score over its last 10 races: blue = Mod1, green = Mod2, amber = Mod3.
- Dashed Lines
- Dashed lines represent the current race’s field average for each model — a score below the dashed line indicates the horse ranked below average in this model’s assessment.
- Higher is Stronger
- All three model scores are 0–100: a higher number means the model rates this horse more favorably among the field.
Mod1(W): 82 (1/8) Mod2(W): 75 (2/8) Mod3(W): 79 (3/8) Mod1-LS: 55 (6/8) Win Prob: 18.4% Value Score: 1.35 ★
Performance vs. Peers Guide
- Bars (per post)
- Blue = avg career performance • Amber = avg last 3 races • Green = last race (improved vs. avg) • Red = last race (declined vs. avg)
- Trend Line
- Angled line above the bars: rising = improving form • falling = declining form.
- Horizontal Line
- Field average — the mean career performance of all horses in this race.
- Color Circles
- Standard post-position colors below each lane — same as the Total Pace chart.
- Border
- Thicker border = this horse’s post position.
Figure Comparison
- Rating
- The three Pick Pony algorithm ratings (Algo 1, Algo 2, Algo 3) that make up the overall PP AI Rating — higher is a stronger contender rating.
- Speed
- Career average speed, recent 3-race average, and last-race speed figure — spot horses in improving or declining form.
- Pace
- Average Early (E1), Mid (E2), and Stretch (LP) pace figures — reveals pace-setters vs. closers vs. all-the-way types.
- This horse
- The horse whose stats card is open is highlighted with a darker column background.
Winning Profiles
- Axes
- X: Win % from last 10 starts — Y: In-the-money % (top-3 finishes) from last 10 starts.
- Quadrants
- Consistent Winners (top-right): high win & ITM — reliable performers.
Place Threats (top-left): boards often but doesn’t win often — good exacta/trifecta angles.
Streaky (bottom-right): wins occasionally, misses the board often — all-or-nothing.
Developing (bottom-left): still finding form — longshot territory. - Reference Lines
- Dashed lines mark field averages. Dots to the right win more; dots higher board more.
- This horse
- Highlighted with a gold border and larger dot.
AI Model Comparison
- Winner Models (green)
- Mod1(W), Mod2(W), and Mod3(W) trained to predict race winners. Higher score = stronger contender.
- Longshot Models (red)
- Mod1-LS, Mod2-LS, and Mod3-LS trained to find high-value longshots. Higher score = stronger longshot candidate.
- Form Model (blue)
- Mod4 sequence model trained on recent form patterns. Higher score = stronger recent form profile.
- This horse
- Highlighted with a darker column background.
Race Pace Simulation Guide
- Slider
- Drag left→right to advance from gate to finish. Drag all the way back to reset the race.
- Predicted Finish Order
- Factors in contested pace burn, each horse’s effort curve (peaked-early vs. peaked-late), and wide trip cost from outside posts. Updated live when Track Bias changes.
- Pace Scenario
- Lone Speed: single E horse likely rates and holds. Contested: two E horses burn each other — closers benefit. Hot Pace: speed meltdown, deep closers thrive. Soft: no early speed, moderate fractions throughout.
- Track Bias
- Slider below canvas. −2 = strong closer/wet bias; +2 = strong speed/rail bias. Recomputes the predicted finish order.
- Boxed Indicator
- Dashed orange ring = horse is surrounded (rival ahead, rival behind, wall outside). In a real race this horse must find a clear path to run.
- Running Styles
- E/EE = early speed (rushes to rail). P = presser (stalks the pace). S = stalker. SS = slow starter / closer.
| Stat | vs. Current Card | vs. All Horses |
|---|---|---|
| Averages
Career-average metrics across all AI race analysis. Performance and pace averages reflect estimated historical performance; trainer and jockey grades score in-the-money percentages. Grading scale: A = elite • B = above average • C = average • D = below average • F = poor • — = no data |
||
| Pick Pony AI Rating | A | B |
| Pace Trip Longshot | — | — |
| Connections Longshot | — | — |
| Situational Longshot | — | — |
| Speed | A | C |
| Early Pace | A | C |
| Mid Pace | A | B |
| Late Pace | B | C |
| Finish Pos | A | B |
| Dirt Speed | B | B |
| Turf Speed | D | C |
| Distance Speed | A | B |
| Trainer Effectiveness | B | C |
| Jockey Effectiveness | A | B |
| 3rd Party Ratings | A | B |
| Recent
Performance analysis from the horse's recent races, weighted to reflect current form. Sprint and Route FPS (Foot Per Second) measure pace efficiency over the horse's recent sprints and routes respectively. Grading scale: A = elite • B = above average • C = average • D = below average • F = poor • — = no data |
||
| Speed | B | C |
| Early Pace | B | D |
| Mid Pace | B | C |
| Late Pace | B | C |
| Sprint FPS | C | C |
| Route FPS | B | C |
| Trainer Effectiveness | B | C |
| Jockey Effectiveness | A | B |
| 3rd Party Ratings | A | B |
| Predictions
AI-generated projections for the upcoming race, derived from prior AI analysis for speed and pace trends, surface and distance suitability, and current conditions. Grading scale: A = elite • B = above average • C = average • D = below average • F = poor • — = no data |
||
| Speed | A | C |
| Early Pace | A | C |
| Mid Pace | A | B |
| Late Pace | C | C |
Chart Guide (2.0.36)
- Bubbles
- Color = surface: green (turf), brown (dirt), blue (synthetic)
- Top number = finishing position; bottom number in parentheses = starting post position
- Height above line = beaten lengths — closer means a smaller margin
- Border = track conditions: green (FST/GD/FM), yellow (WF/SL/YLD), red (SY/MY/FRZ/SFT/HVY)
- Connecting Line
- Solid = good conditions; dashed = bad conditions
- Line Symbol
- ▲ Triangle = sprint (7f or less); ● Circle = route (more than 7f)
- Days Between Races
- Small number above each bubble (e.g. 19d) = days since the previous race — helps spot freshness, layoffs, and tight scheduling.
- Shaded Band (Bollinger)
- Highlights volatility — a wider band means more variation in recent performance
- Performance Trend
- Straight line showing the overall performance direction — angled up = improving, angled down = declining
- Dashed Reference Line
- AI Opponent = AI analysis class-level par for the race
AI Model History Guide
- Lines
- Each solid line shows this horse’s model score over its last 10 races: blue = Mod1, green = Mod2, amber = Mod3.
- Dashed Lines
- Dashed lines represent the current race’s field average for each model — a score below the dashed line indicates the horse ranked below average in this model’s assessment.
- Higher is Stronger
- All three model scores are 0–100: a higher number means the model rates this horse more favorably among the field.
Mod1(W): 82 (1/8) Mod2(W): 75 (2/8) Mod3(W): 79 (3/8) Mod1-LS: 55 (6/8) Win Prob: 18.4% Value Score: 1.35 ★
Performance vs. Peers Guide
- Bars (per post)
- Blue = avg career performance • Amber = avg last 3 races • Green = last race (improved vs. avg) • Red = last race (declined vs. avg)
- Trend Line
- Angled line above the bars: rising = improving form • falling = declining form.
- Horizontal Line
- Field average — the mean career performance of all horses in this race.
- Color Circles
- Standard post-position colors below each lane — same as the Total Pace chart.
- Border
- Thicker border = this horse’s post position.
Figure Comparison
- Rating
- The three Pick Pony algorithm ratings (Algo 1, Algo 2, Algo 3) that make up the overall PP AI Rating — higher is a stronger contender rating.
- Speed
- Career average speed, recent 3-race average, and last-race speed figure — spot horses in improving or declining form.
- Pace
- Average Early (E1), Mid (E2), and Stretch (LP) pace figures — reveals pace-setters vs. closers vs. all-the-way types.
- This horse
- The horse whose stats card is open is highlighted with a darker column background.
Winning Profiles
- Axes
- X: Win % from last 10 starts — Y: In-the-money % (top-3 finishes) from last 10 starts.
- Quadrants
- Consistent Winners (top-right): high win & ITM — reliable performers.
Place Threats (top-left): boards often but doesn’t win often — good exacta/trifecta angles.
Streaky (bottom-right): wins occasionally, misses the board often — all-or-nothing.
Developing (bottom-left): still finding form — longshot territory. - Reference Lines
- Dashed lines mark field averages. Dots to the right win more; dots higher board more.
- This horse
- Highlighted with a gold border and larger dot.
AI Model Comparison
- Winner Models (green)
- Mod1(W), Mod2(W), and Mod3(W) trained to predict race winners. Higher score = stronger contender.
- Longshot Models (red)
- Mod1-LS, Mod2-LS, and Mod3-LS trained to find high-value longshots. Higher score = stronger longshot candidate.
- Form Model (blue)
- Mod4 sequence model trained on recent form patterns. Higher score = stronger recent form profile.
- This horse
- Highlighted with a darker column background.
Race Pace Simulation Guide
- Slider
- Drag left→right to advance from gate to finish. Drag all the way back to reset the race.
- Predicted Finish Order
- Factors in contested pace burn, each horse’s effort curve (peaked-early vs. peaked-late), and wide trip cost from outside posts. Updated live when Track Bias changes.
- Pace Scenario
- Lone Speed: single E horse likely rates and holds. Contested: two E horses burn each other — closers benefit. Hot Pace: speed meltdown, deep closers thrive. Soft: no early speed, moderate fractions throughout.
- Track Bias
- Slider below canvas. −2 = strong closer/wet bias; +2 = strong speed/rail bias. Recomputes the predicted finish order.
- Boxed Indicator
- Dashed orange ring = horse is surrounded (rival ahead, rival behind, wall outside). In a real race this horse must find a clear path to run.
- Running Styles
- E/EE = early speed (rushes to rail). P = presser (stalks the pace). S = stalker. SS = slow starter / closer.
| Stat | vs. Current Card | vs. All Horses |
|---|---|---|
| Averages
Career-average metrics across all AI race analysis. Performance and pace averages reflect estimated historical performance; trainer and jockey grades score in-the-money percentages. Grading scale: A = elite • B = above average • C = average • D = below average • F = poor • — = no data |
||
| Pick Pony AI Rating | A | B |
| Pace Trip Longshot | — | — |
| Connections Longshot | — | — |
| Situational Longshot | — | — |
| Speed | B | C |
| Early Pace | F | D |
| Mid Pace | D | D |
| Late Pace | A | B |
| Finish Pos | B | C |
| Dirt Speed | A | B |
| Turf Speed | A | A |
| Distance Speed | A | A |
| Trainer Effectiveness | A | C |
| Jockey Effectiveness | A | B |
| 3rd Party Ratings | B | C |
| Recent
Performance analysis from the horse's recent races, weighted to reflect current form. Sprint and Route FPS (Foot Per Second) measure pace efficiency over the horse's recent sprints and routes respectively. Grading scale: A = elite • B = above average • C = average • D = below average • F = poor • — = no data |
||
| Speed | C | C |
| Early Pace | C | D |
| Mid Pace | C | C |
| Late Pace | A | B |
| Sprint FPS | B | C |
| Route FPS | D | D |
| Trainer Effectiveness | A | C |
| Jockey Effectiveness | A | B |
| 3rd Party Ratings | B | C |
| Predictions
AI-generated projections for the upcoming race, derived from prior AI analysis for speed and pace trends, surface and distance suitability, and current conditions. Grading scale: A = elite • B = above average • C = average • D = below average • F = poor • — = no data |
||
| Speed | B | C |
| Early Pace | D | D |
| Mid Pace | C | C |
| Late Pace | C | C |
Chart Guide (2.0.36)
- Bubbles
- Color = surface: green (turf), brown (dirt), blue (synthetic)
- Top number = finishing position; bottom number in parentheses = starting post position
- Height above line = beaten lengths — closer means a smaller margin
- Border = track conditions: green (FST/GD/FM), yellow (WF/SL/YLD), red (SY/MY/FRZ/SFT/HVY)
- Connecting Line
- Solid = good conditions; dashed = bad conditions
- Line Symbol
- ▲ Triangle = sprint (7f or less); ● Circle = route (more than 7f)
- Days Between Races
- Small number above each bubble (e.g. 19d) = days since the previous race — helps spot freshness, layoffs, and tight scheduling.
- Shaded Band (Bollinger)
- Highlights volatility — a wider band means more variation in recent performance
- Performance Trend
- Straight line showing the overall performance direction — angled up = improving, angled down = declining
- Dashed Reference Line
- AI Opponent = AI analysis class-level par for the race
AI Model History Guide
- Lines
- Each solid line shows this horse’s model score over its last 10 races: blue = Mod1, green = Mod2, amber = Mod3.
- Dashed Lines
- Dashed lines represent the current race’s field average for each model — a score below the dashed line indicates the horse ranked below average in this model’s assessment.
- Higher is Stronger
- All three model scores are 0–100: a higher number means the model rates this horse more favorably among the field.
Mod1(W): 82 (1/8) Mod2(W): 75 (2/8) Mod3(W): 79 (3/8) Mod1-LS: 55 (6/8) Win Prob: 18.4% Value Score: 1.35 ★
Performance vs. Peers Guide
- Bars (per post)
- Blue = avg career performance • Amber = avg last 3 races • Green = last race (improved vs. avg) • Red = last race (declined vs. avg)
- Trend Line
- Angled line above the bars: rising = improving form • falling = declining form.
- Horizontal Line
- Field average — the mean career performance of all horses in this race.
- Color Circles
- Standard post-position colors below each lane — same as the Total Pace chart.
- Border
- Thicker border = this horse’s post position.
Figure Comparison
- Rating
- The three Pick Pony algorithm ratings (Algo 1, Algo 2, Algo 3) that make up the overall PP AI Rating — higher is a stronger contender rating.
- Speed
- Career average speed, recent 3-race average, and last-race speed figure — spot horses in improving or declining form.
- Pace
- Average Early (E1), Mid (E2), and Stretch (LP) pace figures — reveals pace-setters vs. closers vs. all-the-way types.
- This horse
- The horse whose stats card is open is highlighted with a darker column background.
Winning Profiles
- Axes
- X: Win % from last 10 starts — Y: In-the-money % (top-3 finishes) from last 10 starts.
- Quadrants
- Consistent Winners (top-right): high win & ITM — reliable performers.
Place Threats (top-left): boards often but doesn’t win often — good exacta/trifecta angles.
Streaky (bottom-right): wins occasionally, misses the board often — all-or-nothing.
Developing (bottom-left): still finding form — longshot territory. - Reference Lines
- Dashed lines mark field averages. Dots to the right win more; dots higher board more.
- This horse
- Highlighted with a gold border and larger dot.
AI Model Comparison
- Winner Models (green)
- Mod1(W), Mod2(W), and Mod3(W) trained to predict race winners. Higher score = stronger contender.
- Longshot Models (red)
- Mod1-LS, Mod2-LS, and Mod3-LS trained to find high-value longshots. Higher score = stronger longshot candidate.
- Form Model (blue)
- Mod4 sequence model trained on recent form patterns. Higher score = stronger recent form profile.
- This horse
- Highlighted with a darker column background.
Race Pace Simulation Guide
- Slider
- Drag left→right to advance from gate to finish. Drag all the way back to reset the race.
- Predicted Finish Order
- Factors in contested pace burn, each horse’s effort curve (peaked-early vs. peaked-late), and wide trip cost from outside posts. Updated live when Track Bias changes.
- Pace Scenario
- Lone Speed: single E horse likely rates and holds. Contested: two E horses burn each other — closers benefit. Hot Pace: speed meltdown, deep closers thrive. Soft: no early speed, moderate fractions throughout.
- Track Bias
- Slider below canvas. −2 = strong closer/wet bias; +2 = strong speed/rail bias. Recomputes the predicted finish order.
- Boxed Indicator
- Dashed orange ring = horse is surrounded (rival ahead, rival behind, wall outside). In a real race this horse must find a clear path to run.
- Running Styles
- E/EE = early speed (rushes to rail). P = presser (stalks the pace). S = stalker. SS = slow starter / closer.
| Stat | vs. Current Card | vs. All Horses |
|---|---|---|
| Averages
Career-average metrics across all AI race analysis. Performance and pace averages reflect estimated historical performance; trainer and jockey grades score in-the-money percentages. Grading scale: A = elite • B = above average • C = average • D = below average • F = poor • — = no data |
||
| Pick Pony AI Rating | C | C |
| Pace Trip Longshot | — | — |
| Connections Longshot | — | — |
| Situational Longshot | — | — |
| Speed | A | B |
| Early Pace | C | D |
| Mid Pace | A | C |
| Late Pace | A | A |
| Finish Pos | A | B |
| Dirt Speed | A | B |
| Turf Speed | F | D |
| Distance Speed | F | F |
| Trainer Effectiveness | B | D |
| Jockey Effectiveness | B | C |
| 3rd Party Ratings | A | B |
| Recent
Performance analysis from the horse's recent races, weighted to reflect current form. Sprint and Route FPS (Foot Per Second) measure pace efficiency over the horse's recent sprints and routes respectively. Grading scale: A = elite • B = above average • C = average • D = below average • F = poor • — = no data |
||
| Speed | A | B |
| Early Pace | D | D |
| Mid Pace | B | C |
| Late Pace | A | A |
| Sprint FPS | F | D |
| Route FPS | C | D |
| Trainer Effectiveness | B | D |
| Jockey Effectiveness | B | C |
| 3rd Party Ratings | A | B |
| Predictions
AI-generated projections for the upcoming race, derived from prior AI analysis for speed and pace trends, surface and distance suitability, and current conditions. Grading scale: A = elite • B = above average • C = average • D = below average • F = poor • — = no data |
||
| Speed | A | B |
| Early Pace | C | D |
| Mid Pace | A | C |
| Late Pace | C | C |
Chart Guide (2.0.36)
- Bubbles
- Color = surface: green (turf), brown (dirt), blue (synthetic)
- Top number = finishing position; bottom number in parentheses = starting post position
- Height above line = beaten lengths — closer means a smaller margin
- Border = track conditions: green (FST/GD/FM), yellow (WF/SL/YLD), red (SY/MY/FRZ/SFT/HVY)
- Connecting Line
- Solid = good conditions; dashed = bad conditions
- Line Symbol
- ▲ Triangle = sprint (7f or less); ● Circle = route (more than 7f)
- Days Between Races
- Small number above each bubble (e.g. 19d) = days since the previous race — helps spot freshness, layoffs, and tight scheduling.
- Shaded Band (Bollinger)
- Highlights volatility — a wider band means more variation in recent performance
- Performance Trend
- Straight line showing the overall performance direction — angled up = improving, angled down = declining
- Dashed Reference Line
- AI Opponent = AI analysis class-level par for the race
AI Model History Guide
- Lines
- Each solid line shows this horse’s model score over its last 10 races: blue = Mod1, green = Mod2, amber = Mod3.
- Dashed Lines
- Dashed lines represent the current race’s field average for each model — a score below the dashed line indicates the horse ranked below average in this model’s assessment.
- Higher is Stronger
- All three model scores are 0–100: a higher number means the model rates this horse more favorably among the field.
Mod1(W): 82 (1/8) Mod2(W): 75 (2/8) Mod3(W): 79 (3/8) Mod1-LS: 55 (6/8) Win Prob: 18.4% Value Score: 1.35 ★
Performance vs. Peers Guide
- Bars (per post)
- Blue = avg career performance • Amber = avg last 3 races • Green = last race (improved vs. avg) • Red = last race (declined vs. avg)
- Trend Line
- Angled line above the bars: rising = improving form • falling = declining form.
- Horizontal Line
- Field average — the mean career performance of all horses in this race.
- Color Circles
- Standard post-position colors below each lane — same as the Total Pace chart.
- Border
- Thicker border = this horse’s post position.
Figure Comparison
- Rating
- The three Pick Pony algorithm ratings (Algo 1, Algo 2, Algo 3) that make up the overall PP AI Rating — higher is a stronger contender rating.
- Speed
- Career average speed, recent 3-race average, and last-race speed figure — spot horses in improving or declining form.
- Pace
- Average Early (E1), Mid (E2), and Stretch (LP) pace figures — reveals pace-setters vs. closers vs. all-the-way types.
- This horse
- The horse whose stats card is open is highlighted with a darker column background.
Winning Profiles
- Axes
- X: Win % from last 10 starts — Y: In-the-money % (top-3 finishes) from last 10 starts.
- Quadrants
- Consistent Winners (top-right): high win & ITM — reliable performers.
Place Threats (top-left): boards often but doesn’t win often — good exacta/trifecta angles.
Streaky (bottom-right): wins occasionally, misses the board often — all-or-nothing.
Developing (bottom-left): still finding form — longshot territory. - Reference Lines
- Dashed lines mark field averages. Dots to the right win more; dots higher board more.
- This horse
- Highlighted with a gold border and larger dot.
AI Model Comparison
- Winner Models (green)
- Mod1(W), Mod2(W), and Mod3(W) trained to predict race winners. Higher score = stronger contender.
- Longshot Models (red)
- Mod1-LS, Mod2-LS, and Mod3-LS trained to find high-value longshots. Higher score = stronger longshot candidate.
- Form Model (blue)
- Mod4 sequence model trained on recent form patterns. Higher score = stronger recent form profile.
- This horse
- Highlighted with a darker column background.
Race Pace Simulation Guide
- Slider
- Drag left→right to advance from gate to finish. Drag all the way back to reset the race.
- Predicted Finish Order
- Factors in contested pace burn, each horse’s effort curve (peaked-early vs. peaked-late), and wide trip cost from outside posts. Updated live when Track Bias changes.
- Pace Scenario
- Lone Speed: single E horse likely rates and holds. Contested: two E horses burn each other — closers benefit. Hot Pace: speed meltdown, deep closers thrive. Soft: no early speed, moderate fractions throughout.
- Track Bias
- Slider below canvas. −2 = strong closer/wet bias; +2 = strong speed/rail bias. Recomputes the predicted finish order.
- Boxed Indicator
- Dashed orange ring = horse is surrounded (rival ahead, rival behind, wall outside). In a real race this horse must find a clear path to run.
- Running Styles
- E/EE = early speed (rushes to rail). P = presser (stalks the pace). S = stalker. SS = slow starter / closer.
| Stat | vs. Current Card | vs. All Horses |
|---|---|---|
| Averages
Career-average metrics across all AI race analysis. Performance and pace averages reflect estimated historical performance; trainer and jockey grades score in-the-money percentages. Grading scale: A = elite • B = above average • C = average • D = below average • F = poor • — = no data |
||
| Pick Pony AI Rating | B | B |
| Pace Trip Longshot | — | — |
| Connections Longshot | — | — |
| Situational Longshot | — | — |
| Speed | C | C |
| Early Pace | B | C |
| Mid Pace | C | C |
| Late Pace | C | C |
| Finish Pos | C | D |
| Dirt Speed | A | B |
| Turf Speed | B | C |
| Distance Speed | D | B |
| Trainer Effectiveness | A | C |
| Jockey Effectiveness | F | F |
| 3rd Party Ratings | C | C |
| Recent
Performance analysis from the horse's recent races, weighted to reflect current form. Sprint and Route FPS (Foot Per Second) measure pace efficiency over the horse's recent sprints and routes respectively. Grading scale: A = elite • B = above average • C = average • D = below average • F = poor • — = no data |
||
| Speed | A | C |
| Early Pace | A | B |
| Mid Pace | A | B |
| Late Pace | C | C |
| Sprint FPS | A | A |
| Route FPS | A | A |
| Trainer Effectiveness | A | C |
| Jockey Effectiveness | F | F |
| 3rd Party Ratings | C | C |
| Predictions
AI-generated projections for the upcoming race, derived from prior AI analysis for speed and pace trends, surface and distance suitability, and current conditions. Grading scale: A = elite • B = above average • C = average • D = below average • F = poor • — = no data |
||
| Speed | B | C |
| Early Pace | B | C |
| Mid Pace | C | C |
| Late Pace | C | C |
Chart Guide (2.0.36)
- Bubbles
- Color = surface: green (turf), brown (dirt), blue (synthetic)
- Top number = finishing position; bottom number in parentheses = starting post position
- Height above line = beaten lengths — closer means a smaller margin
- Border = track conditions: green (FST/GD/FM), yellow (WF/SL/YLD), red (SY/MY/FRZ/SFT/HVY)
- Connecting Line
- Solid = good conditions; dashed = bad conditions
- Line Symbol
- ▲ Triangle = sprint (7f or less); ● Circle = route (more than 7f)
- Days Between Races
- Small number above each bubble (e.g. 19d) = days since the previous race — helps spot freshness, layoffs, and tight scheduling.
- Shaded Band (Bollinger)
- Highlights volatility — a wider band means more variation in recent performance
- Performance Trend
- Straight line showing the overall performance direction — angled up = improving, angled down = declining
- Dashed Reference Line
- AI Opponent = AI analysis class-level par for the race
AI Model History Guide
- Lines
- Each solid line shows this horse’s model score over its last 10 races: blue = Mod1, green = Mod2, amber = Mod3.
- Dashed Lines
- Dashed lines represent the current race’s field average for each model — a score below the dashed line indicates the horse ranked below average in this model’s assessment.
- Higher is Stronger
- All three model scores are 0–100: a higher number means the model rates this horse more favorably among the field.
Mod1(W): 82 (1/8) Mod2(W): 75 (2/8) Mod3(W): 79 (3/8) Mod1-LS: 55 (6/8) Win Prob: 18.4% Value Score: 1.35 ★
Performance vs. Peers Guide
- Bars (per post)
- Blue = avg career performance • Amber = avg last 3 races • Green = last race (improved vs. avg) • Red = last race (declined vs. avg)
- Trend Line
- Angled line above the bars: rising = improving form • falling = declining form.
- Horizontal Line
- Field average — the mean career performance of all horses in this race.
- Color Circles
- Standard post-position colors below each lane — same as the Total Pace chart.
- Border
- Thicker border = this horse’s post position.
Figure Comparison
- Rating
- The three Pick Pony algorithm ratings (Algo 1, Algo 2, Algo 3) that make up the overall PP AI Rating — higher is a stronger contender rating.
- Speed
- Career average speed, recent 3-race average, and last-race speed figure — spot horses in improving or declining form.
- Pace
- Average Early (E1), Mid (E2), and Stretch (LP) pace figures — reveals pace-setters vs. closers vs. all-the-way types.
- This horse
- The horse whose stats card is open is highlighted with a darker column background.
Winning Profiles
- Axes
- X: Win % from last 10 starts — Y: In-the-money % (top-3 finishes) from last 10 starts.
- Quadrants
- Consistent Winners (top-right): high win & ITM — reliable performers.
Place Threats (top-left): boards often but doesn’t win often — good exacta/trifecta angles.
Streaky (bottom-right): wins occasionally, misses the board often — all-or-nothing.
Developing (bottom-left): still finding form — longshot territory. - Reference Lines
- Dashed lines mark field averages. Dots to the right win more; dots higher board more.
- This horse
- Highlighted with a gold border and larger dot.
AI Model Comparison
- Winner Models (green)
- Mod1(W), Mod2(W), and Mod3(W) trained to predict race winners. Higher score = stronger contender.
- Longshot Models (red)
- Mod1-LS, Mod2-LS, and Mod3-LS trained to find high-value longshots. Higher score = stronger longshot candidate.
- Form Model (blue)
- Mod4 sequence model trained on recent form patterns. Higher score = stronger recent form profile.
- This horse
- Highlighted with a darker column background.
Race Pace Simulation Guide
- Slider
- Drag left→right to advance from gate to finish. Drag all the way back to reset the race.
- Predicted Finish Order
- Factors in contested pace burn, each horse’s effort curve (peaked-early vs. peaked-late), and wide trip cost from outside posts. Updated live when Track Bias changes.
- Pace Scenario
- Lone Speed: single E horse likely rates and holds. Contested: two E horses burn each other — closers benefit. Hot Pace: speed meltdown, deep closers thrive. Soft: no early speed, moderate fractions throughout.
- Track Bias
- Slider below canvas. −2 = strong closer/wet bias; +2 = strong speed/rail bias. Recomputes the predicted finish order.
- Boxed Indicator
- Dashed orange ring = horse is surrounded (rival ahead, rival behind, wall outside). In a real race this horse must find a clear path to run.
- Running Styles
- E/EE = early speed (rushes to rail). P = presser (stalks the pace). S = stalker. SS = slow starter / closer.
| Stat | vs. Current Card | vs. All Horses |
|---|---|---|
| Averages
Career-average metrics across all AI race analysis. Performance and pace averages reflect estimated historical performance; trainer and jockey grades score in-the-money percentages. Grading scale: A = elite • B = above average • C = average • D = below average • F = poor • — = no data |
||
| Pick Pony AI Rating | A | A |
| Pace Trip Longshot | — | — |
| Connections Longshot | — | — |
| Situational Longshot | — | — |
| Speed | B | D |
| Early Pace | D | D |
| Mid Pace | D | D |
| Late Pace | B | D |
| Finish Pos | D | F |
| Dirt Speed | D | F |
| Turf Speed | A | B |
| Distance Speed | C | F |
| Trainer Effectiveness | B | D |
| Jockey Effectiveness | B | C |
| 3rd Party Ratings | A | C |
| Recent
Performance analysis from the horse's recent races, weighted to reflect current form. Sprint and Route FPS (Foot Per Second) measure pace efficiency over the horse's recent sprints and routes respectively. Grading scale: A = elite • B = above average • C = average • D = below average • F = poor • — = no data |
||
| Speed | B | D |
| Early Pace | D | D |
| Mid Pace | D | D |
| Late Pace | B | D |
| Sprint FPS | D | D |
| Route FPS | D | D |
| Trainer Effectiveness | B | D |
| Jockey Effectiveness | B | C |
| 3rd Party Ratings | A | C |
| Predictions
AI-generated projections for the upcoming race, derived from prior AI analysis for speed and pace trends, surface and distance suitability, and current conditions. Grading scale: A = elite • B = above average • C = average • D = below average • F = poor • — = no data |
||
| Speed | A | A |
| Early Pace | D | D |
| Mid Pace | C | D |
| Late Pace | C | C |
TL;DR
Toggle
Get more in-depth analysis, expert picks, handicapper reports, AI picks, handicapping tools, in-article data tooltips, NO ADVERTISEMENTS, and other membership perks with a Pick Pony subscription!
Don’t forget Pick Pony’s Expert Picks, AI Picks, and Past Performance Sheets/Racing Forms!
The Pick Pony Handicapper's Report is published daily and provides analysis of all races on the card. A Pick Pony analyst prepares the report, so selections may differ from the Pick Pony Expert Picks, which are based on the consensus of all Pick Pony analysts.
The Thursday card at Delta Downs features an 8-race program anchored by competitive claiming and allowance matchups. The feature race is Race 2, an Allowance Optional Claiming event for Louisiana-bred two-year-olds going 7 furlongs, along with Race 7, a 7 1/2-furlong test for fillies and mares.
The “Scratch Watch” indicators suggest several entrants are returning from recent scratches (e.g., Priscilla Rose from a vet scratch on Dec 5, Aye Bay Bay from a steward scratch on Dec 6), which handicappers should note when assessing fitness and intent.
Weather and Track Conditions
Forecast for Vinton, LA:
The weather for Thursday, December 18, is expected to be unsettled with patchy rain possible throughout the day. Temperatures are forecast to range from the low 60s°F to a high near 77°F (25°C), which is unseasonably warm.
Track Condition:
With rain in the forecast and precipitation earlier in the week, the track surface is likely to be rated Good or Sloppy. Delta Downs' limestone-clay-sand base handles moisture reasonably well, but sustained rain will seal the track.
Track Bias Analysis:
- Sprint Distances (5f – 7f): Delta Downs is a 6-furlong bullring that historically favors Early Speed (E). Recent meet statistics indicate that ~35% of 5-furlong winners go wire-to-wire. The inside posts (1-3) are generally advantageous. However, on a wet track, the bias often shifts slightly to favor stalkers who can save ground and pounce as the early speed tires in the mud.
- Route Distances (7.5f – 1m): Speed is still dangerous, but the tight turns reward horses that can secure a tactical position before the first turn. Outside posts in two-turn races (like the 1-mile starts) are a significant disadvantage due to the short run to the first turn.
Race 1
Maiden Claiming $5,000 – 1 Mile Dirt
Post Time: 4:45 PM CST
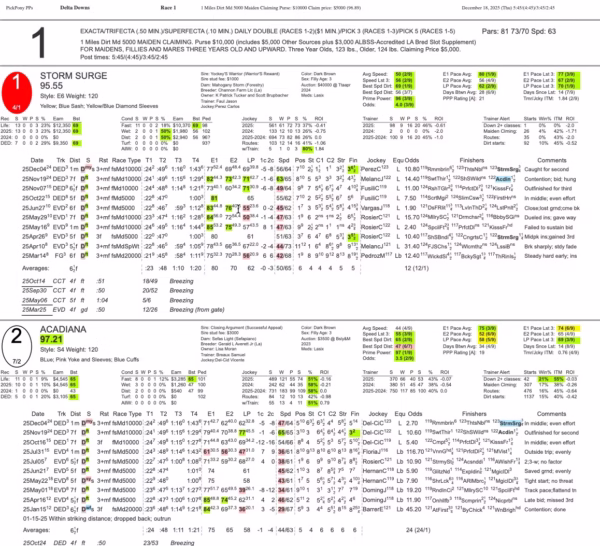
Pace Analysis
In this route event for maidens, the pace is likely to be moderate to slow. Storm Surge and Acadiana have shown flashes of tactical speed in previous sprints and should be forwardly placed stretching out.
Key Contenders
Image Of Me (Post 6): Enters as a strong contender dropping into a winnable spot. Her form suggests she fits well with this group, and the move to a route distance should suit her running style.
Acadiana (Post 2): Draws a favorable inside post. With top rider Vicente Del-Cid aboard (who is winning at a ~27% clip this meet), she is a major threat to control the pace or sit just off the lead.
Storm Surge (Post 1): The rail draw is a huge plus at this distance. If she breaks clean, she can save ground all the way around.
Secondary Choices
Cupie Cutie (Post 9): A veteran mare who may find the distance agreeable, though the outside post (9) is a major hurdle in a two-turn mile race at Delta.
Style Maker (Post 4): Lightly weighted at 115 lbs, could factor if the top choices falter.
Betting Strategy
Focus on Image of Me and Acadiana in Exacta boxes. The rail horse Storm Surge is a must-use in defensive positions.
Selections:
Win: Image of Me
Place: Acadiana
Show: Storm Surge
Race 2
Allowance Optional Claiming – 7 Furlongs Dirt
Post Time: 5:15 PM CST
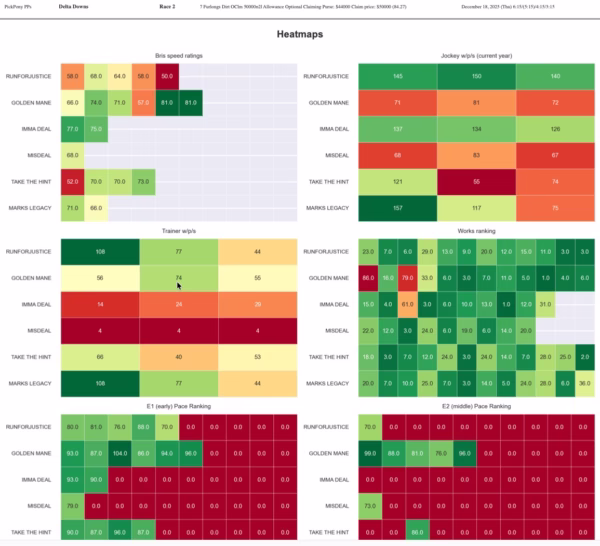
Pace Analysis
A competitive field of two-year-olds. Golden Mane has shown excellent early foot and will likely gun for the lead from the inside. Runforjustice also possesses speed, setting up a potential duel that could benefit a stalker.
Key Contenders
Golden Mane (Post 2): The likely favorite. He has been consistent and boasts high speed figures relative to this field. His ability to handle the 7-furlong distance is the key question, but his class edge is apparent.
Runforjustice (Post 1): Breaking from the rail, he has no choice but to go. If the track is playing speed-favoring, he could wire the field.
Imma Deal (Post 3): A consistent gelding who should sit the “garden trip” just behind the speed.
Secondary Choices
Take The Hint (Post 5): A logical exotics filler who can pick up pieces if the pace collapses.
Marks Legacy (Post 6): Timothy Thornton rides; this jockey-trainer combo is dangerous, but he needs to improve to topple the top two.
Betting Strategy
Golden Mane looks like a potential single in multi-race wagers. An Exacta 2-1 or 2-3 is the primary play.
Selections:
Win: Golden Mane
Place: Imma Deal
Show: Runforjustice
Race 3
Maiden Claiming $20,000 – 5 Furlongs Dirt
Post Time: 5:43 PM CST
Pace Analysis
A chaotic sprint with many young horses. He's Exaggerating and Caribbean Son show signs of early speed. Money Drop had a gate scratch in Nov but returns here; if he breaks well, he adds to the pace.
Key Contenders
He's Exaggerating (Post 4): Looks to be the class of the field. His recent works and connections suggest he is ready to break his maiden.
Money Drop (Post 3): If he overcomes the gate issues from his last scheduled start, his talent level puts him right in the mix.
Caribbean Son (Post 1): The rail draw in a 5-furlong sprint is a massive advantage. Timothy Thornton aboard is a strong signal of intent.
Longshots
Wildly Wicked (Post 7): Could offer value for the bottom of trifectas.
My Kinda Deal (Post 6): Look for improvement in this spot.
Betting Strategy
This race feels wide open. A win bet on He's Exaggerating is solid, but boxing the top three in an Exacta/Trifecta is safer given the maiden ranks.
Selections:
Win: He's Exaggerating
Place: Money Drop
Show: Caribbean Son
Race 4
Claiming $20,000 – 5 Furlongs Dirt
Post Time: 6:11 PM CST
Pace Analysis
Aye Bay Bay is the clear speed of the race. She comes off a scratch on Dec 6 but looks poised to dominate on the front end. On the Horizon will likely be the one chasing.
Key Contenders
Aye Bay Bay (Post 4): The one to beat. Possesses superior early speed figures and faces a field that may not be able to keep up early.
On The Horizon (Post 5): The primary danger. Vicente Del-Cid rides for trainer Samuel Breaux. This filly has been consistent and should be running late.
Doublebarrelvinny (Post 3): A steady performer who can hit the board.
Secondary Choices
Unforgetableimelda (Post 2): Draws well and has some back class, but needs to rebound from recent efforts.
Betting Strategy
Aye Bay Bay is a strong win candidate. A cold Exacta 4-5 is a high-probability wager.
Selections:
Win: Aye Bay Bay
Place: On the Horizon
Show: Doublebarrelvinny
Race 5
Starter Allowance – 1 Mile Dirt
Post Time: 6:39 PM CST
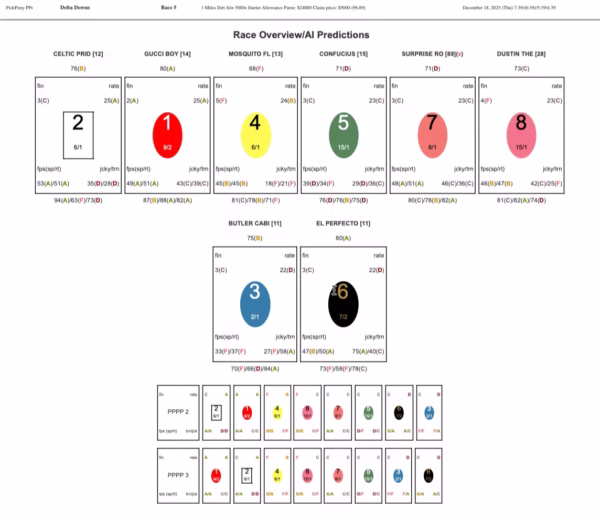
Pace Analysis
Butler Cabin and El Perfecto are the main pace players in this route. The two-turn mile requires tactical speed, and Gucci Boy from the rail might try to protect his position early.
Key Contenders
Butler Cabin (Post 3): He has been running against tougher company and should find this spot much easier. His tactical speed allows him to sit a perfect trip.
El Perfecto (Post 6): A hard-knocking veteran who is always around the money. He was a trainer scratch on Nov 15, so watch the tote board for fitness clues.
Gucci Boy (Post 1): The rail horse. If allowed to set a slow pace, he could steal it.
Longshots
Mosquito Fleet (Post 4): An 8-year-old veteran who knows how to win. Don't count him out for the exotics.
Betting Strategy
Butler Cabin stands out on class. Win bet.
Selections:
Win: Butler Cabin
Place: El Perfecto
Show: Gucci Boy
Race 6
Claiming $5,000 – 5 Furlongs Dirt
Post Time: 7:04 PM CST
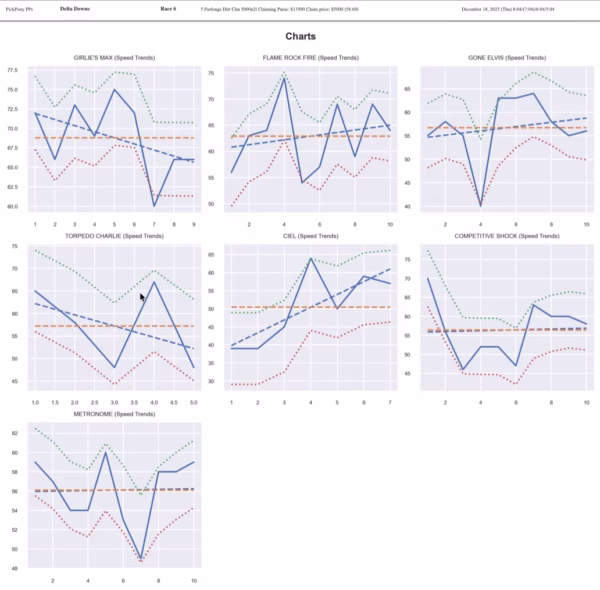
Pace Analysis
A bottom-level claiming sprint. Girlie's Max has speed and the rail. Flame Rock Fire also shows speed but is drawn inside as well. Expect a contested pace.
Key Contenders
Girlie's Max (Post 1): The rail draw and drop to this level make him the formidable favorite. Vicente Del-Cid aboard is the cherry on top.
Flame Rock Fire (Post 2): The main rival. Will likely pressure the 1 horse from the bell.
Ciel (Post 5): Light weight (115 lbs) and could close if the top two burn each other out.
Secondary Choices
Competitive Shock (Post 6): A logical use in deeper exotics.
Betting Strategy
The race likely goes through the inside two horses. An Exacta Box 1-2.
Selections:
Win: Girlie's Max
Place: Flame Rock Fire
Show: Ciel
Race 7
Allowance Optional Claiming – 7 1/2 Furlongs Dirt
Post Time: 7:32 PM CST
Pace Analysis
Everloving and Aledean (both trained by Tom Amoss) are the keys here. Aledean has “Fastest Leads” style and will go. Prima Bella is a stalker who will appreciate a pace meltdown.
Key Contenders
Prima Bella (Post 1): Our top pick. She draws the rail and should save ground while the speed horses duel. Her closing kick is well-suited for this 7.5-furlong distance.
Best Performer (Post 5): A consistent mare who hits the board at a high rate (74% Place/Show). A must-use in vertical wagers.
Everloving (Post 3): The speed of the race. If she clears, she could be gone, but the distance might test her stamina if pressured.
Secondary Choices
Can't Zap This (Post 2): Deep closer. If the track is muddy and favoring closers, she moves up significantly.
Forgotten Fortune (Post 6): Another closer who will be running late.
Betting Strategy
This is a race to seek value. Prima Bella offers better value than the likely favorite Everloving. Exacta box 1-3-5.
Selections:
Win: Prima Bella
Place: Everloving
Show: Best Performer
Race 8
Claiming $4,000 – 1 Mile Dirt
Post Time: 8:00 PM CST
Pace Analysis
A scramble of veterans. Ells and Infinitesimal seem to be the most consistent. Muffin Nuts has back class but is 8 years old.
Key Contenders
Ells (Post 4): Looks like the “live” horse in this field. Solid recent form relative to this group.
Infinitesimal (Post 9): A threat despite the wide post. At this class level, ability often overcomes the draw.
Muffin Nuts (Post 6): A reliable paycheck earner. Good for the bottom of the ticket.
Longshots
San Juan Hill (Post 7): Can pop at a price on his best day.
Betting Strategy
Ells to win.
Selections:
Win: Ells
Place: Infinitesimal
Show: Muffin Nuts
Jockey Notes and Insights
- Vicente Del-Cid: The dominant rider at the meet with a win rate hovering around 27-30%. He is riding Acadiana (R1), Take The Hint (R2), On The Horizon (R4), Girlie's Max (R6), and Everloving (R7). All are “live” mounts.
- Timothy Thornton: Another top-tier jockey (approx 30% win rate). Watch him on Marks Legacy (R2) and Caribbean Son (R3). He excels at aggressive gate rides in sprints.
- Elio Barrera: A solid choice for price plays. Riding Golden Mane (R2), the likely favorite, and Forgotten Fortune (R7).
Trainer Notes and Insights
- Brett Brinkman: Sends out Prima Bella (R7) and Spun Silk (R4). His barn has been heating up, hitting at ~25-30% recently.
- Allen Landry: Known for high percentage in the money (57% ITM). Trainer of Best Performer (R7). His horses are reliable exotics keys.
- Tom Amoss: A high-percentage trainer shipping in. He has Everloving and Aledean in Race 7. When Amoss enters at Delta, it's usually for a win.
Best Wagering Strategies and Value Plays
Best Bet of the Day:
Race 2: #2 Golden Mane. The speed/class combination looks superior to this field.
Best Value Play:
Race 7: #1 Prima Bella. With the Amoss entry likely taking heavy money, Prima Bella offers great value from the rail with a perfect stalking trip setup.
Daily Double Play (Races 1-2):
Race 1: 2, 6
Race 2: 2
Cost for $2 ticket: $4.00
Pick 3 Play (Races 6-8):
Race 6: 1, 2
Race 7: 1, 3, 5
Race 8: 4, 9
Cost for $1 ticket: $12.00


Mod1(W): 82 (1/8) Mod2(W): 75 (2/8) Mod3(W): 79 (3/8) Mod1-LS: 55 (6/8) Win Prob: 18.4% Value Score: 1.35 ★