Chart Guide (2.0.36)
- Bubbles
- Color = surface: green (turf), brown (dirt), blue (synthetic)
- Top number = finishing position; bottom number in parentheses = starting post position
- Height above line = beaten lengths — closer means a smaller margin
- Border = track conditions: green (FST/GD/FM), yellow (WF/SL/YLD), red (SY/MY/FRZ/SFT/HVY)
- Connecting Line
- Solid = good conditions; dashed = bad conditions
- Line Symbol
- ▲ Triangle = sprint (7f or less); ● Circle = route (more than 7f)
- Days Between Races
- Small number above each bubble (e.g. 19d) = days since the previous race — helps spot freshness, layoffs, and tight scheduling.
- Shaded Band (Bollinger)
- Highlights volatility — a wider band means more variation in recent performance
- Performance Trend
- Straight line showing the overall performance direction — angled up = improving, angled down = declining
- Dashed Reference Line
- AI Opponent = AI analysis class-level par for the race
AI Model History Guide
- Lines
- Each solid line shows this horse’s model score over its last 10 races: blue = Mod1, green = Mod2, amber = Mod3.
- Dashed Lines
- Dashed lines represent the current race’s field average for each model — a score below the dashed line indicates the horse ranked below average in this model’s assessment.
- Higher is Stronger
- All three model scores are 0–100: a higher number means the model rates this horse more favorably among the field.
Performance vs. Peers Guide
- Bars (per post)
- Blue = avg career performance • Amber = avg last 3 races • Green = last race (improved vs. avg) • Red = last race (declined vs. avg)
- Trend Line
- Angled line above the bars: rising = improving form • falling = declining form.
- Horizontal Line
- Field average — the mean career performance of all horses in this race.
- Color Circles
- Standard post-position colors below each lane — same as the Total Pace chart.
- Border
- Thicker border = this horse’s post position.
Figure Comparison
- Rating
- The three Pick Pony algorithm ratings (Algo 1, Algo 2, Algo 3) that make up the overall PP AI Rating — higher is a stronger contender rating.
- Speed
- Career average speed, recent 3-race average, and last-race speed figure — spot horses in improving or declining form.
- Pace
- Average Early (E1), Mid (E2), and Stretch (LP) pace figures — reveals pace-setters vs. closers vs. all-the-way types.
- This horse
- The horse whose stats card is open is highlighted with a darker column background.
Winning Profiles
- Axes
- X: Win % from last 10 starts — Y: In-the-money % (top-3 finishes) from last 10 starts.
- Quadrants
- Consistent Winners (top-right): high win & ITM — reliable performers.
Place Threats (top-left): boards often but doesn’t win often — good exacta/trifecta angles.
Streaky (bottom-right): wins occasionally, misses the board often — all-or-nothing.
Developing (bottom-left): still finding form — longshot territory. - Reference Lines
- Dashed lines mark field averages. Dots to the right win more; dots higher board more.
- This horse
- Highlighted with a gold border and larger dot.
AI Model Comparison
- Winner Models (green)
- Mod1(W), Mod2(W), and Mod3(W) trained to predict race winners. Higher score = stronger contender.
- Longshot Models (red)
- Mod1-LS, Mod2-LS, and Mod3-LS trained to find high-value longshots. Higher score = stronger longshot candidate.
- Form Model (blue)
- Mod4 sequence model trained on recent form patterns. Higher score = stronger recent form profile.
- This horse
- Highlighted with a darker column background.
Race Pace Simulation Guide
- Slider
- Drag left→right to advance from gate to finish. Drag all the way back to reset the race.
- Predicted Finish Order
- Factors in contested pace burn, each horse’s effort curve (peaked-early vs. peaked-late), and wide trip cost from outside posts. Updated live when Track Bias changes.
- Pace Scenario
- Lone Speed: single E horse likely rates and holds. Contested: two E horses burn each other — closers benefit. Hot Pace: speed meltdown, deep closers thrive. Soft: no early speed, moderate fractions throughout.
- Track Bias
- Slider below canvas. −2 = strong closer/wet bias; +2 = strong speed/rail bias. Recomputes the predicted finish order.
- Boxed Indicator
- Dashed orange ring = horse is surrounded (rival ahead, rival behind, wall outside). In a real race this horse must find a clear path to run.
- Running Styles
- E/EE = early speed (rushes to rail). P = presser (stalks the pace). S = stalker. SS = slow starter / closer.
| Stat | vs. Current Card | vs. All Horses |
|---|---|---|
| Averages
Career-average metrics across all AI race analysis. Performance and pace averages reflect estimated historical performance; trainer and jockey grades score in-the-money percentages. Grading scale: A = elite • B = above average • C = average • D = below average • F = poor • — = no data |
||
| Pick Pony AI Rating | B | C |
| Pace Trip Longshot | — | — |
| Connections Longshot | — | — |
| Situational Longshot | — | — |
| Speed | B | F |
| Early Pace | D | C |
| Mid Pace | B | D |
| Late Pace | B | D |
| Finish Pos | A | C |
| Dirt Speed | C | D |
| Turf Speed | C | D |
| Distance Speed | C | C |
| Trainer Effectiveness | B | B |
| Jockey Effectiveness | A | A |
| 3rd Party Ratings | B | D |
| Recent
Performance analysis from the horse's recent races, weighted to reflect current form. Sprint and Route FPS (Foot Per Second) measure pace efficiency over the horse's recent sprints and routes respectively. Grading scale: A = elite • B = above average • C = average • D = below average • F = poor • — = no data |
||
| Speed | B | F |
| Early Pace | D | C |
| Mid Pace | B | D |
| Late Pace | B | D |
| Sprint FPS | C | C |
| Route FPS | C | C |
| Trainer Effectiveness | B | B |
| Jockey Effectiveness | A | A |
| 3rd Party Ratings | B | D |
| Predictions
AI-generated projections for the upcoming race, derived from prior AI analysis for speed and pace trends, surface and distance suitability, and current conditions. Grading scale: A = elite • B = above average • C = average • D = below average • F = poor • — = no data |
||
| Speed | B | F |
| Early Pace | D | C |
| Mid Pace | B | D |
| Late Pace | C | C |
Chart Guide (2.0.36)
- Bubbles
- Color = surface: green (turf), brown (dirt), blue (synthetic)
- Top number = finishing position; bottom number in parentheses = starting post position
- Height above line = beaten lengths — closer means a smaller margin
- Border = track conditions: green (FST/GD/FM), yellow (WF/SL/YLD), red (SY/MY/FRZ/SFT/HVY)
- Connecting Line
- Solid = good conditions; dashed = bad conditions
- Line Symbol
- ▲ Triangle = sprint (7f or less); ● Circle = route (more than 7f)
- Days Between Races
- Small number above each bubble (e.g. 19d) = days since the previous race — helps spot freshness, layoffs, and tight scheduling.
- Shaded Band (Bollinger)
- Highlights volatility — a wider band means more variation in recent performance
- Performance Trend
- Straight line showing the overall performance direction — angled up = improving, angled down = declining
- Dashed Reference Line
- AI Opponent = AI analysis class-level par for the race
AI Model History Guide
- Lines
- Each solid line shows this horse’s model score over its last 10 races: blue = Mod1, green = Mod2, amber = Mod3.
- Dashed Lines
- Dashed lines represent the current race’s field average for each model — a score below the dashed line indicates the horse ranked below average in this model’s assessment.
- Higher is Stronger
- All three model scores are 0–100: a higher number means the model rates this horse more favorably among the field.
Mod1(W): 82 (1/8) Mod2(W): 75 (2/8) Mod3(W): 79 (3/8) Mod1-LS: 55 (6/8) Win Prob: 18.4% Value Score: 1.35 ★
Performance vs. Peers Guide
- Bars (per post)
- Blue = avg career performance • Amber = avg last 3 races • Green = last race (improved vs. avg) • Red = last race (declined vs. avg)
- Trend Line
- Angled line above the bars: rising = improving form • falling = declining form.
- Horizontal Line
- Field average — the mean career performance of all horses in this race.
- Color Circles
- Standard post-position colors below each lane — same as the Total Pace chart.
- Border
- Thicker border = this horse’s post position.
Figure Comparison
- Rating
- The three Pick Pony algorithm ratings (Algo 1, Algo 2, Algo 3) that make up the overall PP AI Rating — higher is a stronger contender rating.
- Speed
- Career average speed, recent 3-race average, and last-race speed figure — spot horses in improving or declining form.
- Pace
- Average Early (E1), Mid (E2), and Stretch (LP) pace figures — reveals pace-setters vs. closers vs. all-the-way types.
- This horse
- The horse whose stats card is open is highlighted with a darker column background.
Winning Profiles
- Axes
- X: Win % from last 10 starts — Y: In-the-money % (top-3 finishes) from last 10 starts.
- Quadrants
- Consistent Winners (top-right): high win & ITM — reliable performers.
Place Threats (top-left): boards often but doesn’t win often — good exacta/trifecta angles.
Streaky (bottom-right): wins occasionally, misses the board often — all-or-nothing.
Developing (bottom-left): still finding form — longshot territory. - Reference Lines
- Dashed lines mark field averages. Dots to the right win more; dots higher board more.
- This horse
- Highlighted with a gold border and larger dot.
AI Model Comparison
- Winner Models (green)
- Mod1(W), Mod2(W), and Mod3(W) trained to predict race winners. Higher score = stronger contender.
- Longshot Models (red)
- Mod1-LS, Mod2-LS, and Mod3-LS trained to find high-value longshots. Higher score = stronger longshot candidate.
- Form Model (blue)
- Mod4 sequence model trained on recent form patterns. Higher score = stronger recent form profile.
- This horse
- Highlighted with a darker column background.
Race Pace Simulation Guide
- Slider
- Drag left→right to advance from gate to finish. Drag all the way back to reset the race.
- Predicted Finish Order
- Factors in contested pace burn, each horse’s effort curve (peaked-early vs. peaked-late), and wide trip cost from outside posts. Updated live when Track Bias changes.
- Pace Scenario
- Lone Speed: single E horse likely rates and holds. Contested: two E horses burn each other — closers benefit. Hot Pace: speed meltdown, deep closers thrive. Soft: no early speed, moderate fractions throughout.
- Track Bias
- Slider below canvas. −2 = strong closer/wet bias; +2 = strong speed/rail bias. Recomputes the predicted finish order.
- Boxed Indicator
- Dashed orange ring = horse is surrounded (rival ahead, rival behind, wall outside). In a real race this horse must find a clear path to run.
- Running Styles
- E/EE = early speed (rushes to rail). P = presser (stalks the pace). S = stalker. SS = slow starter / closer.
| Stat | vs. Current Card | vs. All Horses |
|---|---|---|
| Averages
Career-average metrics across all AI race analysis. Performance and pace averages reflect estimated historical performance; trainer and jockey grades score in-the-money percentages. Grading scale: A = elite • B = above average • C = average • D = below average • F = poor • — = no data |
||
| Pick Pony AI Rating | D | D |
| Pace Trip Longshot | — | — |
| Connections Longshot | — | — |
| Situational Longshot | — | — |
| Speed | F | F |
| Early Pace | D | C |
| Mid Pace | F | F |
| Late Pace | F | F |
| Finish Pos | D | F |
| Dirt Speed | F | D |
| Turf Speed | A | C |
| Distance Speed | F | D |
| Trainer Effectiveness | D | F |
| Jockey Effectiveness | D | C |
| 3rd Party Ratings | D | F |
| Recent
Performance analysis from the horse's recent races, weighted to reflect current form. Sprint and Route FPS (Foot Per Second) measure pace efficiency over the horse's recent sprints and routes respectively. Grading scale: A = elite • B = above average • C = average • D = below average • F = poor • — = no data |
||
| Speed | F | F |
| Early Pace | D | D |
| Mid Pace | F | F |
| Late Pace | D | F |
| Sprint FPS | F | F |
| Route FPS | F | F |
| Trainer Effectiveness | D | F |
| Jockey Effectiveness | D | C |
| 3rd Party Ratings | D | F |
| Predictions
AI-generated projections for the upcoming race, derived from prior AI analysis for speed and pace trends, surface and distance suitability, and current conditions. Grading scale: A = elite • B = above average • C = average • D = below average • F = poor • — = no data |
||
| Speed | F | F |
| Early Pace | D | C |
| Mid Pace | D | F |
| Late Pace | C | C |
Chart Guide (2.0.36)
- Bubbles
- Color = surface: green (turf), brown (dirt), blue (synthetic)
- Top number = finishing position; bottom number in parentheses = starting post position
- Height above line = beaten lengths — closer means a smaller margin
- Border = track conditions: green (FST/GD/FM), yellow (WF/SL/YLD), red (SY/MY/FRZ/SFT/HVY)
- Connecting Line
- Solid = good conditions; dashed = bad conditions
- Line Symbol
- ▲ Triangle = sprint (7f or less); ● Circle = route (more than 7f)
- Days Between Races
- Small number above each bubble (e.g. 19d) = days since the previous race — helps spot freshness, layoffs, and tight scheduling.
- Shaded Band (Bollinger)
- Highlights volatility — a wider band means more variation in recent performance
- Performance Trend
- Straight line showing the overall performance direction — angled up = improving, angled down = declining
- Dashed Reference Line
- AI Opponent = AI analysis class-level par for the race
AI Model History Guide
- Lines
- Each solid line shows this horse’s model score over its last 10 races: blue = Mod1, green = Mod2, amber = Mod3.
- Dashed Lines
- Dashed lines represent the current race’s field average for each model — a score below the dashed line indicates the horse ranked below average in this model’s assessment.
- Higher is Stronger
- All three model scores are 0–100: a higher number means the model rates this horse more favorably among the field.
Mod1(W): 82 (1/8) Mod2(W): 75 (2/8) Mod3(W): 79 (3/8) Mod1-LS: 55 (6/8) Win Prob: 18.4% Value Score: 1.35 ★
Performance vs. Peers Guide
- Bars (per post)
- Blue = avg career performance • Amber = avg last 3 races • Green = last race (improved vs. avg) • Red = last race (declined vs. avg)
- Trend Line
- Angled line above the bars: rising = improving form • falling = declining form.
- Horizontal Line
- Field average — the mean career performance of all horses in this race.
- Color Circles
- Standard post-position colors below each lane — same as the Total Pace chart.
- Border
- Thicker border = this horse’s post position.
Figure Comparison
- Rating
- The three Pick Pony algorithm ratings (Algo 1, Algo 2, Algo 3) that make up the overall PP AI Rating — higher is a stronger contender rating.
- Speed
- Career average speed, recent 3-race average, and last-race speed figure — spot horses in improving or declining form.
- Pace
- Average Early (E1), Mid (E2), and Stretch (LP) pace figures — reveals pace-setters vs. closers vs. all-the-way types.
- This horse
- The horse whose stats card is open is highlighted with a darker column background.
Winning Profiles
- Axes
- X: Win % from last 10 starts — Y: In-the-money % (top-3 finishes) from last 10 starts.
- Quadrants
- Consistent Winners (top-right): high win & ITM — reliable performers.
Place Threats (top-left): boards often but doesn’t win often — good exacta/trifecta angles.
Streaky (bottom-right): wins occasionally, misses the board often — all-or-nothing.
Developing (bottom-left): still finding form — longshot territory. - Reference Lines
- Dashed lines mark field averages. Dots to the right win more; dots higher board more.
- This horse
- Highlighted with a gold border and larger dot.
AI Model Comparison
- Winner Models (green)
- Mod1(W), Mod2(W), and Mod3(W) trained to predict race winners. Higher score = stronger contender.
- Longshot Models (red)
- Mod1-LS, Mod2-LS, and Mod3-LS trained to find high-value longshots. Higher score = stronger longshot candidate.
- Form Model (blue)
- Mod4 sequence model trained on recent form patterns. Higher score = stronger recent form profile.
- This horse
- Highlighted with a darker column background.
Race Pace Simulation Guide
- Slider
- Drag left→right to advance from gate to finish. Drag all the way back to reset the race.
- Predicted Finish Order
- Factors in contested pace burn, each horse’s effort curve (peaked-early vs. peaked-late), and wide trip cost from outside posts. Updated live when Track Bias changes.
- Pace Scenario
- Lone Speed: single E horse likely rates and holds. Contested: two E horses burn each other — closers benefit. Hot Pace: speed meltdown, deep closers thrive. Soft: no early speed, moderate fractions throughout.
- Track Bias
- Slider below canvas. −2 = strong closer/wet bias; +2 = strong speed/rail bias. Recomputes the predicted finish order.
- Boxed Indicator
- Dashed orange ring = horse is surrounded (rival ahead, rival behind, wall outside). In a real race this horse must find a clear path to run.
- Running Styles
- E/EE = early speed (rushes to rail). P = presser (stalks the pace). S = stalker. SS = slow starter / closer.
| Stat | vs. Current Card | vs. All Horses |
|---|---|---|
| Averages
Career-average metrics across all AI race analysis. Performance and pace averages reflect estimated historical performance; trainer and jockey grades score in-the-money percentages. Grading scale: A = elite • B = above average • C = average • D = below average • F = poor • — = no data |
||
| Pick Pony AI Rating | A | B |
| Pace Trip Longshot | — | — |
| Connections Longshot | — | — |
| Situational Longshot | — | — |
| Speed | C | F |
| Early Pace | A | A |
| Mid Pace | A | C |
| Late Pace | D | F |
| Finish Pos | D | F |
| Dirt Speed | A | D |
| Turf Speed | C | D |
| Distance Speed | A | C |
| Trainer Effectiveness | A | A |
| Jockey Effectiveness | C | C |
| 3rd Party Ratings | B | D |
| Recent
Performance analysis from the horse's recent races, weighted to reflect current form. Sprint and Route FPS (Foot Per Second) measure pace efficiency over the horse's recent sprints and routes respectively. Grading scale: A = elite • B = above average • C = average • D = below average • F = poor • — = no data |
||
| Speed | C | F |
| Early Pace | A | A |
| Mid Pace | B | C |
| Late Pace | D | F |
| Sprint FPS | A | A |
| Route FPS | B | B |
| Trainer Effectiveness | A | A |
| Jockey Effectiveness | C | C |
| 3rd Party Ratings | B | D |
| Predictions
AI-generated projections for the upcoming race, derived from prior AI analysis for speed and pace trends, surface and distance suitability, and current conditions. Grading scale: A = elite • B = above average • C = average • D = below average • F = poor • — = no data |
||
| Speed | C | F |
| Early Pace | A | A |
| Mid Pace | B | C |
| Late Pace | C | C |
Chart Guide (2.0.36)
- Bubbles
- Color = surface: green (turf), brown (dirt), blue (synthetic)
- Top number = finishing position; bottom number in parentheses = starting post position
- Height above line = beaten lengths — closer means a smaller margin
- Border = track conditions: green (FST/GD/FM), yellow (WF/SL/YLD), red (SY/MY/FRZ/SFT/HVY)
- Connecting Line
- Solid = good conditions; dashed = bad conditions
- Line Symbol
- ▲ Triangle = sprint (7f or less); ● Circle = route (more than 7f)
- Days Between Races
- Small number above each bubble (e.g. 19d) = days since the previous race — helps spot freshness, layoffs, and tight scheduling.
- Shaded Band (Bollinger)
- Highlights volatility — a wider band means more variation in recent performance
- Performance Trend
- Straight line showing the overall performance direction — angled up = improving, angled down = declining
- Dashed Reference Line
- AI Opponent = AI analysis class-level par for the race
AI Model History Guide
- Lines
- Each solid line shows this horse’s model score over its last 10 races: blue = Mod1, green = Mod2, amber = Mod3.
- Dashed Lines
- Dashed lines represent the current race’s field average for each model — a score below the dashed line indicates the horse ranked below average in this model’s assessment.
- Higher is Stronger
- All three model scores are 0–100: a higher number means the model rates this horse more favorably among the field.
Mod1(W): 82 (1/8) Mod2(W): 75 (2/8) Mod3(W): 79 (3/8) Mod1-LS: 55 (6/8) Win Prob: 18.4% Value Score: 1.35 ★
Performance vs. Peers Guide
- Bars (per post)
- Blue = avg career performance • Amber = avg last 3 races • Green = last race (improved vs. avg) • Red = last race (declined vs. avg)
- Trend Line
- Angled line above the bars: rising = improving form • falling = declining form.
- Horizontal Line
- Field average — the mean career performance of all horses in this race.
- Color Circles
- Standard post-position colors below each lane — same as the Total Pace chart.
- Border
- Thicker border = this horse’s post position.
Figure Comparison
- Rating
- The three Pick Pony algorithm ratings (Algo 1, Algo 2, Algo 3) that make up the overall PP AI Rating — higher is a stronger contender rating.
- Speed
- Career average speed, recent 3-race average, and last-race speed figure — spot horses in improving or declining form.
- Pace
- Average Early (E1), Mid (E2), and Stretch (LP) pace figures — reveals pace-setters vs. closers vs. all-the-way types.
- This horse
- The horse whose stats card is open is highlighted with a darker column background.
Winning Profiles
- Axes
- X: Win % from last 10 starts — Y: In-the-money % (top-3 finishes) from last 10 starts.
- Quadrants
- Consistent Winners (top-right): high win & ITM — reliable performers.
Place Threats (top-left): boards often but doesn’t win often — good exacta/trifecta angles.
Streaky (bottom-right): wins occasionally, misses the board often — all-or-nothing.
Developing (bottom-left): still finding form — longshot territory. - Reference Lines
- Dashed lines mark field averages. Dots to the right win more; dots higher board more.
- This horse
- Highlighted with a gold border and larger dot.
AI Model Comparison
- Winner Models (green)
- Mod1(W), Mod2(W), and Mod3(W) trained to predict race winners. Higher score = stronger contender.
- Longshot Models (red)
- Mod1-LS, Mod2-LS, and Mod3-LS trained to find high-value longshots. Higher score = stronger longshot candidate.
- Form Model (blue)
- Mod4 sequence model trained on recent form patterns. Higher score = stronger recent form profile.
- This horse
- Highlighted with a darker column background.
Race Pace Simulation Guide
- Slider
- Drag left→right to advance from gate to finish. Drag all the way back to reset the race.
- Predicted Finish Order
- Factors in contested pace burn, each horse’s effort curve (peaked-early vs. peaked-late), and wide trip cost from outside posts. Updated live when Track Bias changes.
- Pace Scenario
- Lone Speed: single E horse likely rates and holds. Contested: two E horses burn each other — closers benefit. Hot Pace: speed meltdown, deep closers thrive. Soft: no early speed, moderate fractions throughout.
- Track Bias
- Slider below canvas. −2 = strong closer/wet bias; +2 = strong speed/rail bias. Recomputes the predicted finish order.
- Boxed Indicator
- Dashed orange ring = horse is surrounded (rival ahead, rival behind, wall outside). In a real race this horse must find a clear path to run.
- Running Styles
- E/EE = early speed (rushes to rail). P = presser (stalks the pace). S = stalker. SS = slow starter / closer.
| Stat | vs. Current Card | vs. All Horses |
|---|---|---|
| Averages
Career-average metrics across all AI race analysis. Performance and pace averages reflect estimated historical performance; trainer and jockey grades score in-the-money percentages. Grading scale: A = elite • B = above average • C = average • D = below average • F = poor • — = no data |
||
| Pick Pony AI Rating | D | C |
| Pace Trip Longshot | — | — |
| Connections Longshot | — | — |
| Situational Longshot | — | — |
| Speed | D | D |
| Early Pace | B | A |
| Mid Pace | D | B |
| Late Pace | D | D |
| Finish Pos | F | F |
| Dirt Speed | F | C |
| Turf Speed | C | B |
| Distance Speed | D | B |
| Trainer Effectiveness | F | F |
| Jockey Effectiveness | B | A |
| 3rd Party Ratings | D | C |
| Recent
Performance analysis from the horse's recent races, weighted to reflect current form. Sprint and Route FPS (Foot Per Second) measure pace efficiency over the horse's recent sprints and routes respectively. Grading scale: A = elite • B = above average • C = average • D = below average • F = poor • — = no data |
||
| Speed | D | C |
| Early Pace | C | A |
| Mid Pace | D | B |
| Late Pace | D | C |
| Sprint FPS | A | A |
| Route FPS | B | A |
| Trainer Effectiveness | F | F |
| Jockey Effectiveness | B | A |
| 3rd Party Ratings | D | C |
| Predictions
AI-generated projections for the upcoming race, derived from prior AI analysis for speed and pace trends, surface and distance suitability, and current conditions. Grading scale: A = elite • B = above average • C = average • D = below average • F = poor • — = no data |
||
| Speed | D | D |
| Early Pace | A | A |
| Mid Pace | F | F |
| Late Pace | C | C |
Chart Guide (2.0.36)
- Bubbles
- Color = surface: green (turf), brown (dirt), blue (synthetic)
- Top number = finishing position; bottom number in parentheses = starting post position
- Height above line = beaten lengths — closer means a smaller margin
- Border = track conditions: green (FST/GD/FM), yellow (WF/SL/YLD), red (SY/MY/FRZ/SFT/HVY)
- Connecting Line
- Solid = good conditions; dashed = bad conditions
- Line Symbol
- ▲ Triangle = sprint (7f or less); ● Circle = route (more than 7f)
- Days Between Races
- Small number above each bubble (e.g. 19d) = days since the previous race — helps spot freshness, layoffs, and tight scheduling.
- Shaded Band (Bollinger)
- Highlights volatility — a wider band means more variation in recent performance
- Performance Trend
- Straight line showing the overall performance direction — angled up = improving, angled down = declining
- Dashed Reference Line
- AI Opponent = AI analysis class-level par for the race
AI Model History Guide
- Lines
- Each solid line shows this horse’s model score over its last 10 races: blue = Mod1, green = Mod2, amber = Mod3.
- Dashed Lines
- Dashed lines represent the current race’s field average for each model — a score below the dashed line indicates the horse ranked below average in this model’s assessment.
- Higher is Stronger
- All three model scores are 0–100: a higher number means the model rates this horse more favorably among the field.
Mod1(W): 82 (1/8) Mod2(W): 75 (2/8) Mod3(W): 79 (3/8) Mod1-LS: 55 (6/8) Win Prob: 18.4% Value Score: 1.35 ★
Performance vs. Peers Guide
- Bars (per post)
- Blue = avg career performance • Amber = avg last 3 races • Green = last race (improved vs. avg) • Red = last race (declined vs. avg)
- Trend Line
- Angled line above the bars: rising = improving form • falling = declining form.
- Horizontal Line
- Field average — the mean career performance of all horses in this race.
- Color Circles
- Standard post-position colors below each lane — same as the Total Pace chart.
- Border
- Thicker border = this horse’s post position.
Figure Comparison
- Rating
- The three Pick Pony algorithm ratings (Algo 1, Algo 2, Algo 3) that make up the overall PP AI Rating — higher is a stronger contender rating.
- Speed
- Career average speed, recent 3-race average, and last-race speed figure — spot horses in improving or declining form.
- Pace
- Average Early (E1), Mid (E2), and Stretch (LP) pace figures — reveals pace-setters vs. closers vs. all-the-way types.
- This horse
- The horse whose stats card is open is highlighted with a darker column background.
Winning Profiles
- Axes
- X: Win % from last 10 starts — Y: In-the-money % (top-3 finishes) from last 10 starts.
- Quadrants
- Consistent Winners (top-right): high win & ITM — reliable performers.
Place Threats (top-left): boards often but doesn’t win often — good exacta/trifecta angles.
Streaky (bottom-right): wins occasionally, misses the board often — all-or-nothing.
Developing (bottom-left): still finding form — longshot territory. - Reference Lines
- Dashed lines mark field averages. Dots to the right win more; dots higher board more.
- This horse
- Highlighted with a gold border and larger dot.
AI Model Comparison
- Winner Models (green)
- Mod1(W), Mod2(W), and Mod3(W) trained to predict race winners. Higher score = stronger contender.
- Longshot Models (red)
- Mod1-LS, Mod2-LS, and Mod3-LS trained to find high-value longshots. Higher score = stronger longshot candidate.
- Form Model (blue)
- Mod4 sequence model trained on recent form patterns. Higher score = stronger recent form profile.
- This horse
- Highlighted with a darker column background.
Race Pace Simulation Guide
- Slider
- Drag left→right to advance from gate to finish. Drag all the way back to reset the race.
- Predicted Finish Order
- Factors in contested pace burn, each horse’s effort curve (peaked-early vs. peaked-late), and wide trip cost from outside posts. Updated live when Track Bias changes.
- Pace Scenario
- Lone Speed: single E horse likely rates and holds. Contested: two E horses burn each other — closers benefit. Hot Pace: speed meltdown, deep closers thrive. Soft: no early speed, moderate fractions throughout.
- Track Bias
- Slider below canvas. −2 = strong closer/wet bias; +2 = strong speed/rail bias. Recomputes the predicted finish order.
- Boxed Indicator
- Dashed orange ring = horse is surrounded (rival ahead, rival behind, wall outside). In a real race this horse must find a clear path to run.
- Running Styles
- E/EE = early speed (rushes to rail). P = presser (stalks the pace). S = stalker. SS = slow starter / closer.
| Stat | vs. Current Card | vs. All Horses |
|---|---|---|
| Averages
Career-average metrics across all AI race analysis. Performance and pace averages reflect estimated historical performance; trainer and jockey grades score in-the-money percentages. Grading scale: A = elite • B = above average • C = average • D = below average • F = poor • — = no data |
||
| Pick Pony AI Rating | B | C |
| Pace Trip Longshot | — | — |
| Connections Longshot | — | — |
| Situational Longshot | — | — |
| Speed | B | B |
| Early Pace | A | A |
| Mid Pace | A | A |
| Late Pace | D | D |
| Finish Pos | D | C |
| Dirt Speed | A | A |
| Turf Speed | B | B |
| Distance Speed | A | A |
| Trainer Effectiveness | B | B |
| Jockey Effectiveness | A | A |
| 3rd Party Ratings | B | A |
| Recent
Performance analysis from the horse's recent races, weighted to reflect current form. Sprint and Route FPS (Foot Per Second) measure pace efficiency over the horse's recent sprints and routes respectively. Grading scale: A = elite • B = above average • C = average • D = below average • F = poor • — = no data |
||
| Speed | D | D |
| Early Pace | D | A |
| Mid Pace | A | A |
| Late Pace | D | D |
| Sprint FPS | D | A |
| Route FPS | D | B |
| Trainer Effectiveness | B | B |
| Jockey Effectiveness | A | A |
| 3rd Party Ratings | B | A |
| Predictions
AI-generated projections for the upcoming race, derived from prior AI analysis for speed and pace trends, surface and distance suitability, and current conditions. Grading scale: A = elite • B = above average • C = average • D = below average • F = poor • — = no data |
||
| Speed | B | C |
| Early Pace | B | A |
| Mid Pace | A | A |
| Late Pace | C | C |
Chart Guide (2.0.36)
- Bubbles
- Color = surface: green (turf), brown (dirt), blue (synthetic)
- Top number = finishing position; bottom number in parentheses = starting post position
- Height above line = beaten lengths — closer means a smaller margin
- Border = track conditions: green (FST/GD/FM), yellow (WF/SL/YLD), red (SY/MY/FRZ/SFT/HVY)
- Connecting Line
- Solid = good conditions; dashed = bad conditions
- Line Symbol
- ▲ Triangle = sprint (7f or less); ● Circle = route (more than 7f)
- Days Between Races
- Small number above each bubble (e.g. 19d) = days since the previous race — helps spot freshness, layoffs, and tight scheduling.
- Shaded Band (Bollinger)
- Highlights volatility — a wider band means more variation in recent performance
- Performance Trend
- Straight line showing the overall performance direction — angled up = improving, angled down = declining
- Dashed Reference Line
- AI Opponent = AI analysis class-level par for the race
AI Model History Guide
- Lines
- Each solid line shows this horse’s model score over its last 10 races: blue = Mod1, green = Mod2, amber = Mod3.
- Dashed Lines
- Dashed lines represent the current race’s field average for each model — a score below the dashed line indicates the horse ranked below average in this model’s assessment.
- Higher is Stronger
- All three model scores are 0–100: a higher number means the model rates this horse more favorably among the field.
Mod1(W): 82 (1/8) Mod2(W): 75 (2/8) Mod3(W): 79 (3/8) Mod1-LS: 55 (6/8) Win Prob: 18.4% Value Score: 1.35 ★
Performance vs. Peers Guide
- Bars (per post)
- Blue = avg career performance • Amber = avg last 3 races • Green = last race (improved vs. avg) • Red = last race (declined vs. avg)
- Trend Line
- Angled line above the bars: rising = improving form • falling = declining form.
- Horizontal Line
- Field average — the mean career performance of all horses in this race.
- Color Circles
- Standard post-position colors below each lane — same as the Total Pace chart.
- Border
- Thicker border = this horse’s post position.
Figure Comparison
- Rating
- The three Pick Pony algorithm ratings (Algo 1, Algo 2, Algo 3) that make up the overall PP AI Rating — higher is a stronger contender rating.
- Speed
- Career average speed, recent 3-race average, and last-race speed figure — spot horses in improving or declining form.
- Pace
- Average Early (E1), Mid (E2), and Stretch (LP) pace figures — reveals pace-setters vs. closers vs. all-the-way types.
- This horse
- The horse whose stats card is open is highlighted with a darker column background.
Winning Profiles
- Axes
- X: Win % from last 10 starts — Y: In-the-money % (top-3 finishes) from last 10 starts.
- Quadrants
- Consistent Winners (top-right): high win & ITM — reliable performers.
Place Threats (top-left): boards often but doesn’t win often — good exacta/trifecta angles.
Streaky (bottom-right): wins occasionally, misses the board often — all-or-nothing.
Developing (bottom-left): still finding form — longshot territory. - Reference Lines
- Dashed lines mark field averages. Dots to the right win more; dots higher board more.
- This horse
- Highlighted with a gold border and larger dot.
AI Model Comparison
- Winner Models (green)
- Mod1(W), Mod2(W), and Mod3(W) trained to predict race winners. Higher score = stronger contender.
- Longshot Models (red)
- Mod1-LS, Mod2-LS, and Mod3-LS trained to find high-value longshots. Higher score = stronger longshot candidate.
- Form Model (blue)
- Mod4 sequence model trained on recent form patterns. Higher score = stronger recent form profile.
- This horse
- Highlighted with a darker column background.
Race Pace Simulation Guide
- Slider
- Drag left→right to advance from gate to finish. Drag all the way back to reset the race.
- Predicted Finish Order
- Factors in contested pace burn, each horse’s effort curve (peaked-early vs. peaked-late), and wide trip cost from outside posts. Updated live when Track Bias changes.
- Pace Scenario
- Lone Speed: single E horse likely rates and holds. Contested: two E horses burn each other — closers benefit. Hot Pace: speed meltdown, deep closers thrive. Soft: no early speed, moderate fractions throughout.
- Track Bias
- Slider below canvas. −2 = strong closer/wet bias; +2 = strong speed/rail bias. Recomputes the predicted finish order.
- Boxed Indicator
- Dashed orange ring = horse is surrounded (rival ahead, rival behind, wall outside). In a real race this horse must find a clear path to run.
- Running Styles
- E/EE = early speed (rushes to rail). P = presser (stalks the pace). S = stalker. SS = slow starter / closer.
| Stat | vs. Current Card | vs. All Horses |
|---|---|---|
| Averages
Career-average metrics across all AI race analysis. Performance and pace averages reflect estimated historical performance; trainer and jockey grades score in-the-money percentages. Grading scale: A = elite • B = above average • C = average • D = below average • F = poor • — = no data |
||
| Pick Pony AI Rating | A | B |
| Pace Trip Longshot | — | — |
| Connections Longshot | — | — |
| Situational Longshot | — | — |
| Speed | B | B |
| Early Pace | D | A |
| Mid Pace | B | A |
| Late Pace | B | B |
| Finish Pos | C | B |
| Dirt Speed | A | A |
| Turf Speed | A | A |
| Distance Speed | B | B |
| Trainer Effectiveness | B | B |
| Jockey Effectiveness | F | C |
| 3rd Party Ratings | A | A |
| Recent
Performance analysis from the horse's recent races, weighted to reflect current form. Sprint and Route FPS (Foot Per Second) measure pace efficiency over the horse's recent sprints and routes respectively. Grading scale: A = elite • B = above average • C = average • D = below average • F = poor • — = no data |
||
| Speed | A | A |
| Early Pace | A | A |
| Mid Pace | B | A |
| Late Pace | B | B |
| Sprint FPS | D | A |
| Route FPS | D | B |
| Trainer Effectiveness | B | B |
| Jockey Effectiveness | F | C |
| 3rd Party Ratings | A | A |
| Predictions
AI-generated projections for the upcoming race, derived from prior AI analysis for speed and pace trends, surface and distance suitability, and current conditions. Grading scale: A = elite • B = above average • C = average • D = below average • F = poor • — = no data |
||
| Speed | B | B |
| Early Pace | C | A |
| Mid Pace | B | A |
| Late Pace | C | C |
Chart Guide (2.0.36)
- Bubbles
- Color = surface: green (turf), brown (dirt), blue (synthetic)
- Top number = finishing position; bottom number in parentheses = starting post position
- Height above line = beaten lengths — closer means a smaller margin
- Border = track conditions: green (FST/GD/FM), yellow (WF/SL/YLD), red (SY/MY/FRZ/SFT/HVY)
- Connecting Line
- Solid = good conditions; dashed = bad conditions
- Line Symbol
- ▲ Triangle = sprint (7f or less); ● Circle = route (more than 7f)
- Days Between Races
- Small number above each bubble (e.g. 19d) = days since the previous race — helps spot freshness, layoffs, and tight scheduling.
- Shaded Band (Bollinger)
- Highlights volatility — a wider band means more variation in recent performance
- Performance Trend
- Straight line showing the overall performance direction — angled up = improving, angled down = declining
- Dashed Reference Line
- AI Opponent = AI analysis class-level par for the race
AI Model History Guide
- Lines
- Each solid line shows this horse’s model score over its last 10 races: blue = Mod1, green = Mod2, amber = Mod3.
- Dashed Lines
- Dashed lines represent the current race’s field average for each model — a score below the dashed line indicates the horse ranked below average in this model’s assessment.
- Higher is Stronger
- All three model scores are 0–100: a higher number means the model rates this horse more favorably among the field.
Mod1(W): 82 (1/8) Mod2(W): 75 (2/8) Mod3(W): 79 (3/8) Mod1-LS: 55 (6/8) Win Prob: 18.4% Value Score: 1.35 ★
Performance vs. Peers Guide
- Bars (per post)
- Blue = avg career performance • Amber = avg last 3 races • Green = last race (improved vs. avg) • Red = last race (declined vs. avg)
- Trend Line
- Angled line above the bars: rising = improving form • falling = declining form.
- Horizontal Line
- Field average — the mean career performance of all horses in this race.
- Color Circles
- Standard post-position colors below each lane — same as the Total Pace chart.
- Border
- Thicker border = this horse’s post position.
Figure Comparison
- Rating
- The three Pick Pony algorithm ratings (Algo 1, Algo 2, Algo 3) that make up the overall PP AI Rating — higher is a stronger contender rating.
- Speed
- Career average speed, recent 3-race average, and last-race speed figure — spot horses in improving or declining form.
- Pace
- Average Early (E1), Mid (E2), and Stretch (LP) pace figures — reveals pace-setters vs. closers vs. all-the-way types.
- This horse
- The horse whose stats card is open is highlighted with a darker column background.
Winning Profiles
- Axes
- X: Win % from last 10 starts — Y: In-the-money % (top-3 finishes) from last 10 starts.
- Quadrants
- Consistent Winners (top-right): high win & ITM — reliable performers.
Place Threats (top-left): boards often but doesn’t win often — good exacta/trifecta angles.
Streaky (bottom-right): wins occasionally, misses the board often — all-or-nothing.
Developing (bottom-left): still finding form — longshot territory. - Reference Lines
- Dashed lines mark field averages. Dots to the right win more; dots higher board more.
- This horse
- Highlighted with a gold border and larger dot.
AI Model Comparison
- Winner Models (green)
- Mod1(W), Mod2(W), and Mod3(W) trained to predict race winners. Higher score = stronger contender.
- Longshot Models (red)
- Mod1-LS, Mod2-LS, and Mod3-LS trained to find high-value longshots. Higher score = stronger longshot candidate.
- Form Model (blue)
- Mod4 sequence model trained on recent form patterns. Higher score = stronger recent form profile.
- This horse
- Highlighted with a darker column background.
Race Pace Simulation Guide
- Slider
- Drag left→right to advance from gate to finish. Drag all the way back to reset the race.
- Predicted Finish Order
- Factors in contested pace burn, each horse’s effort curve (peaked-early vs. peaked-late), and wide trip cost from outside posts. Updated live when Track Bias changes.
- Pace Scenario
- Lone Speed: single E horse likely rates and holds. Contested: two E horses burn each other — closers benefit. Hot Pace: speed meltdown, deep closers thrive. Soft: no early speed, moderate fractions throughout.
- Track Bias
- Slider below canvas. −2 = strong closer/wet bias; +2 = strong speed/rail bias. Recomputes the predicted finish order.
- Boxed Indicator
- Dashed orange ring = horse is surrounded (rival ahead, rival behind, wall outside). In a real race this horse must find a clear path to run.
- Running Styles
- E/EE = early speed (rushes to rail). P = presser (stalks the pace). S = stalker. SS = slow starter / closer.
| Stat | vs. Current Card | vs. All Horses |
|---|---|---|
| Averages
Career-average metrics across all AI race analysis. Performance and pace averages reflect estimated historical performance; trainer and jockey grades score in-the-money percentages. Grading scale: A = elite • B = above average • C = average • D = below average • F = poor • — = no data |
||
| Pick Pony AI Rating | A | C |
| Pace Trip Longshot | — | — |
| Connections Longshot | — | — |
| Situational Longshot | — | — |
| Speed | B | F |
| Early Pace | B | B |
| Mid Pace | A | C |
| Late Pace | B | D |
| Finish Pos | F | F |
| Dirt Speed | B | D |
| Turf Speed | C | D |
| Distance Speed | B | C |
| Trainer Effectiveness | A | B |
| Jockey Effectiveness | A | A |
| 3rd Party Ratings | B | D |
| Recent
Performance analysis from the horse's recent races, weighted to reflect current form. Sprint and Route FPS (Foot Per Second) measure pace efficiency over the horse's recent sprints and routes respectively. Grading scale: A = elite • B = above average • C = average • D = below average • F = poor • — = no data |
||
| Speed | B | F |
| Early Pace | B | B |
| Mid Pace | A | C |
| Late Pace | B | D |
| Sprint FPS | A | A |
| Route FPS | A | C |
| Trainer Effectiveness | A | B |
| Jockey Effectiveness | A | A |
| 3rd Party Ratings | B | D |
| Predictions
AI-generated projections for the upcoming race, derived from prior AI analysis for speed and pace trends, surface and distance suitability, and current conditions. Grading scale: A = elite • B = above average • C = average • D = below average • F = poor • — = no data |
||
| Speed | C | F |
| Early Pace | A | B |
| Mid Pace | C | F |
| Late Pace | C | C |
AI Model History Guide
- Lines
- Each solid line shows this horse’s model score over its last 10 races: blue = Mod1, green = Mod2, amber = Mod3.
- Dashed Lines
- Dashed lines represent the current race’s field average for each model — a score below the dashed line indicates the horse ranked below average in this model’s assessment.
- Higher is Stronger
- All three model scores are 0–100: a higher number means the model rates this horse more favorably among the field.
Mod1(W): 82 (1/8) Mod2(W): 75 (2/8) Mod3(W): 79 (3/8) Mod1-LS: 55 (6/8) Win Prob: 18.4% Value Score: 1.35 ★
Performance vs. Peers Guide
- Bars (per post)
- Blue = avg career performance • Amber = avg last 3 races • Green = last race (improved vs. avg) • Red = last race (declined vs. avg)
- Trend Line
- Angled line above the bars: rising = improving form • falling = declining form.
- Horizontal Line
- Field average — the mean career performance of all horses in this race.
- Color Circles
- Standard post-position colors below each lane — same as the Total Pace chart.
- Border
- Thicker border = this horse’s post position.
Figure Comparison
- Rating
- The three Pick Pony algorithm ratings (Algo 1, Algo 2, Algo 3) that make up the overall PP AI Rating — higher is a stronger contender rating.
- Speed
- Career average speed, recent 3-race average, and last-race speed figure — spot horses in improving or declining form.
- Pace
- Average Early (E1), Mid (E2), and Stretch (LP) pace figures — reveals pace-setters vs. closers vs. all-the-way types.
- This horse
- The horse whose stats card is open is highlighted with a darker column background.
Winning Profiles
- Axes
- X: Win % from last 10 starts — Y: In-the-money % (top-3 finishes) from last 10 starts.
- Quadrants
- Consistent Winners (top-right): high win & ITM — reliable performers.
Place Threats (top-left): boards often but doesn’t win often — good exacta/trifecta angles.
Streaky (bottom-right): wins occasionally, misses the board often — all-or-nothing.
Developing (bottom-left): still finding form — longshot territory. - Reference Lines
- Dashed lines mark field averages. Dots to the right win more; dots higher board more.
- This horse
- Highlighted with a gold border and larger dot.
AI Model Comparison
- Winner Models (green)
- Mod1(W), Mod2(W), and Mod3(W) trained to predict race winners. Higher score = stronger contender.
- Longshot Models (red)
- Mod1-LS, Mod2-LS, and Mod3-LS trained to find high-value longshots. Higher score = stronger longshot candidate.
- Form Model (blue)
- Mod4 sequence model trained on recent form patterns. Higher score = stronger recent form profile.
- This horse
- Highlighted with a darker column background.
Race Pace Simulation Guide
- Slider
- Drag left→right to advance from gate to finish. Drag all the way back to reset the race.
- Predicted Finish Order
- Factors in contested pace burn, each horse’s effort curve (peaked-early vs. peaked-late), and wide trip cost from outside posts. Updated live when Track Bias changes.
- Pace Scenario
- Lone Speed: single E horse likely rates and holds. Contested: two E horses burn each other — closers benefit. Hot Pace: speed meltdown, deep closers thrive. Soft: no early speed, moderate fractions throughout.
- Track Bias
- Slider below canvas. −2 = strong closer/wet bias; +2 = strong speed/rail bias. Recomputes the predicted finish order.
- Boxed Indicator
- Dashed orange ring = horse is surrounded (rival ahead, rival behind, wall outside). In a real race this horse must find a clear path to run.
- Running Styles
- E/EE = early speed (rushes to rail). P = presser (stalks the pace). S = stalker. SS = slow starter / closer.
| Stat | vs. Current Card | vs. All Horses |
|---|---|---|
| Averages
Career-average metrics across all AI race analysis. Performance and pace averages reflect estimated historical performance; trainer and jockey grades score in-the-money percentages. Grading scale: A = elite • B = above average • C = average • D = below average • F = poor • — = no data |
||
| Pick Pony AI Rating | C | F |
| Pace Trip Longshot | — | — |
| Connections Longshot | — | — |
| Situational Longshot | — | — |
| Speed | D | F |
| Early Pace | D | F |
| Mid Pace | D | F |
| Late Pace | D | F |
| Finish Pos | B | A |
| Dirt Speed | D | F |
| Turf Speed | C | D |
| Distance Speed | D | F |
| Trainer Effectiveness | B | C |
| Jockey Effectiveness | B | B |
| 3rd Party Ratings | D | F |
| Recent
Performance analysis from the horse's recent races, weighted to reflect current form. Sprint and Route FPS (Foot Per Second) measure pace efficiency over the horse's recent sprints and routes respectively. Grading scale: A = elite • B = above average • C = average • D = below average • F = poor • — = no data |
||
| Speed | D | F |
| Early Pace | D | F |
| Mid Pace | D | F |
| Late Pace | D | F |
| Sprint FPS | D | F |
| Route FPS | D | F |
| Trainer Effectiveness | B | C |
| Jockey Effectiveness | B | B |
| 3rd Party Ratings | D | F |
| Predictions
AI-generated projections for the upcoming race, derived from prior AI analysis for speed and pace trends, surface and distance suitability, and current conditions. Grading scale: A = elite • B = above average • C = average • D = below average • F = poor • — = no data |
||
| Speed | D | F |
| Early Pace | C | F |
| Mid Pace | C | F |
| Late Pace | C | C |
Chart Guide (2.0.36)
- Bubbles
- Color = surface: green (turf), brown (dirt), blue (synthetic)
- Top number = finishing position; bottom number in parentheses = starting post position
- Height above line = beaten lengths — closer means a smaller margin
- Border = track conditions: green (FST/GD/FM), yellow (WF/SL/YLD), red (SY/MY/FRZ/SFT/HVY)
- Connecting Line
- Solid = good conditions; dashed = bad conditions
- Line Symbol
- ▲ Triangle = sprint (7f or less); ● Circle = route (more than 7f)
- Days Between Races
- Small number above each bubble (e.g. 19d) = days since the previous race — helps spot freshness, layoffs, and tight scheduling.
- Shaded Band (Bollinger)
- Highlights volatility — a wider band means more variation in recent performance
- Performance Trend
- Straight line showing the overall performance direction — angled up = improving, angled down = declining
- Dashed Reference Line
- AI Opponent = AI analysis class-level par for the race
AI Model History Guide
- Lines
- Each solid line shows this horse’s model score over its last 10 races: blue = Mod1, green = Mod2, amber = Mod3.
- Dashed Lines
- Dashed lines represent the current race’s field average for each model — a score below the dashed line indicates the horse ranked below average in this model’s assessment.
- Higher is Stronger
- All three model scores are 0–100: a higher number means the model rates this horse more favorably among the field.
Mod1(W): 82 (1/8) Mod2(W): 75 (2/8) Mod3(W): 79 (3/8) Mod1-LS: 55 (6/8) Win Prob: 18.4% Value Score: 1.35 ★
Performance vs. Peers Guide
- Bars (per post)
- Blue = avg career performance • Amber = avg last 3 races • Green = last race (improved vs. avg) • Red = last race (declined vs. avg)
- Trend Line
- Angled line above the bars: rising = improving form • falling = declining form.
- Horizontal Line
- Field average — the mean career performance of all horses in this race.
- Color Circles
- Standard post-position colors below each lane — same as the Total Pace chart.
- Border
- Thicker border = this horse’s post position.
Figure Comparison
- Rating
- The three Pick Pony algorithm ratings (Algo 1, Algo 2, Algo 3) that make up the overall PP AI Rating — higher is a stronger contender rating.
- Speed
- Career average speed, recent 3-race average, and last-race speed figure — spot horses in improving or declining form.
- Pace
- Average Early (E1), Mid (E2), and Stretch (LP) pace figures — reveals pace-setters vs. closers vs. all-the-way types.
- This horse
- The horse whose stats card is open is highlighted with a darker column background.
Winning Profiles
- Axes
- X: Win % from last 10 starts — Y: In-the-money % (top-3 finishes) from last 10 starts.
- Quadrants
- Consistent Winners (top-right): high win & ITM — reliable performers.
Place Threats (top-left): boards often but doesn’t win often — good exacta/trifecta angles.
Streaky (bottom-right): wins occasionally, misses the board often — all-or-nothing.
Developing (bottom-left): still finding form — longshot territory. - Reference Lines
- Dashed lines mark field averages. Dots to the right win more; dots higher board more.
- This horse
- Highlighted with a gold border and larger dot.
AI Model Comparison
- Winner Models (green)
- Mod1(W), Mod2(W), and Mod3(W) trained to predict race winners. Higher score = stronger contender.
- Longshot Models (red)
- Mod1-LS, Mod2-LS, and Mod3-LS trained to find high-value longshots. Higher score = stronger longshot candidate.
- Form Model (blue)
- Mod4 sequence model trained on recent form patterns. Higher score = stronger recent form profile.
- This horse
- Highlighted with a darker column background.
Race Pace Simulation Guide
- Slider
- Drag left→right to advance from gate to finish. Drag all the way back to reset the race.
- Predicted Finish Order
- Factors in contested pace burn, each horse’s effort curve (peaked-early vs. peaked-late), and wide trip cost from outside posts. Updated live when Track Bias changes.
- Pace Scenario
- Lone Speed: single E horse likely rates and holds. Contested: two E horses burn each other — closers benefit. Hot Pace: speed meltdown, deep closers thrive. Soft: no early speed, moderate fractions throughout.
- Track Bias
- Slider below canvas. −2 = strong closer/wet bias; +2 = strong speed/rail bias. Recomputes the predicted finish order.
- Boxed Indicator
- Dashed orange ring = horse is surrounded (rival ahead, rival behind, wall outside). In a real race this horse must find a clear path to run.
- Running Styles
- E/EE = early speed (rushes to rail). P = presser (stalks the pace). S = stalker. SS = slow starter / closer.
| Stat | vs. Current Card | vs. All Horses |
|---|---|---|
| Averages
Career-average metrics across all AI race analysis. Performance and pace averages reflect estimated historical performance; trainer and jockey grades score in-the-money percentages. Grading scale: A = elite • B = above average • C = average • D = below average • F = poor • — = no data |
||
| Pick Pony AI Rating | A | C |
| Pace Trip Longshot | — | — |
| Connections Longshot | — | — |
| Situational Longshot | — | — |
| Speed | A | D |
| Early Pace | A | A |
| Mid Pace | A | C |
| Late Pace | A | D |
| Finish Pos | B | A |
| Dirt Speed | A | C |
| Turf Speed | C | D |
| Distance Speed | A | C |
| Trainer Effectiveness | A | B |
| Jockey Effectiveness | A | B |
| 3rd Party Ratings | A | B |
| Recent
Performance analysis from the horse's recent races, weighted to reflect current form. Sprint and Route FPS (Foot Per Second) measure pace efficiency over the horse's recent sprints and routes respectively. Grading scale: A = elite • B = above average • C = average • D = below average • F = poor • — = no data |
||
| Speed | A | D |
| Early Pace | A | A |
| Mid Pace | A | C |
| Late Pace | A | C |
| Sprint FPS | B | B |
| Route FPS | B | D |
| Trainer Effectiveness | A | B |
| Jockey Effectiveness | A | B |
| 3rd Party Ratings | A | B |
| Predictions
AI-generated projections for the upcoming race, derived from prior AI analysis for speed and pace trends, surface and distance suitability, and current conditions. Grading scale: A = elite • B = above average • C = average • D = below average • F = poor • — = no data |
||
| Speed | A | D |
| Early Pace | C | F |
| Mid Pace | C | F |
| Late Pace | C | C |
Chart Guide (2.0.36)
- Bubbles
- Color = surface: green (turf), brown (dirt), blue (synthetic)
- Top number = finishing position; bottom number in parentheses = starting post position
- Height above line = beaten lengths — closer means a smaller margin
- Border = track conditions: green (FST/GD/FM), yellow (WF/SL/YLD), red (SY/MY/FRZ/SFT/HVY)
- Connecting Line
- Solid = good conditions; dashed = bad conditions
- Line Symbol
- ▲ Triangle = sprint (7f or less); ● Circle = route (more than 7f)
- Days Between Races
- Small number above each bubble (e.g. 19d) = days since the previous race — helps spot freshness, layoffs, and tight scheduling.
- Shaded Band (Bollinger)
- Highlights volatility — a wider band means more variation in recent performance
- Performance Trend
- Straight line showing the overall performance direction — angled up = improving, angled down = declining
- Dashed Reference Line
- AI Opponent = AI analysis class-level par for the race
AI Model History Guide
- Lines
- Each solid line shows this horse’s model score over its last 10 races: blue = Mod1, green = Mod2, amber = Mod3.
- Dashed Lines
- Dashed lines represent the current race’s field average for each model — a score below the dashed line indicates the horse ranked below average in this model’s assessment.
- Higher is Stronger
- All three model scores are 0–100: a higher number means the model rates this horse more favorably among the field.
Mod1(W): 82 (1/8) Mod2(W): 75 (2/8) Mod3(W): 79 (3/8) Mod1-LS: 55 (6/8) Win Prob: 18.4% Value Score: 1.35 ★
Performance vs. Peers Guide
- Bars (per post)
- Blue = avg career performance • Amber = avg last 3 races • Green = last race (improved vs. avg) • Red = last race (declined vs. avg)
- Trend Line
- Angled line above the bars: rising = improving form • falling = declining form.
- Horizontal Line
- Field average — the mean career performance of all horses in this race.
- Color Circles
- Standard post-position colors below each lane — same as the Total Pace chart.
- Border
- Thicker border = this horse’s post position.
Figure Comparison
- Rating
- The three Pick Pony algorithm ratings (Algo 1, Algo 2, Algo 3) that make up the overall PP AI Rating — higher is a stronger contender rating.
- Speed
- Career average speed, recent 3-race average, and last-race speed figure — spot horses in improving or declining form.
- Pace
- Average Early (E1), Mid (E2), and Stretch (LP) pace figures — reveals pace-setters vs. closers vs. all-the-way types.
- This horse
- The horse whose stats card is open is highlighted with a darker column background.
Winning Profiles
- Axes
- X: Win % from last 10 starts — Y: In-the-money % (top-3 finishes) from last 10 starts.
- Quadrants
- Consistent Winners (top-right): high win & ITM — reliable performers.
Place Threats (top-left): boards often but doesn’t win often — good exacta/trifecta angles.
Streaky (bottom-right): wins occasionally, misses the board often — all-or-nothing.
Developing (bottom-left): still finding form — longshot territory. - Reference Lines
- Dashed lines mark field averages. Dots to the right win more; dots higher board more.
- This horse
- Highlighted with a gold border and larger dot.
AI Model Comparison
- Winner Models (green)
- Mod1(W), Mod2(W), and Mod3(W) trained to predict race winners. Higher score = stronger contender.
- Longshot Models (red)
- Mod1-LS, Mod2-LS, and Mod3-LS trained to find high-value longshots. Higher score = stronger longshot candidate.
- Form Model (blue)
- Mod4 sequence model trained on recent form patterns. Higher score = stronger recent form profile.
- This horse
- Highlighted with a darker column background.
Race Pace Simulation Guide
- Slider
- Drag left→right to advance from gate to finish. Drag all the way back to reset the race.
- Predicted Finish Order
- Factors in contested pace burn, each horse’s effort curve (peaked-early vs. peaked-late), and wide trip cost from outside posts. Updated live when Track Bias changes.
- Pace Scenario
- Lone Speed: single E horse likely rates and holds. Contested: two E horses burn each other — closers benefit. Hot Pace: speed meltdown, deep closers thrive. Soft: no early speed, moderate fractions throughout.
- Track Bias
- Slider below canvas. −2 = strong closer/wet bias; +2 = strong speed/rail bias. Recomputes the predicted finish order.
- Boxed Indicator
- Dashed orange ring = horse is surrounded (rival ahead, rival behind, wall outside). In a real race this horse must find a clear path to run.
- Running Styles
- E/EE = early speed (rushes to rail). P = presser (stalks the pace). S = stalker. SS = slow starter / closer.
| Stat | vs. Current Card | vs. All Horses |
|---|---|---|
| Averages
Career-average metrics across all AI race analysis. Performance and pace averages reflect estimated historical performance; trainer and jockey grades score in-the-money percentages. Grading scale: A = elite • B = above average • C = average • D = below average • F = poor • — = no data |
||
| Pick Pony AI Rating | A | B |
| Pace Trip Longshot | — | — |
| Connections Longshot | — | — |
| Situational Longshot | — | — |
| Speed | A | C |
| Early Pace | F | D |
| Mid Pace | F | D |
| Late Pace | A | B |
| Finish Pos | D | D |
| Dirt Speed | C | B |
| Turf Speed | A | B |
| Distance Speed | F | F |
| Trainer Effectiveness | B | B |
| Jockey Effectiveness | C | D |
| 3rd Party Ratings | A | B |
| Recent
Performance analysis from the horse's recent races, weighted to reflect current form. Sprint and Route FPS (Foot Per Second) measure pace efficiency over the horse's recent sprints and routes respectively. Grading scale: A = elite • B = above average • C = average • D = below average • F = poor • — = no data |
||
| Speed | A | B |
| Early Pace | D | D |
| Mid Pace | D | C |
| Late Pace | A | B |
| Sprint FPS | F | D |
| Route FPS | F | D |
| Trainer Effectiveness | B | B |
| Jockey Effectiveness | C | D |
| 3rd Party Ratings | A | B |
| Predictions
AI-generated projections for the upcoming race, derived from prior AI analysis for speed and pace trends, surface and distance suitability, and current conditions. Grading scale: A = elite • B = above average • C = average • D = below average • F = poor • — = no data |
||
| Speed | A | C |
| Early Pace | F | D |
| Mid Pace | F | D |
| Late Pace | C | C |
Chart Guide (2.0.36)
- Bubbles
- Color = surface: green (turf), brown (dirt), blue (synthetic)
- Top number = finishing position; bottom number in parentheses = starting post position
- Height above line = beaten lengths — closer means a smaller margin
- Border = track conditions: green (FST/GD/FM), yellow (WF/SL/YLD), red (SY/MY/FRZ/SFT/HVY)
- Connecting Line
- Solid = good conditions; dashed = bad conditions
- Line Symbol
- ▲ Triangle = sprint (7f or less); ● Circle = route (more than 7f)
- Days Between Races
- Small number above each bubble (e.g. 19d) = days since the previous race — helps spot freshness, layoffs, and tight scheduling.
- Shaded Band (Bollinger)
- Highlights volatility — a wider band means more variation in recent performance
- Performance Trend
- Straight line showing the overall performance direction — angled up = improving, angled down = declining
- Dashed Reference Line
- AI Opponent = AI analysis class-level par for the race
AI Model History Guide
- Lines
- Each solid line shows this horse’s model score over its last 10 races: blue = Mod1, green = Mod2, amber = Mod3.
- Dashed Lines
- Dashed lines represent the current race’s field average for each model — a score below the dashed line indicates the horse ranked below average in this model’s assessment.
- Higher is Stronger
- All three model scores are 0–100: a higher number means the model rates this horse more favorably among the field.
Mod1(W): 82 (1/8) Mod2(W): 75 (2/8) Mod3(W): 79 (3/8) Mod1-LS: 55 (6/8) Win Prob: 18.4% Value Score: 1.35 ★
Performance vs. Peers Guide
- Bars (per post)
- Blue = avg career performance • Amber = avg last 3 races • Green = last race (improved vs. avg) • Red = last race (declined vs. avg)
- Trend Line
- Angled line above the bars: rising = improving form • falling = declining form.
- Horizontal Line
- Field average — the mean career performance of all horses in this race.
- Color Circles
- Standard post-position colors below each lane — same as the Total Pace chart.
- Border
- Thicker border = this horse’s post position.
Figure Comparison
- Rating
- The three Pick Pony algorithm ratings (Algo 1, Algo 2, Algo 3) that make up the overall PP AI Rating — higher is a stronger contender rating.
- Speed
- Career average speed, recent 3-race average, and last-race speed figure — spot horses in improving or declining form.
- Pace
- Average Early (E1), Mid (E2), and Stretch (LP) pace figures — reveals pace-setters vs. closers vs. all-the-way types.
- This horse
- The horse whose stats card is open is highlighted with a darker column background.
Winning Profiles
- Axes
- X: Win % from last 10 starts — Y: In-the-money % (top-3 finishes) from last 10 starts.
- Quadrants
- Consistent Winners (top-right): high win & ITM — reliable performers.
Place Threats (top-left): boards often but doesn’t win often — good exacta/trifecta angles.
Streaky (bottom-right): wins occasionally, misses the board often — all-or-nothing.
Developing (bottom-left): still finding form — longshot territory. - Reference Lines
- Dashed lines mark field averages. Dots to the right win more; dots higher board more.
- This horse
- Highlighted with a gold border and larger dot.
AI Model Comparison
- Winner Models (green)
- Mod1(W), Mod2(W), and Mod3(W) trained to predict race winners. Higher score = stronger contender.
- Longshot Models (red)
- Mod1-LS, Mod2-LS, and Mod3-LS trained to find high-value longshots. Higher score = stronger longshot candidate.
- Form Model (blue)
- Mod4 sequence model trained on recent form patterns. Higher score = stronger recent form profile.
- This horse
- Highlighted with a darker column background.
Race Pace Simulation Guide
- Slider
- Drag left→right to advance from gate to finish. Drag all the way back to reset the race.
- Predicted Finish Order
- Factors in contested pace burn, each horse’s effort curve (peaked-early vs. peaked-late), and wide trip cost from outside posts. Updated live when Track Bias changes.
- Pace Scenario
- Lone Speed: single E horse likely rates and holds. Contested: two E horses burn each other — closers benefit. Hot Pace: speed meltdown, deep closers thrive. Soft: no early speed, moderate fractions throughout.
- Track Bias
- Slider below canvas. −2 = strong closer/wet bias; +2 = strong speed/rail bias. Recomputes the predicted finish order.
- Boxed Indicator
- Dashed orange ring = horse is surrounded (rival ahead, rival behind, wall outside). In a real race this horse must find a clear path to run.
- Running Styles
- E/EE = early speed (rushes to rail). P = presser (stalks the pace). S = stalker. SS = slow starter / closer.
| Stat | vs. Current Card | vs. All Horses |
|---|---|---|
| Averages
Career-average metrics across all AI race analysis. Performance and pace averages reflect estimated historical performance; trainer and jockey grades score in-the-money percentages. Grading scale: A = elite • B = above average • C = average • D = below average • F = poor • — = no data |
||
| Pick Pony AI Rating | D | C |
| Pace Trip Longshot | — | — |
| Connections Longshot | — | — |
| Situational Longshot | — | — |
| Speed | B | C |
| Early Pace | D | D |
| Mid Pace | D | D |
| Late Pace | B | C |
| Finish Pos | A | C |
| Dirt Speed | A | B |
| Turf Speed | A | B |
| Distance Speed | D | D |
| Trainer Effectiveness | A | B |
| Jockey Effectiveness | A | A |
| 3rd Party Ratings | A | B |
| Recent
Performance analysis from the horse's recent races, weighted to reflect current form. Sprint and Route FPS (Foot Per Second) measure pace efficiency over the horse's recent sprints and routes respectively. Grading scale: A = elite • B = above average • C = average • D = below average • F = poor • — = no data |
||
| Speed | B | C |
| Early Pace | D | D |
| Mid Pace | C | C |
| Late Pace | A | B |
| Sprint FPS | D | C |
| Route FPS | D | C |
| Trainer Effectiveness | A | B |
| Jockey Effectiveness | A | A |
| 3rd Party Ratings | A | B |
| Predictions
AI-generated projections for the upcoming race, derived from prior AI analysis for speed and pace trends, surface and distance suitability, and current conditions. Grading scale: A = elite • B = above average • C = average • D = below average • F = poor • — = no data |
||
| Speed | B | C |
| Early Pace | D | D |
| Mid Pace | D | C |
| Late Pace | C | C |
Chart Guide (2.0.36)
- Bubbles
- Color = surface: green (turf), brown (dirt), blue (synthetic)
- Top number = finishing position; bottom number in parentheses = starting post position
- Height above line = beaten lengths — closer means a smaller margin
- Border = track conditions: green (FST/GD/FM), yellow (WF/SL/YLD), red (SY/MY/FRZ/SFT/HVY)
- Connecting Line
- Solid = good conditions; dashed = bad conditions
- Line Symbol
- ▲ Triangle = sprint (7f or less); ● Circle = route (more than 7f)
- Days Between Races
- Small number above each bubble (e.g. 19d) = days since the previous race — helps spot freshness, layoffs, and tight scheduling.
- Shaded Band (Bollinger)
- Highlights volatility — a wider band means more variation in recent performance
- Performance Trend
- Straight line showing the overall performance direction — angled up = improving, angled down = declining
- Dashed Reference Line
- AI Opponent = AI analysis class-level par for the race
AI Model History Guide
- Lines
- Each solid line shows this horse’s model score over its last 10 races: blue = Mod1, green = Mod2, amber = Mod3.
- Dashed Lines
- Dashed lines represent the current race’s field average for each model — a score below the dashed line indicates the horse ranked below average in this model’s assessment.
- Higher is Stronger
- All three model scores are 0–100: a higher number means the model rates this horse more favorably among the field.
Mod1(W): 82 (1/8) Mod2(W): 75 (2/8) Mod3(W): 79 (3/8) Mod1-LS: 55 (6/8) Win Prob: 18.4% Value Score: 1.35 ★
Performance vs. Peers Guide
- Bars (per post)
- Blue = avg career performance • Amber = avg last 3 races • Green = last race (improved vs. avg) • Red = last race (declined vs. avg)
- Trend Line
- Angled line above the bars: rising = improving form • falling = declining form.
- Horizontal Line
- Field average — the mean career performance of all horses in this race.
- Color Circles
- Standard post-position colors below each lane — same as the Total Pace chart.
- Border
- Thicker border = this horse’s post position.
Figure Comparison
- Rating
- The three Pick Pony algorithm ratings (Algo 1, Algo 2, Algo 3) that make up the overall PP AI Rating — higher is a stronger contender rating.
- Speed
- Career average speed, recent 3-race average, and last-race speed figure — spot horses in improving or declining form.
- Pace
- Average Early (E1), Mid (E2), and Stretch (LP) pace figures — reveals pace-setters vs. closers vs. all-the-way types.
- This horse
- The horse whose stats card is open is highlighted with a darker column background.
Winning Profiles
- Axes
- X: Win % from last 10 starts — Y: In-the-money % (top-3 finishes) from last 10 starts.
- Quadrants
- Consistent Winners (top-right): high win & ITM — reliable performers.
Place Threats (top-left): boards often but doesn’t win often — good exacta/trifecta angles.
Streaky (bottom-right): wins occasionally, misses the board often — all-or-nothing.
Developing (bottom-left): still finding form — longshot territory. - Reference Lines
- Dashed lines mark field averages. Dots to the right win more; dots higher board more.
- This horse
- Highlighted with a gold border and larger dot.
AI Model Comparison
- Winner Models (green)
- Mod1(W), Mod2(W), and Mod3(W) trained to predict race winners. Higher score = stronger contender.
- Longshot Models (red)
- Mod1-LS, Mod2-LS, and Mod3-LS trained to find high-value longshots. Higher score = stronger longshot candidate.
- Form Model (blue)
- Mod4 sequence model trained on recent form patterns. Higher score = stronger recent form profile.
- This horse
- Highlighted with a darker column background.
Race Pace Simulation Guide
- Slider
- Drag left→right to advance from gate to finish. Drag all the way back to reset the race.
- Predicted Finish Order
- Factors in contested pace burn, each horse’s effort curve (peaked-early vs. peaked-late), and wide trip cost from outside posts. Updated live when Track Bias changes.
- Pace Scenario
- Lone Speed: single E horse likely rates and holds. Contested: two E horses burn each other — closers benefit. Hot Pace: speed meltdown, deep closers thrive. Soft: no early speed, moderate fractions throughout.
- Track Bias
- Slider below canvas. −2 = strong closer/wet bias; +2 = strong speed/rail bias. Recomputes the predicted finish order.
- Boxed Indicator
- Dashed orange ring = horse is surrounded (rival ahead, rival behind, wall outside). In a real race this horse must find a clear path to run.
- Running Styles
- E/EE = early speed (rushes to rail). P = presser (stalks the pace). S = stalker. SS = slow starter / closer.
| Stat | vs. Current Card | vs. All Horses |
|---|---|---|
| Averages
Career-average metrics across all AI race analysis. Performance and pace averages reflect estimated historical performance; trainer and jockey grades score in-the-money percentages. Grading scale: A = elite • B = above average • C = average • D = below average • F = poor • — = no data |
||
| Pick Pony AI Rating | A | A |
| Pace Trip Longshot | — | — |
| Connections Longshot | — | — |
| Situational Longshot | — | — |
| Speed | C | C |
| Early Pace | A | B |
| Mid Pace | A | B |
| Late Pace | D | C |
| Finish Pos | C | D |
| Dirt Speed | D | B |
| Turf Speed | C | C |
| Distance Speed | D | C |
| Trainer Effectiveness | B | B |
| Jockey Effectiveness | B | B |
| 3rd Party Ratings | F | C |
| Recent
Performance analysis from the horse's recent races, weighted to reflect current form. Sprint and Route FPS (Foot Per Second) measure pace efficiency over the horse's recent sprints and routes respectively. Grading scale: A = elite • B = above average • C = average • D = below average • F = poor • — = no data |
||
| Speed | F | D |
| Early Pace | C | C |
| Mid Pace | C | C |
| Late Pace | F | C |
| Sprint FPS | C | B |
| Route FPS | C | C |
| Trainer Effectiveness | B | B |
| Jockey Effectiveness | B | B |
| 3rd Party Ratings | F | C |
| Predictions
AI-generated projections for the upcoming race, derived from prior AI analysis for speed and pace trends, surface and distance suitability, and current conditions. Grading scale: A = elite • B = above average • C = average • D = below average • F = poor • — = no data |
||
| Speed | C | D |
| Early Pace | A | B |
| Mid Pace | A | A |
| Late Pace | C | C |
Chart Guide (2.0.36)
- Bubbles
- Color = surface: green (turf), brown (dirt), blue (synthetic)
- Top number = finishing position; bottom number in parentheses = starting post position
- Height above line = beaten lengths — closer means a smaller margin
- Border = track conditions: green (FST/GD/FM), yellow (WF/SL/YLD), red (SY/MY/FRZ/SFT/HVY)
- Connecting Line
- Solid = good conditions; dashed = bad conditions
- Line Symbol
- ▲ Triangle = sprint (7f or less); ● Circle = route (more than 7f)
- Days Between Races
- Small number above each bubble (e.g. 19d) = days since the previous race — helps spot freshness, layoffs, and tight scheduling.
- Shaded Band (Bollinger)
- Highlights volatility — a wider band means more variation in recent performance
- Performance Trend
- Straight line showing the overall performance direction — angled up = improving, angled down = declining
- Dashed Reference Line
- AI Opponent = AI analysis class-level par for the race
AI Model History Guide
- Lines
- Each solid line shows this horse’s model score over its last 10 races: blue = Mod1, green = Mod2, amber = Mod3.
- Dashed Lines
- Dashed lines represent the current race’s field average for each model — a score below the dashed line indicates the horse ranked below average in this model’s assessment.
- Higher is Stronger
- All three model scores are 0–100: a higher number means the model rates this horse more favorably among the field.
Mod1(W): 82 (1/8) Mod2(W): 75 (2/8) Mod3(W): 79 (3/8) Mod1-LS: 55 (6/8) Win Prob: 18.4% Value Score: 1.35 ★
Performance vs. Peers Guide
- Bars (per post)
- Blue = avg career performance • Amber = avg last 3 races • Green = last race (improved vs. avg) • Red = last race (declined vs. avg)
- Trend Line
- Angled line above the bars: rising = improving form • falling = declining form.
- Horizontal Line
- Field average — the mean career performance of all horses in this race.
- Color Circles
- Standard post-position colors below each lane — same as the Total Pace chart.
- Border
- Thicker border = this horse’s post position.
Figure Comparison
- Rating
- The three Pick Pony algorithm ratings (Algo 1, Algo 2, Algo 3) that make up the overall PP AI Rating — higher is a stronger contender rating.
- Speed
- Career average speed, recent 3-race average, and last-race speed figure — spot horses in improving or declining form.
- Pace
- Average Early (E1), Mid (E2), and Stretch (LP) pace figures — reveals pace-setters vs. closers vs. all-the-way types.
- This horse
- The horse whose stats card is open is highlighted with a darker column background.
Winning Profiles
- Axes
- X: Win % from last 10 starts — Y: In-the-money % (top-3 finishes) from last 10 starts.
- Quadrants
- Consistent Winners (top-right): high win & ITM — reliable performers.
Place Threats (top-left): boards often but doesn’t win often — good exacta/trifecta angles.
Streaky (bottom-right): wins occasionally, misses the board often — all-or-nothing.
Developing (bottom-left): still finding form — longshot territory. - Reference Lines
- Dashed lines mark field averages. Dots to the right win more; dots higher board more.
- This horse
- Highlighted with a gold border and larger dot.
AI Model Comparison
- Winner Models (green)
- Mod1(W), Mod2(W), and Mod3(W) trained to predict race winners. Higher score = stronger contender.
- Longshot Models (red)
- Mod1-LS, Mod2-LS, and Mod3-LS trained to find high-value longshots. Higher score = stronger longshot candidate.
- Form Model (blue)
- Mod4 sequence model trained on recent form patterns. Higher score = stronger recent form profile.
- This horse
- Highlighted with a darker column background.
Race Pace Simulation Guide
- Slider
- Drag left→right to advance from gate to finish. Drag all the way back to reset the race.
- Predicted Finish Order
- Factors in contested pace burn, each horse’s effort curve (peaked-early vs. peaked-late), and wide trip cost from outside posts. Updated live when Track Bias changes.
- Pace Scenario
- Lone Speed: single E horse likely rates and holds. Contested: two E horses burn each other — closers benefit. Hot Pace: speed meltdown, deep closers thrive. Soft: no early speed, moderate fractions throughout.
- Track Bias
- Slider below canvas. −2 = strong closer/wet bias; +2 = strong speed/rail bias. Recomputes the predicted finish order.
- Boxed Indicator
- Dashed orange ring = horse is surrounded (rival ahead, rival behind, wall outside). In a real race this horse must find a clear path to run.
- Running Styles
- E/EE = early speed (rushes to rail). P = presser (stalks the pace). S = stalker. SS = slow starter / closer.
| Stat | vs. Current Card | vs. All Horses |
|---|---|---|
| Averages
Career-average metrics across all AI race analysis. Performance and pace averages reflect estimated historical performance; trainer and jockey grades score in-the-money percentages. Grading scale: A = elite • B = above average • C = average • D = below average • F = poor • — = no data |
||
| Pick Pony AI Rating | B | B |
| Pace Trip Longshot | — | — |
| Connections Longshot | — | — |
| Situational Longshot | — | — |
| Speed | A | B |
| Early Pace | A | B |
| Mid Pace | A | C |
| Late Pace | A | A |
| Finish Pos | A | B |
| Dirt Speed | A | B |
| Turf Speed | F | D |
| Distance Speed | A | B |
| Trainer Effectiveness | B | B |
| Jockey Effectiveness | C | B |
| 3rd Party Ratings | C | C |
| Recent
Performance analysis from the horse's recent races, weighted to reflect current form. Sprint and Route FPS (Foot Per Second) measure pace efficiency over the horse's recent sprints and routes respectively. Grading scale: A = elite • B = above average • C = average • D = below average • F = poor • — = no data |
||
| Speed | A | B |
| Early Pace | D | C |
| Mid Pace | B | C |
| Late Pace | A | A |
| Sprint FPS | C | C |
| Route FPS | B | C |
| Trainer Effectiveness | B | B |
| Jockey Effectiveness | C | B |
| 3rd Party Ratings | C | C |
| Predictions
AI-generated projections for the upcoming race, derived from prior AI analysis for speed and pace trends, surface and distance suitability, and current conditions. Grading scale: A = elite • B = above average • C = average • D = below average • F = poor • — = no data |
||
| Speed | A | C |
| Early Pace | A | B |
| Mid Pace | A | B |
| Late Pace | C | C |
Chart Guide (2.0.36)
- Bubbles
- Color = surface: green (turf), brown (dirt), blue (synthetic)
- Top number = finishing position; bottom number in parentheses = starting post position
- Height above line = beaten lengths — closer means a smaller margin
- Border = track conditions: green (FST/GD/FM), yellow (WF/SL/YLD), red (SY/MY/FRZ/SFT/HVY)
- Connecting Line
- Solid = good conditions; dashed = bad conditions
- Line Symbol
- ▲ Triangle = sprint (7f or less); ● Circle = route (more than 7f)
- Days Between Races
- Small number above each bubble (e.g. 19d) = days since the previous race — helps spot freshness, layoffs, and tight scheduling.
- Shaded Band (Bollinger)
- Highlights volatility — a wider band means more variation in recent performance
- Performance Trend
- Straight line showing the overall performance direction — angled up = improving, angled down = declining
- Dashed Reference Line
- AI Opponent = AI analysis class-level par for the race
AI Model History Guide
- Lines
- Each solid line shows this horse’s model score over its last 10 races: blue = Mod1, green = Mod2, amber = Mod3.
- Dashed Lines
- Dashed lines represent the current race’s field average for each model — a score below the dashed line indicates the horse ranked below average in this model’s assessment.
- Higher is Stronger
- All three model scores are 0–100: a higher number means the model rates this horse more favorably among the field.
Mod1(W): 82 (1/8) Mod2(W): 75 (2/8) Mod3(W): 79 (3/8) Mod1-LS: 55 (6/8) Win Prob: 18.4% Value Score: 1.35 ★
Performance vs. Peers Guide
- Bars (per post)
- Blue = avg career performance • Amber = avg last 3 races • Green = last race (improved vs. avg) • Red = last race (declined vs. avg)
- Trend Line
- Angled line above the bars: rising = improving form • falling = declining form.
- Horizontal Line
- Field average — the mean career performance of all horses in this race.
- Color Circles
- Standard post-position colors below each lane — same as the Total Pace chart.
- Border
- Thicker border = this horse’s post position.
Figure Comparison
- Rating
- The three Pick Pony algorithm ratings (Algo 1, Algo 2, Algo 3) that make up the overall PP AI Rating — higher is a stronger contender rating.
- Speed
- Career average speed, recent 3-race average, and last-race speed figure — spot horses in improving or declining form.
- Pace
- Average Early (E1), Mid (E2), and Stretch (LP) pace figures — reveals pace-setters vs. closers vs. all-the-way types.
- This horse
- The horse whose stats card is open is highlighted with a darker column background.
Winning Profiles
- Axes
- X: Win % from last 10 starts — Y: In-the-money % (top-3 finishes) from last 10 starts.
- Quadrants
- Consistent Winners (top-right): high win & ITM — reliable performers.
Place Threats (top-left): boards often but doesn’t win often — good exacta/trifecta angles.
Streaky (bottom-right): wins occasionally, misses the board often — all-or-nothing.
Developing (bottom-left): still finding form — longshot territory. - Reference Lines
- Dashed lines mark field averages. Dots to the right win more; dots higher board more.
- This horse
- Highlighted with a gold border and larger dot.
AI Model Comparison
- Winner Models (green)
- Mod1(W), Mod2(W), and Mod3(W) trained to predict race winners. Higher score = stronger contender.
- Longshot Models (red)
- Mod1-LS, Mod2-LS, and Mod3-LS trained to find high-value longshots. Higher score = stronger longshot candidate.
- Form Model (blue)
- Mod4 sequence model trained on recent form patterns. Higher score = stronger recent form profile.
- This horse
- Highlighted with a darker column background.
Race Pace Simulation Guide
- Slider
- Drag left→right to advance from gate to finish. Drag all the way back to reset the race.
- Predicted Finish Order
- Factors in contested pace burn, each horse’s effort curve (peaked-early vs. peaked-late), and wide trip cost from outside posts. Updated live when Track Bias changes.
- Pace Scenario
- Lone Speed: single E horse likely rates and holds. Contested: two E horses burn each other — closers benefit. Hot Pace: speed meltdown, deep closers thrive. Soft: no early speed, moderate fractions throughout.
- Track Bias
- Slider below canvas. −2 = strong closer/wet bias; +2 = strong speed/rail bias. Recomputes the predicted finish order.
- Boxed Indicator
- Dashed orange ring = horse is surrounded (rival ahead, rival behind, wall outside). In a real race this horse must find a clear path to run.
- Running Styles
- E/EE = early speed (rushes to rail). P = presser (stalks the pace). S = stalker. SS = slow starter / closer.
| Stat | vs. Current Card | vs. All Horses |
|---|---|---|
| Averages
Career-average metrics across all AI race analysis. Performance and pace averages reflect estimated historical performance; trainer and jockey grades score in-the-money percentages. Grading scale: A = elite • B = above average • C = average • D = below average • F = poor • — = no data |
||
| Pick Pony AI Rating | A | B |
| Pace Trip Longshot | — | — |
| Connections Longshot | — | — |
| Situational Longshot | — | — |
| Speed | A | C |
| Early Pace | B | B |
| Mid Pace | B | C |
| Late Pace | A | C |
| Finish Pos | A | B |
| Dirt Speed | B | C |
| Turf Speed | C | C |
| Distance Speed | A | B |
| Trainer Effectiveness | B | B |
| Jockey Effectiveness | B | A |
| 3rd Party Ratings | A | B |
| Recent
Performance analysis from the horse's recent races, weighted to reflect current form. Sprint and Route FPS (Foot Per Second) measure pace efficiency over the horse's recent sprints and routes respectively. Grading scale: A = elite • B = above average • C = average • D = below average • F = poor • — = no data |
||
| Speed | C | C |
| Early Pace | A | C |
| Mid Pace | C | C |
| Late Pace | C | C |
| Sprint FPS | A | C |
| Route FPS | D | C |
| Trainer Effectiveness | B | B |
| Jockey Effectiveness | B | A |
| 3rd Party Ratings | A | B |
| Predictions
AI-generated projections for the upcoming race, derived from prior AI analysis for speed and pace trends, surface and distance suitability, and current conditions. Grading scale: A = elite • B = above average • C = average • D = below average • F = poor • — = no data |
||
| Speed | A | B |
| Early Pace | B | B |
| Mid Pace | B | C |
| Late Pace | C | C |
Chart Guide (2.0.36)
- Bubbles
- Color = surface: green (turf), brown (dirt), blue (synthetic)
- Top number = finishing position; bottom number in parentheses = starting post position
- Height above line = beaten lengths — closer means a smaller margin
- Border = track conditions: green (FST/GD/FM), yellow (WF/SL/YLD), red (SY/MY/FRZ/SFT/HVY)
- Connecting Line
- Solid = good conditions; dashed = bad conditions
- Line Symbol
- ▲ Triangle = sprint (7f or less); ● Circle = route (more than 7f)
- Days Between Races
- Small number above each bubble (e.g. 19d) = days since the previous race — helps spot freshness, layoffs, and tight scheduling.
- Shaded Band (Bollinger)
- Highlights volatility — a wider band means more variation in recent performance
- Performance Trend
- Straight line showing the overall performance direction — angled up = improving, angled down = declining
- Dashed Reference Line
- AI Opponent = AI analysis class-level par for the race
AI Model History Guide
- Lines
- Each solid line shows this horse’s model score over its last 10 races: blue = Mod1, green = Mod2, amber = Mod3.
- Dashed Lines
- Dashed lines represent the current race’s field average for each model — a score below the dashed line indicates the horse ranked below average in this model’s assessment.
- Higher is Stronger
- All three model scores are 0–100: a higher number means the model rates this horse more favorably among the field.
Mod1(W): 82 (1/8) Mod2(W): 75 (2/8) Mod3(W): 79 (3/8) Mod1-LS: 55 (6/8) Win Prob: 18.4% Value Score: 1.35 ★
Performance vs. Peers Guide
- Bars (per post)
- Blue = avg career performance • Amber = avg last 3 races • Green = last race (improved vs. avg) • Red = last race (declined vs. avg)
- Trend Line
- Angled line above the bars: rising = improving form • falling = declining form.
- Horizontal Line
- Field average — the mean career performance of all horses in this race.
- Color Circles
- Standard post-position colors below each lane — same as the Total Pace chart.
- Border
- Thicker border = this horse’s post position.
Figure Comparison
- Rating
- The three Pick Pony algorithm ratings (Algo 1, Algo 2, Algo 3) that make up the overall PP AI Rating — higher is a stronger contender rating.
- Speed
- Career average speed, recent 3-race average, and last-race speed figure — spot horses in improving or declining form.
- Pace
- Average Early (E1), Mid (E2), and Stretch (LP) pace figures — reveals pace-setters vs. closers vs. all-the-way types.
- This horse
- The horse whose stats card is open is highlighted with a darker column background.
Winning Profiles
- Axes
- X: Win % from last 10 starts — Y: In-the-money % (top-3 finishes) from last 10 starts.
- Quadrants
- Consistent Winners (top-right): high win & ITM — reliable performers.
Place Threats (top-left): boards often but doesn’t win often — good exacta/trifecta angles.
Streaky (bottom-right): wins occasionally, misses the board often — all-or-nothing.
Developing (bottom-left): still finding form — longshot territory. - Reference Lines
- Dashed lines mark field averages. Dots to the right win more; dots higher board more.
- This horse
- Highlighted with a gold border and larger dot.
AI Model Comparison
- Winner Models (green)
- Mod1(W), Mod2(W), and Mod3(W) trained to predict race winners. Higher score = stronger contender.
- Longshot Models (red)
- Mod1-LS, Mod2-LS, and Mod3-LS trained to find high-value longshots. Higher score = stronger longshot candidate.
- Form Model (blue)
- Mod4 sequence model trained on recent form patterns. Higher score = stronger recent form profile.
- This horse
- Highlighted with a darker column background.
Race Pace Simulation Guide
- Slider
- Drag left→right to advance from gate to finish. Drag all the way back to reset the race.
- Predicted Finish Order
- Factors in contested pace burn, each horse’s effort curve (peaked-early vs. peaked-late), and wide trip cost from outside posts. Updated live when Track Bias changes.
- Pace Scenario
- Lone Speed: single E horse likely rates and holds. Contested: two E horses burn each other — closers benefit. Hot Pace: speed meltdown, deep closers thrive. Soft: no early speed, moderate fractions throughout.
- Track Bias
- Slider below canvas. −2 = strong closer/wet bias; +2 = strong speed/rail bias. Recomputes the predicted finish order.
- Boxed Indicator
- Dashed orange ring = horse is surrounded (rival ahead, rival behind, wall outside). In a real race this horse must find a clear path to run.
- Running Styles
- E/EE = early speed (rushes to rail). P = presser (stalks the pace). S = stalker. SS = slow starter / closer.
| Stat | vs. Current Card | vs. All Horses |
|---|---|---|
| Averages
Career-average metrics across all AI race analysis. Performance and pace averages reflect estimated historical performance; trainer and jockey grades score in-the-money percentages. Grading scale: A = elite • B = above average • C = average • D = below average • F = poor • — = no data |
||
| Pick Pony AI Rating | D | D |
| Pace Trip Longshot | — | — |
| Connections Longshot | — | — |
| Situational Longshot | — | — |
| Speed | F | D |
| Early Pace | F | D |
| Mid Pace | F | D |
| Late Pace | D | C |
| Finish Pos | F | F |
| Dirt Speed | F | D |
| Turf Speed | C | B |
| Distance Speed | D | F |
| Trainer Effectiveness | C | D |
| Jockey Effectiveness | C | C |
| 3rd Party Ratings | D | D |
| Recent
Performance analysis from the horse's recent races, weighted to reflect current form. Sprint and Route FPS (Foot Per Second) measure pace efficiency over the horse's recent sprints and routes respectively. Grading scale: A = elite • B = above average • C = average • D = below average • F = poor • — = no data |
||
| Speed | F | D |
| Early Pace | F | D |
| Mid Pace | F | D |
| Late Pace | F | D |
| Sprint FPS | B | C |
| Route FPS | C | C |
| Trainer Effectiveness | C | D |
| Jockey Effectiveness | C | C |
| 3rd Party Ratings | D | D |
| Predictions
AI-generated projections for the upcoming race, derived from prior AI analysis for speed and pace trends, surface and distance suitability, and current conditions. Grading scale: A = elite • B = above average • C = average • D = below average • F = poor • — = no data |
||
| Speed | F | D |
| Early Pace | F | D |
| Mid Pace | F | D |
| Late Pace | C | C |
Chart Guide (2.0.36)
- Bubbles
- Color = surface: green (turf), brown (dirt), blue (synthetic)
- Top number = finishing position; bottom number in parentheses = starting post position
- Height above line = beaten lengths — closer means a smaller margin
- Border = track conditions: green (FST/GD/FM), yellow (WF/SL/YLD), red (SY/MY/FRZ/SFT/HVY)
- Connecting Line
- Solid = good conditions; dashed = bad conditions
- Line Symbol
- ▲ Triangle = sprint (7f or less); ● Circle = route (more than 7f)
- Days Between Races
- Small number above each bubble (e.g. 19d) = days since the previous race — helps spot freshness, layoffs, and tight scheduling.
- Shaded Band (Bollinger)
- Highlights volatility — a wider band means more variation in recent performance
- Performance Trend
- Straight line showing the overall performance direction — angled up = improving, angled down = declining
- Dashed Reference Line
- AI Opponent = AI analysis class-level par for the race
AI Model History Guide
- Lines
- Each solid line shows this horse’s model score over its last 10 races: blue = Mod1, green = Mod2, amber = Mod3.
- Dashed Lines
- Dashed lines represent the current race’s field average for each model — a score below the dashed line indicates the horse ranked below average in this model’s assessment.
- Higher is Stronger
- All three model scores are 0–100: a higher number means the model rates this horse more favorably among the field.
Mod1(W): 82 (1/8) Mod2(W): 75 (2/8) Mod3(W): 79 (3/8) Mod1-LS: 55 (6/8) Win Prob: 18.4% Value Score: 1.35 ★
Performance vs. Peers Guide
- Bars (per post)
- Blue = avg career performance • Amber = avg last 3 races • Green = last race (improved vs. avg) • Red = last race (declined vs. avg)
- Trend Line
- Angled line above the bars: rising = improving form • falling = declining form.
- Horizontal Line
- Field average — the mean career performance of all horses in this race.
- Color Circles
- Standard post-position colors below each lane — same as the Total Pace chart.
- Border
- Thicker border = this horse’s post position.
Figure Comparison
- Rating
- The three Pick Pony algorithm ratings (Algo 1, Algo 2, Algo 3) that make up the overall PP AI Rating — higher is a stronger contender rating.
- Speed
- Career average speed, recent 3-race average, and last-race speed figure — spot horses in improving or declining form.
- Pace
- Average Early (E1), Mid (E2), and Stretch (LP) pace figures — reveals pace-setters vs. closers vs. all-the-way types.
- This horse
- The horse whose stats card is open is highlighted with a darker column background.
Winning Profiles
- Axes
- X: Win % from last 10 starts — Y: In-the-money % (top-3 finishes) from last 10 starts.
- Quadrants
- Consistent Winners (top-right): high win & ITM — reliable performers.
Place Threats (top-left): boards often but doesn’t win often — good exacta/trifecta angles.
Streaky (bottom-right): wins occasionally, misses the board often — all-or-nothing.
Developing (bottom-left): still finding form — longshot territory. - Reference Lines
- Dashed lines mark field averages. Dots to the right win more; dots higher board more.
- This horse
- Highlighted with a gold border and larger dot.
AI Model Comparison
- Winner Models (green)
- Mod1(W), Mod2(W), and Mod3(W) trained to predict race winners. Higher score = stronger contender.
- Longshot Models (red)
- Mod1-LS, Mod2-LS, and Mod3-LS trained to find high-value longshots. Higher score = stronger longshot candidate.
- Form Model (blue)
- Mod4 sequence model trained on recent form patterns. Higher score = stronger recent form profile.
- This horse
- Highlighted with a darker column background.
Race Pace Simulation Guide
- Slider
- Drag left→right to advance from gate to finish. Drag all the way back to reset the race.
- Predicted Finish Order
- Factors in contested pace burn, each horse’s effort curve (peaked-early vs. peaked-late), and wide trip cost from outside posts. Updated live when Track Bias changes.
- Pace Scenario
- Lone Speed: single E horse likely rates and holds. Contested: two E horses burn each other — closers benefit. Hot Pace: speed meltdown, deep closers thrive. Soft: no early speed, moderate fractions throughout.
- Track Bias
- Slider below canvas. −2 = strong closer/wet bias; +2 = strong speed/rail bias. Recomputes the predicted finish order.
- Boxed Indicator
- Dashed orange ring = horse is surrounded (rival ahead, rival behind, wall outside). In a real race this horse must find a clear path to run.
- Running Styles
- E/EE = early speed (rushes to rail). P = presser (stalks the pace). S = stalker. SS = slow starter / closer.
| Stat | vs. Current Card | vs. All Horses |
|---|---|---|
| Averages
Career-average metrics across all AI race analysis. Performance and pace averages reflect estimated historical performance; trainer and jockey grades score in-the-money percentages. Grading scale: A = elite • B = above average • C = average • D = below average • F = poor • — = no data |
||
| Pick Pony AI Rating | B | C |
| Pace Trip Longshot | — | — |
| Connections Longshot | — | — |
| Situational Longshot | — | — |
| Speed | B | B |
| Early Pace | D | B |
| Mid Pace | D | B |
| Late Pace | C | B |
| Finish Pos | B | B |
| Dirt Speed | D | B |
| Turf Speed | C | B |
| Distance Speed | D | B |
| Trainer Effectiveness | D | F |
| Jockey Effectiveness | A | A |
| 3rd Party Ratings | D | C |
| Recent
Performance analysis from the horse's recent races, weighted to reflect current form. Sprint and Route FPS (Foot Per Second) measure pace efficiency over the horse's recent sprints and routes respectively. Grading scale: A = elite • B = above average • C = average • D = below average • F = poor • — = no data |
||
| Speed | C | B |
| Early Pace | D | A |
| Mid Pace | D | B |
| Late Pace | A | B |
| Sprint FPS | A | A |
| Route FPS | A | A |
| Trainer Effectiveness | D | F |
| Jockey Effectiveness | A | A |
| 3rd Party Ratings | D | C |
| Predictions
AI-generated projections for the upcoming race, derived from prior AI analysis for speed and pace trends, surface and distance suitability, and current conditions. Grading scale: A = elite • B = above average • C = average • D = below average • F = poor • — = no data |
||
| Speed | C | B |
| Early Pace | D | B |
| Mid Pace | C | B |
| Late Pace | C | C |
Chart Guide (2.0.36)
- Bubbles
- Color = surface: green (turf), brown (dirt), blue (synthetic)
- Top number = finishing position; bottom number in parentheses = starting post position
- Height above line = beaten lengths — closer means a smaller margin
- Border = track conditions: green (FST/GD/FM), yellow (WF/SL/YLD), red (SY/MY/FRZ/SFT/HVY)
- Connecting Line
- Solid = good conditions; dashed = bad conditions
- Line Symbol
- ▲ Triangle = sprint (7f or less); ● Circle = route (more than 7f)
- Days Between Races
- Small number above each bubble (e.g. 19d) = days since the previous race — helps spot freshness, layoffs, and tight scheduling.
- Shaded Band (Bollinger)
- Highlights volatility — a wider band means more variation in recent performance
- Performance Trend
- Straight line showing the overall performance direction — angled up = improving, angled down = declining
- Dashed Reference Line
- AI Opponent = AI analysis class-level par for the race
AI Model History Guide
- Lines
- Each solid line shows this horse’s model score over its last 10 races: blue = Mod1, green = Mod2, amber = Mod3.
- Dashed Lines
- Dashed lines represent the current race’s field average for each model — a score below the dashed line indicates the horse ranked below average in this model’s assessment.
- Higher is Stronger
- All three model scores are 0–100: a higher number means the model rates this horse more favorably among the field.
Mod1(W): 82 (1/8) Mod2(W): 75 (2/8) Mod3(W): 79 (3/8) Mod1-LS: 55 (6/8) Win Prob: 18.4% Value Score: 1.35 ★
Performance vs. Peers Guide
- Bars (per post)
- Blue = avg career performance • Amber = avg last 3 races • Green = last race (improved vs. avg) • Red = last race (declined vs. avg)
- Trend Line
- Angled line above the bars: rising = improving form • falling = declining form.
- Horizontal Line
- Field average — the mean career performance of all horses in this race.
- Color Circles
- Standard post-position colors below each lane — same as the Total Pace chart.
- Border
- Thicker border = this horse’s post position.
Figure Comparison
- Rating
- The three Pick Pony algorithm ratings (Algo 1, Algo 2, Algo 3) that make up the overall PP AI Rating — higher is a stronger contender rating.
- Speed
- Career average speed, recent 3-race average, and last-race speed figure — spot horses in improving or declining form.
- Pace
- Average Early (E1), Mid (E2), and Stretch (LP) pace figures — reveals pace-setters vs. closers vs. all-the-way types.
- This horse
- The horse whose stats card is open is highlighted with a darker column background.
Winning Profiles
- Axes
- X: Win % from last 10 starts — Y: In-the-money % (top-3 finishes) from last 10 starts.
- Quadrants
- Consistent Winners (top-right): high win & ITM — reliable performers.
Place Threats (top-left): boards often but doesn’t win often — good exacta/trifecta angles.
Streaky (bottom-right): wins occasionally, misses the board often — all-or-nothing.
Developing (bottom-left): still finding form — longshot territory. - Reference Lines
- Dashed lines mark field averages. Dots to the right win more; dots higher board more.
- This horse
- Highlighted with a gold border and larger dot.
AI Model Comparison
- Winner Models (green)
- Mod1(W), Mod2(W), and Mod3(W) trained to predict race winners. Higher score = stronger contender.
- Longshot Models (red)
- Mod1-LS, Mod2-LS, and Mod3-LS trained to find high-value longshots. Higher score = stronger longshot candidate.
- Form Model (blue)
- Mod4 sequence model trained on recent form patterns. Higher score = stronger recent form profile.
- This horse
- Highlighted with a darker column background.
Race Pace Simulation Guide
- Slider
- Drag left→right to advance from gate to finish. Drag all the way back to reset the race.
- Predicted Finish Order
- Factors in contested pace burn, each horse’s effort curve (peaked-early vs. peaked-late), and wide trip cost from outside posts. Updated live when Track Bias changes.
- Pace Scenario
- Lone Speed: single E horse likely rates and holds. Contested: two E horses burn each other — closers benefit. Hot Pace: speed meltdown, deep closers thrive. Soft: no early speed, moderate fractions throughout.
- Track Bias
- Slider below canvas. −2 = strong closer/wet bias; +2 = strong speed/rail bias. Recomputes the predicted finish order.
- Boxed Indicator
- Dashed orange ring = horse is surrounded (rival ahead, rival behind, wall outside). In a real race this horse must find a clear path to run.
- Running Styles
- E/EE = early speed (rushes to rail). P = presser (stalks the pace). S = stalker. SS = slow starter / closer.
| Stat | vs. Current Card | vs. All Horses |
|---|---|---|
| Averages
Career-average metrics across all AI race analysis. Performance and pace averages reflect estimated historical performance; trainer and jockey grades score in-the-money percentages. Grading scale: A = elite • B = above average • C = average • D = below average • F = poor • — = no data |
||
| Pick Pony AI Rating | F | F |
| Pace Trip Longshot | — | — |
| Connections Longshot | — | — |
| Situational Longshot | — | — |
| Speed | C | C |
| Early Pace | D | B |
| Mid Pace | D | C |
| Late Pace | D | C |
| Finish Pos | D | C |
| Dirt Speed | F | C |
| Turf Speed | B | A |
| Distance Speed | F | C |
| Trainer Effectiveness | D | F |
| Jockey Effectiveness | B | A |
| 3rd Party Ratings | F | C |
| Recent
Performance analysis from the horse's recent races, weighted to reflect current form. Sprint and Route FPS (Foot Per Second) measure pace efficiency over the horse's recent sprints and routes respectively. Grading scale: A = elite • B = above average • C = average • D = below average • F = poor • — = no data |
||
| Speed | F | C |
| Early Pace | D | A |
| Mid Pace | F | C |
| Late Pace | D | C |
| Sprint FPS | B | A |
| Route FPS | A | A |
| Trainer Effectiveness | D | F |
| Jockey Effectiveness | B | A |
| 3rd Party Ratings | F | C |
| Predictions
AI-generated projections for the upcoming race, derived from prior AI analysis for speed and pace trends, surface and distance suitability, and current conditions. Grading scale: A = elite • B = above average • C = average • D = below average • F = poor • — = no data |
||
| Speed | D | C |
| Early Pace | D | B |
| Mid Pace | C | C |
| Late Pace | C | C |
Chart Guide (2.0.36)
- Bubbles
- Color = surface: green (turf), brown (dirt), blue (synthetic)
- Top number = finishing position; bottom number in parentheses = starting post position
- Height above line = beaten lengths — closer means a smaller margin
- Border = track conditions: green (FST/GD/FM), yellow (WF/SL/YLD), red (SY/MY/FRZ/SFT/HVY)
- Connecting Line
- Solid = good conditions; dashed = bad conditions
- Line Symbol
- ▲ Triangle = sprint (7f or less); ● Circle = route (more than 7f)
- Days Between Races
- Small number above each bubble (e.g. 19d) = days since the previous race — helps spot freshness, layoffs, and tight scheduling.
- Shaded Band (Bollinger)
- Highlights volatility — a wider band means more variation in recent performance
- Performance Trend
- Straight line showing the overall performance direction — angled up = improving, angled down = declining
- Dashed Reference Line
- AI Opponent = AI analysis class-level par for the race
AI Model History Guide
- Lines
- Each solid line shows this horse’s model score over its last 10 races: blue = Mod1, green = Mod2, amber = Mod3.
- Dashed Lines
- Dashed lines represent the current race’s field average for each model — a score below the dashed line indicates the horse ranked below average in this model’s assessment.
- Higher is Stronger
- All three model scores are 0–100: a higher number means the model rates this horse more favorably among the field.
Mod1(W): 82 (1/8) Mod2(W): 75 (2/8) Mod3(W): 79 (3/8) Mod1-LS: 55 (6/8) Win Prob: 18.4% Value Score: 1.35 ★
Performance vs. Peers Guide
- Bars (per post)
- Blue = avg career performance • Amber = avg last 3 races • Green = last race (improved vs. avg) • Red = last race (declined vs. avg)
- Trend Line
- Angled line above the bars: rising = improving form • falling = declining form.
- Horizontal Line
- Field average — the mean career performance of all horses in this race.
- Color Circles
- Standard post-position colors below each lane — same as the Total Pace chart.
- Border
- Thicker border = this horse’s post position.
Figure Comparison
- Rating
- The three Pick Pony algorithm ratings (Algo 1, Algo 2, Algo 3) that make up the overall PP AI Rating — higher is a stronger contender rating.
- Speed
- Career average speed, recent 3-race average, and last-race speed figure — spot horses in improving or declining form.
- Pace
- Average Early (E1), Mid (E2), and Stretch (LP) pace figures — reveals pace-setters vs. closers vs. all-the-way types.
- This horse
- The horse whose stats card is open is highlighted with a darker column background.
Winning Profiles
- Axes
- X: Win % from last 10 starts — Y: In-the-money % (top-3 finishes) from last 10 starts.
- Quadrants
- Consistent Winners (top-right): high win & ITM — reliable performers.
Place Threats (top-left): boards often but doesn’t win often — good exacta/trifecta angles.
Streaky (bottom-right): wins occasionally, misses the board often — all-or-nothing.
Developing (bottom-left): still finding form — longshot territory. - Reference Lines
- Dashed lines mark field averages. Dots to the right win more; dots higher board more.
- This horse
- Highlighted with a gold border and larger dot.
AI Model Comparison
- Winner Models (green)
- Mod1(W), Mod2(W), and Mod3(W) trained to predict race winners. Higher score = stronger contender.
- Longshot Models (red)
- Mod1-LS, Mod2-LS, and Mod3-LS trained to find high-value longshots. Higher score = stronger longshot candidate.
- Form Model (blue)
- Mod4 sequence model trained on recent form patterns. Higher score = stronger recent form profile.
- This horse
- Highlighted with a darker column background.
Race Pace Simulation Guide
- Slider
- Drag left→right to advance from gate to finish. Drag all the way back to reset the race.
- Predicted Finish Order
- Factors in contested pace burn, each horse’s effort curve (peaked-early vs. peaked-late), and wide trip cost from outside posts. Updated live when Track Bias changes.
- Pace Scenario
- Lone Speed: single E horse likely rates and holds. Contested: two E horses burn each other — closers benefit. Hot Pace: speed meltdown, deep closers thrive. Soft: no early speed, moderate fractions throughout.
- Track Bias
- Slider below canvas. −2 = strong closer/wet bias; +2 = strong speed/rail bias. Recomputes the predicted finish order.
- Boxed Indicator
- Dashed orange ring = horse is surrounded (rival ahead, rival behind, wall outside). In a real race this horse must find a clear path to run.
- Running Styles
- E/EE = early speed (rushes to rail). P = presser (stalks the pace). S = stalker. SS = slow starter / closer.
| Stat | vs. Current Card | vs. All Horses |
|---|---|---|
| Averages
Career-average metrics across all AI race analysis. Performance and pace averages reflect estimated historical performance; trainer and jockey grades score in-the-money percentages. Grading scale: A = elite • B = above average • C = average • D = below average • F = poor • — = no data |
||
| Pick Pony AI Rating | C | D |
| Pace Trip Longshot | — | — |
| Connections Longshot | — | — |
| Situational Longshot | — | — |
| Speed | F | F |
| Early Pace | A | A |
| Mid Pace | A | A |
| Late Pace | D | C |
| Finish Pos | A | B |
| Dirt Speed | C | A |
| Turf Speed | A | A |
| Distance Speed | C | A |
| Trainer Effectiveness | F | F |
| Jockey Effectiveness | D | D |
| 3rd Party Ratings | C | B |
| Recent
Performance analysis from the horse's recent races, weighted to reflect current form. Sprint and Route FPS (Foot Per Second) measure pace efficiency over the horse's recent sprints and routes respectively. Grading scale: A = elite • B = above average • C = average • D = below average • F = poor • — = no data |
||
| Speed | D | C |
| Early Pace | A | A |
| Mid Pace | A | A |
| Late Pace | F | C |
| Sprint FPS | D | B |
| Route FPS | D | B |
| Trainer Effectiveness | F | F |
| Jockey Effectiveness | D | D |
| 3rd Party Ratings | C | B |
| Predictions
AI-generated projections for the upcoming race, derived from prior AI analysis for speed and pace trends, surface and distance suitability, and current conditions. Grading scale: A = elite • B = above average • C = average • D = below average • F = poor • — = no data |
||
| Speed | B | B |
| Early Pace | B | A |
| Mid Pace | F | F |
| Late Pace | C | C |
Chart Guide (2.0.36)
- Bubbles
- Color = surface: green (turf), brown (dirt), blue (synthetic)
- Top number = finishing position; bottom number in parentheses = starting post position
- Height above line = beaten lengths — closer means a smaller margin
- Border = track conditions: green (FST/GD/FM), yellow (WF/SL/YLD), red (SY/MY/FRZ/SFT/HVY)
- Connecting Line
- Solid = good conditions; dashed = bad conditions
- Line Symbol
- ▲ Triangle = sprint (7f or less); ● Circle = route (more than 7f)
- Days Between Races
- Small number above each bubble (e.g. 19d) = days since the previous race — helps spot freshness, layoffs, and tight scheduling.
- Shaded Band (Bollinger)
- Highlights volatility — a wider band means more variation in recent performance
- Performance Trend
- Straight line showing the overall performance direction — angled up = improving, angled down = declining
- Dashed Reference Line
- AI Opponent = AI analysis class-level par for the race
AI Model History Guide
- Lines
- Each solid line shows this horse’s model score over its last 10 races: blue = Mod1, green = Mod2, amber = Mod3.
- Dashed Lines
- Dashed lines represent the current race’s field average for each model — a score below the dashed line indicates the horse ranked below average in this model’s assessment.
- Higher is Stronger
- All three model scores are 0–100: a higher number means the model rates this horse more favorably among the field.
Mod1(W): 82 (1/8) Mod2(W): 75 (2/8) Mod3(W): 79 (3/8) Mod1-LS: 55 (6/8) Win Prob: 18.4% Value Score: 1.35 ★
Performance vs. Peers Guide
- Bars (per post)
- Blue = avg career performance • Amber = avg last 3 races • Green = last race (improved vs. avg) • Red = last race (declined vs. avg)
- Trend Line
- Angled line above the bars: rising = improving form • falling = declining form.
- Horizontal Line
- Field average — the mean career performance of all horses in this race.
- Color Circles
- Standard post-position colors below each lane — same as the Total Pace chart.
- Border
- Thicker border = this horse’s post position.
Figure Comparison
- Rating
- The three Pick Pony algorithm ratings (Algo 1, Algo 2, Algo 3) that make up the overall PP AI Rating — higher is a stronger contender rating.
- Speed
- Career average speed, recent 3-race average, and last-race speed figure — spot horses in improving or declining form.
- Pace
- Average Early (E1), Mid (E2), and Stretch (LP) pace figures — reveals pace-setters vs. closers vs. all-the-way types.
- This horse
- The horse whose stats card is open is highlighted with a darker column background.
Winning Profiles
- Axes
- X: Win % from last 10 starts — Y: In-the-money % (top-3 finishes) from last 10 starts.
- Quadrants
- Consistent Winners (top-right): high win & ITM — reliable performers.
Place Threats (top-left): boards often but doesn’t win often — good exacta/trifecta angles.
Streaky (bottom-right): wins occasionally, misses the board often — all-or-nothing.
Developing (bottom-left): still finding form — longshot territory. - Reference Lines
- Dashed lines mark field averages. Dots to the right win more; dots higher board more.
- This horse
- Highlighted with a gold border and larger dot.
AI Model Comparison
- Winner Models (green)
- Mod1(W), Mod2(W), and Mod3(W) trained to predict race winners. Higher score = stronger contender.
- Longshot Models (red)
- Mod1-LS, Mod2-LS, and Mod3-LS trained to find high-value longshots. Higher score = stronger longshot candidate.
- Form Model (blue)
- Mod4 sequence model trained on recent form patterns. Higher score = stronger recent form profile.
- This horse
- Highlighted with a darker column background.
Race Pace Simulation Guide
- Slider
- Drag left→right to advance from gate to finish. Drag all the way back to reset the race.
- Predicted Finish Order
- Factors in contested pace burn, each horse’s effort curve (peaked-early vs. peaked-late), and wide trip cost from outside posts. Updated live when Track Bias changes.
- Pace Scenario
- Lone Speed: single E horse likely rates and holds. Contested: two E horses burn each other — closers benefit. Hot Pace: speed meltdown, deep closers thrive. Soft: no early speed, moderate fractions throughout.
- Track Bias
- Slider below canvas. −2 = strong closer/wet bias; +2 = strong speed/rail bias. Recomputes the predicted finish order.
- Boxed Indicator
- Dashed orange ring = horse is surrounded (rival ahead, rival behind, wall outside). In a real race this horse must find a clear path to run.
- Running Styles
- E/EE = early speed (rushes to rail). P = presser (stalks the pace). S = stalker. SS = slow starter / closer.
| Stat | vs. Current Card | vs. All Horses |
|---|---|---|
| Averages
Career-average metrics across all AI race analysis. Performance and pace averages reflect estimated historical performance; trainer and jockey grades score in-the-money percentages. Grading scale: A = elite • B = above average • C = average • D = below average • F = poor • — = no data |
||
| Pick Pony AI Rating | D | C |
| Pace Trip Longshot | — | — |
| Connections Longshot | — | — |
| Situational Longshot | — | — |
| Speed | B | C |
| Early Pace | A | A |
| Mid Pace | A | B |
| Late Pace | D | C |
| Finish Pos | A | B |
| Dirt Speed | D | B |
| Turf Speed | F | D |
| Distance Speed | C | B |
| Trainer Effectiveness | A | A |
| Jockey Effectiveness | A | A |
| 3rd Party Ratings | B | B |
| Recent
Performance analysis from the horse's recent races, weighted to reflect current form. Sprint and Route FPS (Foot Per Second) measure pace efficiency over the horse's recent sprints and routes respectively. Grading scale: A = elite • B = above average • C = average • D = below average • F = poor • — = no data |
||
| Speed | C | C |
| Early Pace | A | A |
| Mid Pace | A | A |
| Late Pace | F | D |
| Sprint FPS | A | A |
| Route FPS | B | B |
| Trainer Effectiveness | A | A |
| Jockey Effectiveness | A | A |
| 3rd Party Ratings | B | B |
| Predictions
AI-generated projections for the upcoming race, derived from prior AI analysis for speed and pace trends, surface and distance suitability, and current conditions. Grading scale: A = elite • B = above average • C = average • D = below average • F = poor • — = no data |
||
| Speed | B | C |
| Early Pace | A | B |
| Mid Pace | A | B |
| Late Pace | C | C |
Chart Guide (2.0.36)
- Bubbles
- Color = surface: green (turf), brown (dirt), blue (synthetic)
- Top number = finishing position; bottom number in parentheses = starting post position
- Height above line = beaten lengths — closer means a smaller margin
- Border = track conditions: green (FST/GD/FM), yellow (WF/SL/YLD), red (SY/MY/FRZ/SFT/HVY)
- Connecting Line
- Solid = good conditions; dashed = bad conditions
- Line Symbol
- ▲ Triangle = sprint (7f or less); ● Circle = route (more than 7f)
- Days Between Races
- Small number above each bubble (e.g. 19d) = days since the previous race — helps spot freshness, layoffs, and tight scheduling.
- Shaded Band (Bollinger)
- Highlights volatility — a wider band means more variation in recent performance
- Performance Trend
- Straight line showing the overall performance direction — angled up = improving, angled down = declining
- Dashed Reference Line
- AI Opponent = AI analysis class-level par for the race
AI Model History Guide
- Lines
- Each solid line shows this horse’s model score over its last 10 races: blue = Mod1, green = Mod2, amber = Mod3.
- Dashed Lines
- Dashed lines represent the current race’s field average for each model — a score below the dashed line indicates the horse ranked below average in this model’s assessment.
- Higher is Stronger
- All three model scores are 0–100: a higher number means the model rates this horse more favorably among the field.
Mod1(W): 82 (1/8) Mod2(W): 75 (2/8) Mod3(W): 79 (3/8) Mod1-LS: 55 (6/8) Win Prob: 18.4% Value Score: 1.35 ★
Performance vs. Peers Guide
- Bars (per post)
- Blue = avg career performance • Amber = avg last 3 races • Green = last race (improved vs. avg) • Red = last race (declined vs. avg)
- Trend Line
- Angled line above the bars: rising = improving form • falling = declining form.
- Horizontal Line
- Field average — the mean career performance of all horses in this race.
- Color Circles
- Standard post-position colors below each lane — same as the Total Pace chart.
- Border
- Thicker border = this horse’s post position.
Figure Comparison
- Rating
- The three Pick Pony algorithm ratings (Algo 1, Algo 2, Algo 3) that make up the overall PP AI Rating — higher is a stronger contender rating.
- Speed
- Career average speed, recent 3-race average, and last-race speed figure — spot horses in improving or declining form.
- Pace
- Average Early (E1), Mid (E2), and Stretch (LP) pace figures — reveals pace-setters vs. closers vs. all-the-way types.
- This horse
- The horse whose stats card is open is highlighted with a darker column background.
Winning Profiles
- Axes
- X: Win % from last 10 starts — Y: In-the-money % (top-3 finishes) from last 10 starts.
- Quadrants
- Consistent Winners (top-right): high win & ITM — reliable performers.
Place Threats (top-left): boards often but doesn’t win often — good exacta/trifecta angles.
Streaky (bottom-right): wins occasionally, misses the board often — all-or-nothing.
Developing (bottom-left): still finding form — longshot territory. - Reference Lines
- Dashed lines mark field averages. Dots to the right win more; dots higher board more.
- This horse
- Highlighted with a gold border and larger dot.
AI Model Comparison
- Winner Models (green)
- Mod1(W), Mod2(W), and Mod3(W) trained to predict race winners. Higher score = stronger contender.
- Longshot Models (red)
- Mod1-LS, Mod2-LS, and Mod3-LS trained to find high-value longshots. Higher score = stronger longshot candidate.
- Form Model (blue)
- Mod4 sequence model trained on recent form patterns. Higher score = stronger recent form profile.
- This horse
- Highlighted with a darker column background.
Race Pace Simulation Guide
- Slider
- Drag left→right to advance from gate to finish. Drag all the way back to reset the race.
- Predicted Finish Order
- Factors in contested pace burn, each horse’s effort curve (peaked-early vs. peaked-late), and wide trip cost from outside posts. Updated live when Track Bias changes.
- Pace Scenario
- Lone Speed: single E horse likely rates and holds. Contested: two E horses burn each other — closers benefit. Hot Pace: speed meltdown, deep closers thrive. Soft: no early speed, moderate fractions throughout.
- Track Bias
- Slider below canvas. −2 = strong closer/wet bias; +2 = strong speed/rail bias. Recomputes the predicted finish order.
- Boxed Indicator
- Dashed orange ring = horse is surrounded (rival ahead, rival behind, wall outside). In a real race this horse must find a clear path to run.
- Running Styles
- E/EE = early speed (rushes to rail). P = presser (stalks the pace). S = stalker. SS = slow starter / closer.
| Stat | vs. Current Card | vs. All Horses |
|---|---|---|
| Averages
Career-average metrics across all AI race analysis. Performance and pace averages reflect estimated historical performance; trainer and jockey grades score in-the-money percentages. Grading scale: A = elite • B = above average • C = average • D = below average • F = poor • — = no data |
||
| Pick Pony AI Rating | A | B |
| Pace Trip Longshot | — | — |
| Connections Longshot | — | — |
| Situational Longshot | — | — |
| Speed | D | C |
| Early Pace | C | C |
| Mid Pace | C | C |
| Late Pace | D | C |
| Finish Pos | D | D |
| Dirt Speed | D | B |
| Turf Speed | F | D |
| Distance Speed | A | A |
| Trainer Effectiveness | A | A |
| Jockey Effectiveness | C | C |
| 3rd Party Ratings | D | B |
| Recent
Performance analysis from the horse's recent races, weighted to reflect current form. Sprint and Route FPS (Foot Per Second) measure pace efficiency over the horse's recent sprints and routes respectively. Grading scale: A = elite • B = above average • C = average • D = below average • F = poor • — = no data |
||
| Speed | C | C |
| Early Pace | D | C |
| Mid Pace | C | C |
| Late Pace | C | B |
| Sprint FPS | D | B |
| Route FPS | B | B |
| Trainer Effectiveness | A | A |
| Jockey Effectiveness | C | C |
| 3rd Party Ratings | D | B |
| Predictions
AI-generated projections for the upcoming race, derived from prior AI analysis for speed and pace trends, surface and distance suitability, and current conditions. Grading scale: A = elite • B = above average • C = average • D = below average • F = poor • — = no data |
||
| Speed | D | C |
| Early Pace | C | B |
| Mid Pace | C | B |
| Late Pace | C | C |
Chart Guide (2.0.36)
- Bubbles
- Color = surface: green (turf), brown (dirt), blue (synthetic)
- Top number = finishing position; bottom number in parentheses = starting post position
- Height above line = beaten lengths — closer means a smaller margin
- Border = track conditions: green (FST/GD/FM), yellow (WF/SL/YLD), red (SY/MY/FRZ/SFT/HVY)
- Connecting Line
- Solid = good conditions; dashed = bad conditions
- Line Symbol
- ▲ Triangle = sprint (7f or less); ● Circle = route (more than 7f)
- Days Between Races
- Small number above each bubble (e.g. 19d) = days since the previous race — helps spot freshness, layoffs, and tight scheduling.
- Shaded Band (Bollinger)
- Highlights volatility — a wider band means more variation in recent performance
- Performance Trend
- Straight line showing the overall performance direction — angled up = improving, angled down = declining
- Dashed Reference Line
- AI Opponent = AI analysis class-level par for the race
AI Model History Guide
- Lines
- Each solid line shows this horse’s model score over its last 10 races: blue = Mod1, green = Mod2, amber = Mod3.
- Dashed Lines
- Dashed lines represent the current race’s field average for each model — a score below the dashed line indicates the horse ranked below average in this model’s assessment.
- Higher is Stronger
- All three model scores are 0–100: a higher number means the model rates this horse more favorably among the field.
Mod1(W): 82 (1/8) Mod2(W): 75 (2/8) Mod3(W): 79 (3/8) Mod1-LS: 55 (6/8) Win Prob: 18.4% Value Score: 1.35 ★
Performance vs. Peers Guide
- Bars (per post)
- Blue = avg career performance • Amber = avg last 3 races • Green = last race (improved vs. avg) • Red = last race (declined vs. avg)
- Trend Line
- Angled line above the bars: rising = improving form • falling = declining form.
- Horizontal Line
- Field average — the mean career performance of all horses in this race.
- Color Circles
- Standard post-position colors below each lane — same as the Total Pace chart.
- Border
- Thicker border = this horse’s post position.
Figure Comparison
- Rating
- The three Pick Pony algorithm ratings (Algo 1, Algo 2, Algo 3) that make up the overall PP AI Rating — higher is a stronger contender rating.
- Speed
- Career average speed, recent 3-race average, and last-race speed figure — spot horses in improving or declining form.
- Pace
- Average Early (E1), Mid (E2), and Stretch (LP) pace figures — reveals pace-setters vs. closers vs. all-the-way types.
- This horse
- The horse whose stats card is open is highlighted with a darker column background.
Winning Profiles
- Axes
- X: Win % from last 10 starts — Y: In-the-money % (top-3 finishes) from last 10 starts.
- Quadrants
- Consistent Winners (top-right): high win & ITM — reliable performers.
Place Threats (top-left): boards often but doesn’t win often — good exacta/trifecta angles.
Streaky (bottom-right): wins occasionally, misses the board often — all-or-nothing.
Developing (bottom-left): still finding form — longshot territory. - Reference Lines
- Dashed lines mark field averages. Dots to the right win more; dots higher board more.
- This horse
- Highlighted with a gold border and larger dot.
AI Model Comparison
- Winner Models (green)
- Mod1(W), Mod2(W), and Mod3(W) trained to predict race winners. Higher score = stronger contender.
- Longshot Models (red)
- Mod1-LS, Mod2-LS, and Mod3-LS trained to find high-value longshots. Higher score = stronger longshot candidate.
- Form Model (blue)
- Mod4 sequence model trained on recent form patterns. Higher score = stronger recent form profile.
- This horse
- Highlighted with a darker column background.
Race Pace Simulation Guide
- Slider
- Drag left→right to advance from gate to finish. Drag all the way back to reset the race.
- Predicted Finish Order
- Factors in contested pace burn, each horse’s effort curve (peaked-early vs. peaked-late), and wide trip cost from outside posts. Updated live when Track Bias changes.
- Pace Scenario
- Lone Speed: single E horse likely rates and holds. Contested: two E horses burn each other — closers benefit. Hot Pace: speed meltdown, deep closers thrive. Soft: no early speed, moderate fractions throughout.
- Track Bias
- Slider below canvas. −2 = strong closer/wet bias; +2 = strong speed/rail bias. Recomputes the predicted finish order.
- Boxed Indicator
- Dashed orange ring = horse is surrounded (rival ahead, rival behind, wall outside). In a real race this horse must find a clear path to run.
- Running Styles
- E/EE = early speed (rushes to rail). P = presser (stalks the pace). S = stalker. SS = slow starter / closer.
| Stat | vs. Current Card | vs. All Horses |
|---|---|---|
| Averages
Career-average metrics across all AI race analysis. Performance and pace averages reflect estimated historical performance; trainer and jockey grades score in-the-money percentages. Grading scale: A = elite • B = above average • C = average • D = below average • F = poor • — = no data |
||
| Pick Pony AI Rating | B | C |
| Pace Trip Longshot | — | — |
| Connections Longshot | — | — |
| Situational Longshot | — | — |
| Speed | A | B |
| Early Pace | A | A |
| Mid Pace | B | B |
| Late Pace | A | A |
| Finish Pos | B | B |
| Dirt Speed | A | B |
| Turf Speed | D | B |
| Distance Speed | F | B |
| Trainer Effectiveness | B | A |
| Jockey Effectiveness | A | A |
| 3rd Party Ratings | A | B |
| Recent
Performance analysis from the horse's recent races, weighted to reflect current form. Sprint and Route FPS (Foot Per Second) measure pace efficiency over the horse's recent sprints and routes respectively. Grading scale: A = elite • B = above average • C = average • D = below average • F = poor • — = no data |
||
| Speed | B | B |
| Early Pace | B | B |
| Mid Pace | B | C |
| Late Pace | A | A |
| Sprint FPS | B | A |
| Route FPS | D | B |
| Trainer Effectiveness | B | A |
| Jockey Effectiveness | A | A |
| 3rd Party Ratings | A | B |
| Predictions
AI-generated projections for the upcoming race, derived from prior AI analysis for speed and pace trends, surface and distance suitability, and current conditions. Grading scale: A = elite • B = above average • C = average • D = below average • F = poor • — = no data |
||
| Speed | A | B |
| Early Pace | A | A |
| Mid Pace | B | B |
| Late Pace | C | C |
Chart Guide (2.0.36)
- Bubbles
- Color = surface: green (turf), brown (dirt), blue (synthetic)
- Top number = finishing position; bottom number in parentheses = starting post position
- Height above line = beaten lengths — closer means a smaller margin
- Border = track conditions: green (FST/GD/FM), yellow (WF/SL/YLD), red (SY/MY/FRZ/SFT/HVY)
- Connecting Line
- Solid = good conditions; dashed = bad conditions
- Line Symbol
- ▲ Triangle = sprint (7f or less); ● Circle = route (more than 7f)
- Days Between Races
- Small number above each bubble (e.g. 19d) = days since the previous race — helps spot freshness, layoffs, and tight scheduling.
- Shaded Band (Bollinger)
- Highlights volatility — a wider band means more variation in recent performance
- Performance Trend
- Straight line showing the overall performance direction — angled up = improving, angled down = declining
- Dashed Reference Line
- AI Opponent = AI analysis class-level par for the race
AI Model History Guide
- Lines
- Each solid line shows this horse’s model score over its last 10 races: blue = Mod1, green = Mod2, amber = Mod3.
- Dashed Lines
- Dashed lines represent the current race’s field average for each model — a score below the dashed line indicates the horse ranked below average in this model’s assessment.
- Higher is Stronger
- All three model scores are 0–100: a higher number means the model rates this horse more favorably among the field.
Mod1(W): 82 (1/8) Mod2(W): 75 (2/8) Mod3(W): 79 (3/8) Mod1-LS: 55 (6/8) Win Prob: 18.4% Value Score: 1.35 ★
Performance vs. Peers Guide
- Bars (per post)
- Blue = avg career performance • Amber = avg last 3 races • Green = last race (improved vs. avg) • Red = last race (declined vs. avg)
- Trend Line
- Angled line above the bars: rising = improving form • falling = declining form.
- Horizontal Line
- Field average — the mean career performance of all horses in this race.
- Color Circles
- Standard post-position colors below each lane — same as the Total Pace chart.
- Border
- Thicker border = this horse’s post position.
Figure Comparison
- Rating
- The three Pick Pony algorithm ratings (Algo 1, Algo 2, Algo 3) that make up the overall PP AI Rating — higher is a stronger contender rating.
- Speed
- Career average speed, recent 3-race average, and last-race speed figure — spot horses in improving or declining form.
- Pace
- Average Early (E1), Mid (E2), and Stretch (LP) pace figures — reveals pace-setters vs. closers vs. all-the-way types.
- This horse
- The horse whose stats card is open is highlighted with a darker column background.
Winning Profiles
- Axes
- X: Win % from last 10 starts — Y: In-the-money % (top-3 finishes) from last 10 starts.
- Quadrants
- Consistent Winners (top-right): high win & ITM — reliable performers.
Place Threats (top-left): boards often but doesn’t win often — good exacta/trifecta angles.
Streaky (bottom-right): wins occasionally, misses the board often — all-or-nothing.
Developing (bottom-left): still finding form — longshot territory. - Reference Lines
- Dashed lines mark field averages. Dots to the right win more; dots higher board more.
- This horse
- Highlighted with a gold border and larger dot.
AI Model Comparison
- Winner Models (green)
- Mod1(W), Mod2(W), and Mod3(W) trained to predict race winners. Higher score = stronger contender.
- Longshot Models (red)
- Mod1-LS, Mod2-LS, and Mod3-LS trained to find high-value longshots. Higher score = stronger longshot candidate.
- Form Model (blue)
- Mod4 sequence model trained on recent form patterns. Higher score = stronger recent form profile.
- This horse
- Highlighted with a darker column background.
Race Pace Simulation Guide
- Slider
- Drag left→right to advance from gate to finish. Drag all the way back to reset the race.
- Predicted Finish Order
- Factors in contested pace burn, each horse’s effort curve (peaked-early vs. peaked-late), and wide trip cost from outside posts. Updated live when Track Bias changes.
- Pace Scenario
- Lone Speed: single E horse likely rates and holds. Contested: two E horses burn each other — closers benefit. Hot Pace: speed meltdown, deep closers thrive. Soft: no early speed, moderate fractions throughout.
- Track Bias
- Slider below canvas. −2 = strong closer/wet bias; +2 = strong speed/rail bias. Recomputes the predicted finish order.
- Boxed Indicator
- Dashed orange ring = horse is surrounded (rival ahead, rival behind, wall outside). In a real race this horse must find a clear path to run.
- Running Styles
- E/EE = early speed (rushes to rail). P = presser (stalks the pace). S = stalker. SS = slow starter / closer.
| Stat | vs. Current Card | vs. All Horses |
|---|---|---|
| Averages
Career-average metrics across all AI race analysis. Performance and pace averages reflect estimated historical performance; trainer and jockey grades score in-the-money percentages. Grading scale: A = elite • B = above average • C = average • D = below average • F = poor • — = no data |
||
| Pick Pony AI Rating | A | C |
| Pace Trip Longshot | — | — |
| Connections Longshot | — | — |
| Situational Longshot | — | — |
| Speed | A | C |
| Early Pace | B | A |
| Mid Pace | B | A |
| Late Pace | B | C |
| Finish Pos | B | B |
| Dirt Speed | C | C |
| Turf Speed | C | D |
| Distance Speed | B | C |
| Trainer Effectiveness | D | C |
| Jockey Effectiveness | B | B |
| 3rd Party Ratings | B | B |
| Recent
Performance analysis from the horse's recent races, weighted to reflect current form. Sprint and Route FPS (Foot Per Second) measure pace efficiency over the horse's recent sprints and routes respectively. Grading scale: A = elite • B = above average • C = average • D = below average • F = poor • — = no data |
||
| Speed | A | C |
| Early Pace | B | A |
| Mid Pace | B | B |
| Late Pace | B | C |
| Sprint FPS | C | C |
| Route FPS | C | C |
| Trainer Effectiveness | D | C |
| Jockey Effectiveness | B | B |
| 3rd Party Ratings | B | B |
| Predictions
AI-generated projections for the upcoming race, derived from prior AI analysis for speed and pace trends, surface and distance suitability, and current conditions. Grading scale: A = elite • B = above average • C = average • D = below average • F = poor • — = no data |
||
| Speed | A | A |
| Early Pace | B | A |
| Mid Pace | D | F |
| Late Pace | C | C |
Chart Guide (2.0.36)
- Bubbles
- Color = surface: green (turf), brown (dirt), blue (synthetic)
- Top number = finishing position; bottom number in parentheses = starting post position
- Height above line = beaten lengths — closer means a smaller margin
- Border = track conditions: green (FST/GD/FM), yellow (WF/SL/YLD), red (SY/MY/FRZ/SFT/HVY)
- Connecting Line
- Solid = good conditions; dashed = bad conditions
- Line Symbol
- ▲ Triangle = sprint (7f or less); ● Circle = route (more than 7f)
- Days Between Races
- Small number above each bubble (e.g. 19d) = days since the previous race — helps spot freshness, layoffs, and tight scheduling.
- Shaded Band (Bollinger)
- Highlights volatility — a wider band means more variation in recent performance
- Performance Trend
- Straight line showing the overall performance direction — angled up = improving, angled down = declining
- Dashed Reference Line
- AI Opponent = AI analysis class-level par for the race
AI Model History Guide
- Lines
- Each solid line shows this horse’s model score over its last 10 races: blue = Mod1, green = Mod2, amber = Mod3.
- Dashed Lines
- Dashed lines represent the current race’s field average for each model — a score below the dashed line indicates the horse ranked below average in this model’s assessment.
- Higher is Stronger
- All three model scores are 0–100: a higher number means the model rates this horse more favorably among the field.
Mod1(W): 82 (1/8) Mod2(W): 75 (2/8) Mod3(W): 79 (3/8) Mod1-LS: 55 (6/8) Win Prob: 18.4% Value Score: 1.35 ★
Performance vs. Peers Guide
- Bars (per post)
- Blue = avg career performance • Amber = avg last 3 races • Green = last race (improved vs. avg) • Red = last race (declined vs. avg)
- Trend Line
- Angled line above the bars: rising = improving form • falling = declining form.
- Horizontal Line
- Field average — the mean career performance of all horses in this race.
- Color Circles
- Standard post-position colors below each lane — same as the Total Pace chart.
- Border
- Thicker border = this horse’s post position.
Figure Comparison
- Rating
- The three Pick Pony algorithm ratings (Algo 1, Algo 2, Algo 3) that make up the overall PP AI Rating — higher is a stronger contender rating.
- Speed
- Career average speed, recent 3-race average, and last-race speed figure — spot horses in improving or declining form.
- Pace
- Average Early (E1), Mid (E2), and Stretch (LP) pace figures — reveals pace-setters vs. closers vs. all-the-way types.
- This horse
- The horse whose stats card is open is highlighted with a darker column background.
Winning Profiles
- Axes
- X: Win % from last 10 starts — Y: In-the-money % (top-3 finishes) from last 10 starts.
- Quadrants
- Consistent Winners (top-right): high win & ITM — reliable performers.
Place Threats (top-left): boards often but doesn’t win often — good exacta/trifecta angles.
Streaky (bottom-right): wins occasionally, misses the board often — all-or-nothing.
Developing (bottom-left): still finding form — longshot territory. - Reference Lines
- Dashed lines mark field averages. Dots to the right win more; dots higher board more.
- This horse
- Highlighted with a gold border and larger dot.
AI Model Comparison
- Winner Models (green)
- Mod1(W), Mod2(W), and Mod3(W) trained to predict race winners. Higher score = stronger contender.
- Longshot Models (red)
- Mod1-LS, Mod2-LS, and Mod3-LS trained to find high-value longshots. Higher score = stronger longshot candidate.
- Form Model (blue)
- Mod4 sequence model trained on recent form patterns. Higher score = stronger recent form profile.
- This horse
- Highlighted with a darker column background.
Race Pace Simulation Guide
- Slider
- Drag left→right to advance from gate to finish. Drag all the way back to reset the race.
- Predicted Finish Order
- Factors in contested pace burn, each horse’s effort curve (peaked-early vs. peaked-late), and wide trip cost from outside posts. Updated live when Track Bias changes.
- Pace Scenario
- Lone Speed: single E horse likely rates and holds. Contested: two E horses burn each other — closers benefit. Hot Pace: speed meltdown, deep closers thrive. Soft: no early speed, moderate fractions throughout.
- Track Bias
- Slider below canvas. −2 = strong closer/wet bias; +2 = strong speed/rail bias. Recomputes the predicted finish order.
- Boxed Indicator
- Dashed orange ring = horse is surrounded (rival ahead, rival behind, wall outside). In a real race this horse must find a clear path to run.
- Running Styles
- E/EE = early speed (rushes to rail). P = presser (stalks the pace). S = stalker. SS = slow starter / closer.
| Stat | vs. Current Card | vs. All Horses |
|---|---|---|
| Averages
Career-average metrics across all AI race analysis. Performance and pace averages reflect estimated historical performance; trainer and jockey grades score in-the-money percentages. Grading scale: A = elite • B = above average • C = average • D = below average • F = poor • — = no data |
||
| Pick Pony AI Rating | B | C |
| Pace Trip Longshot | — | — |
| Connections Longshot | — | — |
| Situational Longshot | — | — |
| Speed | B | C |
| Early Pace | D | B |
| Mid Pace | D | C |
| Late Pace | A | B |
| Finish Pos | A | B |
| Dirt Speed | B | C |
| Turf Speed | A | C |
| Distance Speed | B | C |
| Trainer Effectiveness | B | B |
| Jockey Effectiveness | A | A |
| 3rd Party Ratings | C | B |
| Recent
Performance analysis from the horse's recent races, weighted to reflect current form. Sprint and Route FPS (Foot Per Second) measure pace efficiency over the horse's recent sprints and routes respectively. Grading scale: A = elite • B = above average • C = average • D = below average • F = poor • — = no data |
||
| Speed | B | C |
| Early Pace | D | B |
| Mid Pace | D | C |
| Late Pace | A | B |
| Sprint FPS | F | D |
| Route FPS | F | D |
| Trainer Effectiveness | B | B |
| Jockey Effectiveness | A | A |
| 3rd Party Ratings | C | B |
| Predictions
AI-generated projections for the upcoming race, derived from prior AI analysis for speed and pace trends, surface and distance suitability, and current conditions. Grading scale: A = elite • B = above average • C = average • D = below average • F = poor • — = no data |
||
| Speed | C | C |
| Early Pace | D | C |
| Mid Pace | D | F |
| Late Pace | C | C |
Chart Guide (2.0.36)
- Bubbles
- Color = surface: green (turf), brown (dirt), blue (synthetic)
- Top number = finishing position; bottom number in parentheses = starting post position
- Height above line = beaten lengths — closer means a smaller margin
- Border = track conditions: green (FST/GD/FM), yellow (WF/SL/YLD), red (SY/MY/FRZ/SFT/HVY)
- Connecting Line
- Solid = good conditions; dashed = bad conditions
- Line Symbol
- ▲ Triangle = sprint (7f or less); ● Circle = route (more than 7f)
- Days Between Races
- Small number above each bubble (e.g. 19d) = days since the previous race — helps spot freshness, layoffs, and tight scheduling.
- Shaded Band (Bollinger)
- Highlights volatility — a wider band means more variation in recent performance
- Performance Trend
- Straight line showing the overall performance direction — angled up = improving, angled down = declining
- Dashed Reference Line
- AI Opponent = AI analysis class-level par for the race
AI Model History Guide
- Lines
- Each solid line shows this horse’s model score over its last 10 races: blue = Mod1, green = Mod2, amber = Mod3.
- Dashed Lines
- Dashed lines represent the current race’s field average for each model — a score below the dashed line indicates the horse ranked below average in this model’s assessment.
- Higher is Stronger
- All three model scores are 0–100: a higher number means the model rates this horse more favorably among the field.
Mod1(W): 82 (1/8) Mod2(W): 75 (2/8) Mod3(W): 79 (3/8) Mod1-LS: 55 (6/8) Win Prob: 18.4% Value Score: 1.35 ★
Performance vs. Peers Guide
- Bars (per post)
- Blue = avg career performance • Amber = avg last 3 races • Green = last race (improved vs. avg) • Red = last race (declined vs. avg)
- Trend Line
- Angled line above the bars: rising = improving form • falling = declining form.
- Horizontal Line
- Field average — the mean career performance of all horses in this race.
- Color Circles
- Standard post-position colors below each lane — same as the Total Pace chart.
- Border
- Thicker border = this horse’s post position.
Figure Comparison
- Rating
- The three Pick Pony algorithm ratings (Algo 1, Algo 2, Algo 3) that make up the overall PP AI Rating — higher is a stronger contender rating.
- Speed
- Career average speed, recent 3-race average, and last-race speed figure — spot horses in improving or declining form.
- Pace
- Average Early (E1), Mid (E2), and Stretch (LP) pace figures — reveals pace-setters vs. closers vs. all-the-way types.
- This horse
- The horse whose stats card is open is highlighted with a darker column background.
Winning Profiles
- Axes
- X: Win % from last 10 starts — Y: In-the-money % (top-3 finishes) from last 10 starts.
- Quadrants
- Consistent Winners (top-right): high win & ITM — reliable performers.
Place Threats (top-left): boards often but doesn’t win often — good exacta/trifecta angles.
Streaky (bottom-right): wins occasionally, misses the board often — all-or-nothing.
Developing (bottom-left): still finding form — longshot territory. - Reference Lines
- Dashed lines mark field averages. Dots to the right win more; dots higher board more.
- This horse
- Highlighted with a gold border and larger dot.
AI Model Comparison
- Winner Models (green)
- Mod1(W), Mod2(W), and Mod3(W) trained to predict race winners. Higher score = stronger contender.
- Longshot Models (red)
- Mod1-LS, Mod2-LS, and Mod3-LS trained to find high-value longshots. Higher score = stronger longshot candidate.
- Form Model (blue)
- Mod4 sequence model trained on recent form patterns. Higher score = stronger recent form profile.
- This horse
- Highlighted with a darker column background.
Race Pace Simulation Guide
- Slider
- Drag left→right to advance from gate to finish. Drag all the way back to reset the race.
- Predicted Finish Order
- Factors in contested pace burn, each horse’s effort curve (peaked-early vs. peaked-late), and wide trip cost from outside posts. Updated live when Track Bias changes.
- Pace Scenario
- Lone Speed: single E horse likely rates and holds. Contested: two E horses burn each other — closers benefit. Hot Pace: speed meltdown, deep closers thrive. Soft: no early speed, moderate fractions throughout.
- Track Bias
- Slider below canvas. −2 = strong closer/wet bias; +2 = strong speed/rail bias. Recomputes the predicted finish order.
- Boxed Indicator
- Dashed orange ring = horse is surrounded (rival ahead, rival behind, wall outside). In a real race this horse must find a clear path to run.
- Running Styles
- E/EE = early speed (rushes to rail). P = presser (stalks the pace). S = stalker. SS = slow starter / closer.
| Stat | vs. Current Card | vs. All Horses |
|---|---|---|
| Averages
Career-average metrics across all AI race analysis. Performance and pace averages reflect estimated historical performance; trainer and jockey grades score in-the-money percentages. Grading scale: A = elite • B = above average • C = average • D = below average • F = poor • — = no data |
||
| Pick Pony AI Rating | A | B |
| Pace Trip Longshot | — | — |
| Connections Longshot | — | — |
| Situational Longshot | — | — |
| Speed | A | B |
| Early Pace | A | A |
| Mid Pace | A | A |
| Late Pace | C | C |
| Finish Pos | A | B |
| Dirt Speed | A | A |
| Turf Speed | F | D |
| Distance Speed | A | B |
| Trainer Effectiveness | D | D |
| Jockey Effectiveness | F | F |
| 3rd Party Ratings | A | B |
| Recent
Performance analysis from the horse's recent races, weighted to reflect current form. Sprint and Route FPS (Foot Per Second) measure pace efficiency over the horse's recent sprints and routes respectively. Grading scale: A = elite • B = above average • C = average • D = below average • F = poor • — = no data |
||
| Speed | B | C |
| Early Pace | A | A |
| Mid Pace | A | A |
| Late Pace | C | C |
| Sprint FPS | A | A |
| Route FPS | A | A |
| Trainer Effectiveness | D | D |
| Jockey Effectiveness | F | F |
| 3rd Party Ratings | A | B |
| Predictions
AI-generated projections for the upcoming race, derived from prior AI analysis for speed and pace trends, surface and distance suitability, and current conditions. Grading scale: A = elite • B = above average • C = average • D = below average • F = poor • — = no data |
||
| Speed | A | B |
| Early Pace | A | A |
| Mid Pace | A | A |
| Late Pace | C | C |
Chart Guide (2.0.36)
- Bubbles
- Color = surface: green (turf), brown (dirt), blue (synthetic)
- Top number = finishing position; bottom number in parentheses = starting post position
- Height above line = beaten lengths — closer means a smaller margin
- Border = track conditions: green (FST/GD/FM), yellow (WF/SL/YLD), red (SY/MY/FRZ/SFT/HVY)
- Connecting Line
- Solid = good conditions; dashed = bad conditions
- Line Symbol
- ▲ Triangle = sprint (7f or less); ● Circle = route (more than 7f)
- Days Between Races
- Small number above each bubble (e.g. 19d) = days since the previous race — helps spot freshness, layoffs, and tight scheduling.
- Shaded Band (Bollinger)
- Highlights volatility — a wider band means more variation in recent performance
- Performance Trend
- Straight line showing the overall performance direction — angled up = improving, angled down = declining
- Dashed Reference Line
- AI Opponent = AI analysis class-level par for the race
AI Model History Guide
- Lines
- Each solid line shows this horse’s model score over its last 10 races: blue = Mod1, green = Mod2, amber = Mod3.
- Dashed Lines
- Dashed lines represent the current race’s field average for each model — a score below the dashed line indicates the horse ranked below average in this model’s assessment.
- Higher is Stronger
- All three model scores are 0–100: a higher number means the model rates this horse more favorably among the field.
Mod1(W): 82 (1/8) Mod2(W): 75 (2/8) Mod3(W): 79 (3/8) Mod1-LS: 55 (6/8) Win Prob: 18.4% Value Score: 1.35 ★
Performance vs. Peers Guide
- Bars (per post)
- Blue = avg career performance • Amber = avg last 3 races • Green = last race (improved vs. avg) • Red = last race (declined vs. avg)
- Trend Line
- Angled line above the bars: rising = improving form • falling = declining form.
- Horizontal Line
- Field average — the mean career performance of all horses in this race.
- Color Circles
- Standard post-position colors below each lane — same as the Total Pace chart.
- Border
- Thicker border = this horse’s post position.
Figure Comparison
- Rating
- The three Pick Pony algorithm ratings (Algo 1, Algo 2, Algo 3) that make up the overall PP AI Rating — higher is a stronger contender rating.
- Speed
- Career average speed, recent 3-race average, and last-race speed figure — spot horses in improving or declining form.
- Pace
- Average Early (E1), Mid (E2), and Stretch (LP) pace figures — reveals pace-setters vs. closers vs. all-the-way types.
- This horse
- The horse whose stats card is open is highlighted with a darker column background.
Winning Profiles
- Axes
- X: Win % from last 10 starts — Y: In-the-money % (top-3 finishes) from last 10 starts.
- Quadrants
- Consistent Winners (top-right): high win & ITM — reliable performers.
Place Threats (top-left): boards often but doesn’t win often — good exacta/trifecta angles.
Streaky (bottom-right): wins occasionally, misses the board often — all-or-nothing.
Developing (bottom-left): still finding form — longshot territory. - Reference Lines
- Dashed lines mark field averages. Dots to the right win more; dots higher board more.
- This horse
- Highlighted with a gold border and larger dot.
AI Model Comparison
- Winner Models (green)
- Mod1(W), Mod2(W), and Mod3(W) trained to predict race winners. Higher score = stronger contender.
- Longshot Models (red)
- Mod1-LS, Mod2-LS, and Mod3-LS trained to find high-value longshots. Higher score = stronger longshot candidate.
- Form Model (blue)
- Mod4 sequence model trained on recent form patterns. Higher score = stronger recent form profile.
- This horse
- Highlighted with a darker column background.
Race Pace Simulation Guide
- Slider
- Drag left→right to advance from gate to finish. Drag all the way back to reset the race.
- Predicted Finish Order
- Factors in contested pace burn, each horse’s effort curve (peaked-early vs. peaked-late), and wide trip cost from outside posts. Updated live when Track Bias changes.
- Pace Scenario
- Lone Speed: single E horse likely rates and holds. Contested: two E horses burn each other — closers benefit. Hot Pace: speed meltdown, deep closers thrive. Soft: no early speed, moderate fractions throughout.
- Track Bias
- Slider below canvas. −2 = strong closer/wet bias; +2 = strong speed/rail bias. Recomputes the predicted finish order.
- Boxed Indicator
- Dashed orange ring = horse is surrounded (rival ahead, rival behind, wall outside). In a real race this horse must find a clear path to run.
- Running Styles
- E/EE = early speed (rushes to rail). P = presser (stalks the pace). S = stalker. SS = slow starter / closer.
| Stat | vs. Current Card | vs. All Horses |
|---|---|---|
| Averages
Career-average metrics across all AI race analysis. Performance and pace averages reflect estimated historical performance; trainer and jockey grades score in-the-money percentages. Grading scale: A = elite • B = above average • C = average • D = below average • F = poor • — = no data |
||
| Pick Pony AI Rating | D | D |
| Pace Trip Longshot | — | — |
| Connections Longshot | — | — |
| Situational Longshot | — | — |
| Speed | C | D |
| Early Pace | A | A |
| Mid Pace | B | B |
| Late Pace | D | D |
| Finish Pos | F | F |
| Dirt Speed | D | C |
| Turf Speed | D | C |
| Distance Speed | F | F |
| Trainer Effectiveness | F | F |
| Jockey Effectiveness | D | D |
| 3rd Party Ratings | C | D |
| Recent
Performance analysis from the horse's recent races, weighted to reflect current form. Sprint and Route FPS (Foot Per Second) measure pace efficiency over the horse's recent sprints and routes respectively. Grading scale: A = elite • B = above average • C = average • D = below average • F = poor • — = no data |
||
| Speed | D | D |
| Early Pace | A | A |
| Mid Pace | C | C |
| Late Pace | F | D |
| Sprint FPS | A | A |
| Route FPS | B | A |
| Trainer Effectiveness | F | F |
| Jockey Effectiveness | D | D |
| 3rd Party Ratings | C | D |
| Predictions
AI-generated projections for the upcoming race, derived from prior AI analysis for speed and pace trends, surface and distance suitability, and current conditions. Grading scale: A = elite • B = above average • C = average • D = below average • F = poor • — = no data |
||
| Speed | D | D |
| Early Pace | A | A |
| Mid Pace | B | B |
| Late Pace | C | C |
Chart Guide (2.0.36)
- Bubbles
- Color = surface: green (turf), brown (dirt), blue (synthetic)
- Top number = finishing position; bottom number in parentheses = starting post position
- Height above line = beaten lengths — closer means a smaller margin
- Border = track conditions: green (FST/GD/FM), yellow (WF/SL/YLD), red (SY/MY/FRZ/SFT/HVY)
- Connecting Line
- Solid = good conditions; dashed = bad conditions
- Line Symbol
- ▲ Triangle = sprint (7f or less); ● Circle = route (more than 7f)
- Days Between Races
- Small number above each bubble (e.g. 19d) = days since the previous race — helps spot freshness, layoffs, and tight scheduling.
- Shaded Band (Bollinger)
- Highlights volatility — a wider band means more variation in recent performance
- Performance Trend
- Straight line showing the overall performance direction — angled up = improving, angled down = declining
- Dashed Reference Line
- AI Opponent = AI analysis class-level par for the race
AI Model History Guide
- Lines
- Each solid line shows this horse’s model score over its last 10 races: blue = Mod1, green = Mod2, amber = Mod3.
- Dashed Lines
- Dashed lines represent the current race’s field average for each model — a score below the dashed line indicates the horse ranked below average in this model’s assessment.
- Higher is Stronger
- All three model scores are 0–100: a higher number means the model rates this horse more favorably among the field.
Mod1(W): 82 (1/8) Mod2(W): 75 (2/8) Mod3(W): 79 (3/8) Mod1-LS: 55 (6/8) Win Prob: 18.4% Value Score: 1.35 ★
Performance vs. Peers Guide
- Bars (per post)
- Blue = avg career performance • Amber = avg last 3 races • Green = last race (improved vs. avg) • Red = last race (declined vs. avg)
- Trend Line
- Angled line above the bars: rising = improving form • falling = declining form.
- Horizontal Line
- Field average — the mean career performance of all horses in this race.
- Color Circles
- Standard post-position colors below each lane — same as the Total Pace chart.
- Border
- Thicker border = this horse’s post position.
Figure Comparison
- Rating
- The three Pick Pony algorithm ratings (Algo 1, Algo 2, Algo 3) that make up the overall PP AI Rating — higher is a stronger contender rating.
- Speed
- Career average speed, recent 3-race average, and last-race speed figure — spot horses in improving or declining form.
- Pace
- Average Early (E1), Mid (E2), and Stretch (LP) pace figures — reveals pace-setters vs. closers vs. all-the-way types.
- This horse
- The horse whose stats card is open is highlighted with a darker column background.
Winning Profiles
- Axes
- X: Win % from last 10 starts — Y: In-the-money % (top-3 finishes) from last 10 starts.
- Quadrants
- Consistent Winners (top-right): high win & ITM — reliable performers.
Place Threats (top-left): boards often but doesn’t win often — good exacta/trifecta angles.
Streaky (bottom-right): wins occasionally, misses the board often — all-or-nothing.
Developing (bottom-left): still finding form — longshot territory. - Reference Lines
- Dashed lines mark field averages. Dots to the right win more; dots higher board more.
- This horse
- Highlighted with a gold border and larger dot.
AI Model Comparison
- Winner Models (green)
- Mod1(W), Mod2(W), and Mod3(W) trained to predict race winners. Higher score = stronger contender.
- Longshot Models (red)
- Mod1-LS, Mod2-LS, and Mod3-LS trained to find high-value longshots. Higher score = stronger longshot candidate.
- Form Model (blue)
- Mod4 sequence model trained on recent form patterns. Higher score = stronger recent form profile.
- This horse
- Highlighted with a darker column background.
Race Pace Simulation Guide
- Slider
- Drag left→right to advance from gate to finish. Drag all the way back to reset the race.
- Predicted Finish Order
- Factors in contested pace burn, each horse’s effort curve (peaked-early vs. peaked-late), and wide trip cost from outside posts. Updated live when Track Bias changes.
- Pace Scenario
- Lone Speed: single E horse likely rates and holds. Contested: two E horses burn each other — closers benefit. Hot Pace: speed meltdown, deep closers thrive. Soft: no early speed, moderate fractions throughout.
- Track Bias
- Slider below canvas. −2 = strong closer/wet bias; +2 = strong speed/rail bias. Recomputes the predicted finish order.
- Boxed Indicator
- Dashed orange ring = horse is surrounded (rival ahead, rival behind, wall outside). In a real race this horse must find a clear path to run.
- Running Styles
- E/EE = early speed (rushes to rail). P = presser (stalks the pace). S = stalker. SS = slow starter / closer.
| Stat | vs. Current Card | vs. All Horses |
|---|---|---|
| Averages
Career-average metrics across all AI race analysis. Performance and pace averages reflect estimated historical performance; trainer and jockey grades score in-the-money percentages. Grading scale: A = elite • B = above average • C = average • D = below average • F = poor • — = no data |
||
| Pick Pony AI Rating | C | D |
| Pace Trip Longshot | — | — |
| Connections Longshot | — | — |
| Situational Longshot | — | — |
| Speed | F | D |
| Early Pace | B | B |
| Mid Pace | C | C |
| Late Pace | F | D |
| Finish Pos | B | C |
| Dirt Speed | D | C |
| Turf Speed | B | B |
| Distance Speed | C | C |
| Trainer Effectiveness | A | B |
| Jockey Effectiveness | C | C |
| 3rd Party Ratings | C | C |
| Recent
Performance analysis from the horse's recent races, weighted to reflect current form. Sprint and Route FPS (Foot Per Second) measure pace efficiency over the horse's recent sprints and routes respectively. Grading scale: A = elite • B = above average • C = average • D = below average • F = poor • — = no data |
||
| Speed | D | D |
| Early Pace | A | A |
| Mid Pace | A | B |
| Late Pace | F | D |
| Sprint FPS | B | A |
| Route FPS | A | A |
| Trainer Effectiveness | A | B |
| Jockey Effectiveness | C | C |
| 3rd Party Ratings | C | C |
| Predictions
AI-generated projections for the upcoming race, derived from prior AI analysis for speed and pace trends, surface and distance suitability, and current conditions. Grading scale: A = elite • B = above average • C = average • D = below average • F = poor • — = no data |
||
| Speed | F | D |
| Early Pace | B | B |
| Mid Pace | C | B |
| Late Pace | C | C |
TL;DR
Toggle
Get more in-depth analysis, expert picks, handicapper reports, AI picks, handicapping tools, in-article data tooltips, NO ADVERTISEMENTS, and other membership perks with a Pick Pony subscription!
Don’t forget Pick Pony’s Expert Picks, AI Picks, and Past Performance Sheets/Racing Forms!
The Pick Pony Handicapper's Report is published daily and provides analysis of all races on the card. A Pick Pony analyst prepares the report, so selections may differ from the Pick Pony Expert Picks, which are based on the consensus of all Pick Pony analysts.
Delta Downs hosts a nine-race card this evening under the lights in Vinton, Louisiana. The featured events include competitive allowance contests for Louisiana-breds and a deep slate of claiming races that offer excellent betting value. The “bullring” oval (6 furlongs) is known for its sharp turns and short stretch (660 feet), which typically creates a dynamic favoring horses with early tactical speed and inside post positions.
Weather and Track Conditions
Forecast: The weather for Vinton, Louisiana, calls for a 50-60% chance of showers and potential thunderstorms throughout the day. High temperatures will range from the mid-50s to low 60s.
Track Condition: With rain in the forecast, handicappers should be prepared for an Off Track (Sloppy or Muddy). If the track is sealed, it may play even faster than usual, further aiding front-runners.
Track Bias: Delta Downs is historically a speed-favoring surface. On a fast track, the rail (posts 1-3) is golden, especially in 5-furlong sprints. If the track comes up sloppy, the “sealed” surface often carries speed wire-to-wire. However, if the rail degrades, watch for a path bias emerging 2-3 paths off the rail.
Jockey Notes and Insights
- Tim Thornton: The perennial leading rider at Delta Downs continues to be a dominant force. He is exceptional at getting horses out of the gate and securing the rail, making him a must-use on speed horses in sprints.
- Vicente Del-Cid: A high-percentage rider who excels on both turf (when available) and dirt. He teams up frequently with top barns and is particularly dangerous on live longshots.
- Joel Dominguez: Known for aggressive riding, Dominguez is a strong asset on horses that need to be sent hard from the gate to clear traffic.
- Juan P. Vargas: A solid option for off-the-pace runners; look for him to pick up pieces if the pace collapses.
Trainer Notes and Insights
- Brett Brinkman: Brinkman's barn has been firing with consistency. He excels with Louisiana-breds and typically places his horses aggressively in claiming ranks.
- Isai V. Gonzalez: A high-volume trainer who sends out ready-to-run claimers. His horses often show improved speed figures off the claim.
- Jayde J. Gelner: Sharp with young horses (2YOs and 3YOs). His entries in maiden and allowance races deserve extra look, particularly those with “L” (Lasix) added or blinkers on.
Best Wagering Strategies and Value Plays
- The “Speed on the Rail” Angle: In the 5-furlong sprints (Races 1, 3, 6, 8), upgrade any horse with early speed drawing posts 1, 2, or 3.
- Pick 4 Strategy: The Late Pick 4 (Races 6-9) offers a mix of class levels. Single the “class droppers” in the optional claiming legs to afford coverage in the wide-open finales.
- Value Play: Look for Helladic in Race 6. In a race full of inconsistent claimers, this runner offers back-class appeal at a price.
Race 1
Post Time: 04:45 PM CST
Distance: 5 Furlongs Dirt
Class: Maiden Claiming $10,000
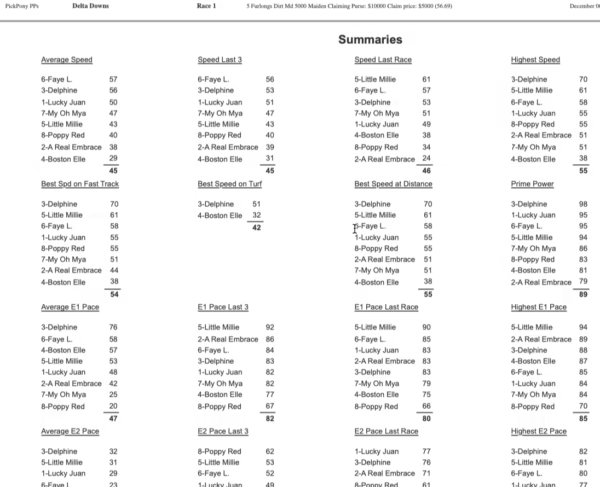
Pace Analysis
A 5-furlong dash for maidens often results in a scramble for the lead. Lucky Juan (1) draws the rail and will likely be sent hard by Del-Cid to protect position. Little Millie (5) possesses decent early foot and should challenge for the lead immediately.
Key Contenders
- Little Millie (5): Drops into a winnable spot and gets a positive rider switch. She has shown flashes of speed in tougher company and should be able to clear most of this field early.
- Lucky Juan (1): The rail draw is a massive advantage here. If she breaks clean, she could wire this field. Trainer Brett Brinkman is excellent at spotting maidens.
Secondary Choices
- Boston Elle (4): Has been knocking on the door. She may sit just off the pace and look to pounce if the leaders tire in the final furlong.
Selections
- Little Millie (5)
- Lucky Juan (1)
- Boston Elle (4)
Race 2
Post Time: 05:15 PM CST
Distance: 4 Furlongs Dirt
Class: Starter Optional Claiming $20,000
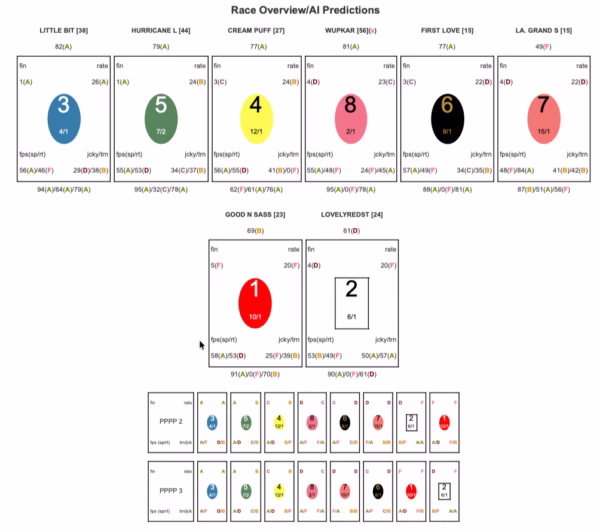
Pace Analysis
At the super-sprint distance of 4 furlongs, the break is everything. Wupkar (8) is a confirmed speedball who, despite the outside post, has the gas to clear this field. Good N Sassy (1) has the rail and will force the issue.
Key Contenders
- Wupkar (8): A consistent mare who thrives at Delta. She has the class edge over this field and her high cruising speed makes her the one to beat, even from the outside.
- Good N Sassy (1): Draws the rail with Tim Thornton aboard. That combination alone commands respect. She will likely play “catch me if you can.”
Secondary Choices
- Lovelyredstilettos (2): A veteran campaigner who can pick up the pieces if the top two duel each other into submission.
Selections
- Wupkar (8)
- Good N Sassy (1)
- Lovelyredstilettos (2)
Race 3
Post Time: 05:43 PM CST
Distance: 5 Furlongs Dirt
Class: Maiden Special Weight (LA Bred 2YO Fillies)
Pace Analysis
These 2-year-olds are still learning. Be Back Again (6) has shown professional speed in mornings and previous starts. Mae's Majesty (1) has the rail and breeding to be quick early.
Key Contenders
- Be Back Again (6): Comes in with strong form and looks ready to graduate. Joel Dominguez rides for Antonio Alberto, a team that performs well with juveniles.
- Mae's Majesty (1): The rail is a huge help for a young horse. If she breaks alertly, she can save ground and outkick the others home.
Longshots
- Meaner Than Mean (3): A first-time starter or lightly raced filly who could improve drastically. Watch the tote board for smart money.
Selections
- Be Back Again (6)
- Mae's Majesty (1)
- Meaner Than Mean (3)
Race 4
Post Time: 06:11 PM CST
Distance: 6 1/2 Furlongs Dirt
Class: Claiming $5,000 (N4L)
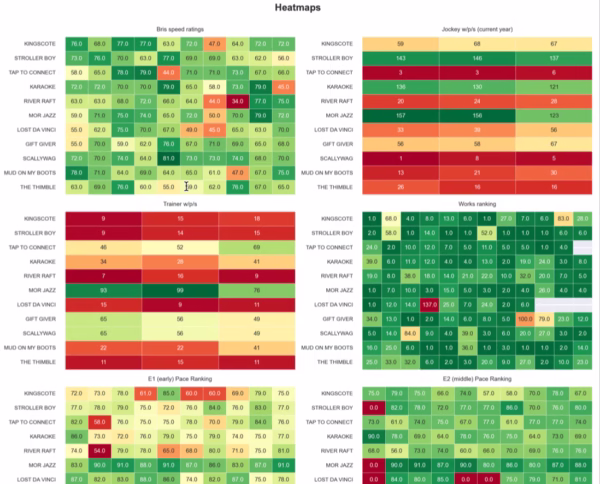
Pace Analysis
A lower-level claiming event with a mix of running styles. Gift Giver (8) has tactical speed and can sit outside horses. Karaoke (4) often shows early interest.
Key Contenders
- Gift Giver (8): Represents the Brett Brinkman barn and fits this condition perfectly. He should get a clean trip from the outside and wear down the early leaders.
- Karaoke (4): Consistent check-earner at this level. Elvin Gonzalez stays aboard, which is a positive sign.
Secondary Choices
- Kingscote (1): The rail horse could wake up with a ground-saving trip. At this low level, any horse that saves ground has a chance.
Selections
- Gift Giver (8)
- Karaoke (4)
- Kingscote (1)
Race 5
Post Time: 06:39 PM CST
Distance: 6 1/2 Furlongs Dirt
Class: Allowance (Fillies & Mares N2L)
Pace Analysis
My Boy Vander (1) draws the rail and is expected to use it. Easy For Me (2) is also quick, setting up a potential duel inside.
Key Contenders
- My Boy Vander (1): The primary speed of the race from the best post. Trainer Jayde Gelner places his horses well, and if she shakes loose, she's gone.
- Easy For Me (2): Will likely sit in the catbird seat right behind the rail horse. If the #1 falters, this one gets the first run.
Selections
- My Boy Vander (1)
- Easy For Me (2)
- Thousand Angels (6)
Race 6
Post Time: 07:04 PM CST
Distance: 5 Furlongs Dirt
Class: Starter Optional Claiming $10,000
Pace Analysis
A competitive sprint. Pinehurst (IRE) (6) has back class but has been inconsistent. Helladic (8) has shown flashes of high speed and drops into a spot where that speed can be dangerous.
Key Contenders
- Helladic (8): A potential value play. This 5-year-old gelding has the speed to clear the field and, at 5 furlongs, might never look back.
- Pinehurst (IRE) (6): The class of the field on paper, but 5 furlongs might be a bit sharp for him unless the pace melts down.
Secondary Choices
- Detective Bernardo (3): Draws well and gets Tim Thornton. That angle alone makes him a contender for the exotics.
Selections
- Helladic (8)
- Detective Bernardo (3)
- Pinehurst (IRE) (6)
Race 7
Post Time: 07:32 PM CST
Distance: 1 Mile Dirt
Class: Allowance (LA Bred Fillies & Mares)
Pace Analysis
In route races at Delta, the “two-turn” speed is critical. Miss Dealority (6) has stamina and speed. Lightofmaine (2) is a classy filly who should enjoy the distance.
Key Contenders
- Miss Dealority (6): A consistent runner who handles the two turns well. She should be near the lead throughout.
- Lightofmaine (2): Likely the classiest horse in the race. She has faced tougher company and fits comfortably here.
Longshots
- Warrior's Justice (1): With Tim Thornton and the rail in a route, she is a threat to steal it on the front end if left alone.
Selections
- Miss Dealority (6)
- Lightofmaine (2)
- Warrior's Justice (1)
Race 8
Post Time: 08:00 PM CST
Distance: 5 Furlongs Dirt
Class: Allowance Optional Claiming (LA Bred 2YO Fillies)
Pace Analysis
K G's Magic (5) and Appeal (4) look to be the main speed. This is a high-quality field for juveniles.
Key Contenders
- K G's Magic (5): Another Gelner trainee who looks poised to strike. Vicente Del-Cid riding is a major plus.
- Appeal (4): Gets Tim Thornton. Expect an aggressive ride.
Selections
- K G's Magic (5)
- Appeal (4)
- On The Horizon (1)
Race 9
Post Time: 08:28 PM CST
Distance: 6 1/2 Furlongs Dirt
Class: Claiming $5,000 (N3L)
Pace Analysis
A wide-open nightcap. Celtic Pride (1) has the rail and should be sent. Otter Creek (2) will be close by.
Key Contenders
- Celtic Pride (1): In these bottom-level claimers, the rail horse often holds on longer than expected. A solid pick to close out the card.
- Otter Creek (2): Sits just outside the favorite and should get a perfect stalking trip.
Selections
- Celtic Pride (1)
- Otter Creek (2)
- Night Stick (6)

Mod1(W): 82 (1/8) Mod2(W): 75 (2/8) Mod3(W): 79 (3/8) Mod1-LS: 55 (6/8) Win Prob: 18.4% Value Score: 1.35 ★