Chart Guide (2.0.36)
- Bubbles
- Color = surface: green (turf), brown (dirt), blue (synthetic)
- Top number = finishing position; bottom number in parentheses = starting post position
- Height above line = beaten lengths — closer means a smaller margin
- Border = track conditions: green (FST/GD/FM), yellow (WF/SL/YLD), red (SY/MY/FRZ/SFT/HVY)
- Connecting Line
- Solid = good conditions; dashed = bad conditions
- Line Symbol
- ▲ Triangle = sprint (7f or less); ● Circle = route (more than 7f)
- Days Between Races
- Small number above each bubble (e.g. 19d) = days since the previous race — helps spot freshness, layoffs, and tight scheduling.
- Shaded Band (Bollinger)
- Highlights volatility — a wider band means more variation in recent performance
- Performance Trend
- Straight line showing the overall performance direction — angled up = improving, angled down = declining
- Dashed Reference Line
- AI Opponent = AI analysis class-level par for the race
AI Model History Guide
- Lines
- Each solid line shows this horse’s model score over its last 10 races: blue = Mod1, green = Mod2, amber = Mod3.
- Dashed Lines
- Dashed lines represent the current race’s field average for each model — a score below the dashed line indicates the horse ranked below average in this model’s assessment.
- Higher is Stronger
- All three model scores are 0–100: a higher number means the model rates this horse more favorably among the field.
Performance vs. Peers Guide
- Bars (per post)
- Blue = avg career performance • Amber = avg last 3 races • Green = last race (improved vs. avg) • Red = last race (declined vs. avg)
- Trend Line
- Angled line above the bars: rising = improving form • falling = declining form.
- Horizontal Line
- Field average — the mean career performance of all horses in this race.
- Color Circles
- Standard post-position colors below each lane — same as the Total Pace chart.
- Border
- Thicker border = this horse’s post position.
Figure Comparison
- Rating
- The three Pick Pony algorithm ratings (Algo 1, Algo 2, Algo 3) that make up the overall PP AI Rating — higher is a stronger contender rating.
- Speed
- Career average speed, recent 3-race average, and last-race speed figure — spot horses in improving or declining form.
- Pace
- Average Early (E1), Mid (E2), and Stretch (LP) pace figures — reveals pace-setters vs. closers vs. all-the-way types.
- This horse
- The horse whose stats card is open is highlighted with a darker column background.
Winning Profiles
- Axes
- X: Win % from last 10 starts — Y: In-the-money % (top-3 finishes) from last 10 starts.
- Quadrants
- Consistent Winners (top-right): high win & ITM — reliable performers.
Place Threats (top-left): boards often but doesn’t win often — good exacta/trifecta angles.
Streaky (bottom-right): wins occasionally, misses the board often — all-or-nothing.
Developing (bottom-left): still finding form — longshot territory. - Reference Lines
- Dashed lines mark field averages. Dots to the right win more; dots higher board more.
- This horse
- Highlighted with a gold border and larger dot.
AI Model Comparison
- Winner Models (green)
- Mod1(W), Mod2(W), and Mod3(W) trained to predict race winners. Higher score = stronger contender.
- Longshot Models (red)
- Mod1-LS, Mod2-LS, and Mod3-LS trained to find high-value longshots. Higher score = stronger longshot candidate.
- Form Model (blue)
- Mod4 sequence model trained on recent form patterns. Higher score = stronger recent form profile.
- This horse
- Highlighted with a darker column background.
Race Pace Simulation Guide
- Slider
- Drag left→right to advance from gate to finish. Drag all the way back to reset the race.
- Predicted Finish Order
- Factors in contested pace burn, each horse’s effort curve (peaked-early vs. peaked-late), and wide trip cost from outside posts. Updated live when Track Bias changes.
- Pace Scenario
- Lone Speed: single E horse likely rates and holds. Contested: two E horses burn each other — closers benefit. Hot Pace: speed meltdown, deep closers thrive. Soft: no early speed, moderate fractions throughout.
- Track Bias
- Slider below canvas. −2 = strong closer/wet bias; +2 = strong speed/rail bias. Recomputes the predicted finish order.
- Boxed Indicator
- Dashed orange ring = horse is surrounded (rival ahead, rival behind, wall outside). In a real race this horse must find a clear path to run.
- Running Styles
- E/EE = early speed (rushes to rail). P = presser (stalks the pace). S = stalker. SS = slow starter / closer.
| Stat | vs. Current Card | vs. All Horses |
|---|---|---|
| Averages
Career-average metrics across all AI race analysis. Performance and pace averages reflect estimated historical performance; trainer and jockey grades score in-the-money percentages. Grading scale: A = elite • B = above average • C = average • D = below average • F = poor • — = no data |
||
| Pick Pony AI Rating | A | B |
| Pace Trip Longshot | — | — |
| Connections Longshot | — | — |
| Situational Longshot | — | — |
| Speed | D | F |
| Early Pace | A | B |
| Mid Pace | B | B |
| Late Pace | F | D |
| Finish Pos | B | D |
| Dirt Speed | D | C |
| Turf Speed | F | D |
| Distance Speed | C | C |
| Trainer Effectiveness | A | C |
| Jockey Effectiveness | B | C |
| 3rd Party Ratings | B | D |
| Recent
Performance analysis from the horse's recent races, weighted to reflect current form. Sprint and Route FPS (Foot Per Second) measure pace efficiency over the horse's recent sprints and routes respectively. Grading scale: A = elite • B = above average • C = average • D = below average • F = poor • — = no data |
||
| Speed | B | D |
| Early Pace | A | B |
| Mid Pace | A | B |
| Late Pace | C | D |
| Sprint FPS | B | B |
| Route FPS | A | B |
| Trainer Effectiveness | A | C |
| Jockey Effectiveness | B | C |
| 3rd Party Ratings | B | D |
| Predictions
AI-generated projections for the upcoming race, derived from prior AI analysis for speed and pace trends, surface and distance suitability, and current conditions. Grading scale: A = elite • B = above average • C = average • D = below average • F = poor • — = no data |
||
| Speed | D | F |
| Early Pace | A | B |
| Mid Pace | B | B |
| Late Pace | C | C |
Chart Guide (2.0.36)
- Bubbles
- Color = surface: green (turf), brown (dirt), blue (synthetic)
- Top number = finishing position; bottom number in parentheses = starting post position
- Height above line = beaten lengths — closer means a smaller margin
- Border = track conditions: green (FST/GD/FM), yellow (WF/SL/YLD), red (SY/MY/FRZ/SFT/HVY)
- Connecting Line
- Solid = good conditions; dashed = bad conditions
- Line Symbol
- ▲ Triangle = sprint (7f or less); ● Circle = route (more than 7f)
- Days Between Races
- Small number above each bubble (e.g. 19d) = days since the previous race — helps spot freshness, layoffs, and tight scheduling.
- Shaded Band (Bollinger)
- Highlights volatility — a wider band means more variation in recent performance
- Performance Trend
- Straight line showing the overall performance direction — angled up = improving, angled down = declining
- Dashed Reference Line
- AI Opponent = AI analysis class-level par for the race
AI Model History Guide
- Lines
- Each solid line shows this horse’s model score over its last 10 races: blue = Mod1, green = Mod2, amber = Mod3.
- Dashed Lines
- Dashed lines represent the current race’s field average for each model — a score below the dashed line indicates the horse ranked below average in this model’s assessment.
- Higher is Stronger
- All three model scores are 0–100: a higher number means the model rates this horse more favorably among the field.
Mod1(W): 82 (1/8) Mod2(W): 75 (2/8) Mod3(W): 79 (3/8) Mod1-LS: 55 (6/8) Win Prob: 18.4% Value Score: 1.35 ★
Performance vs. Peers Guide
- Bars (per post)
- Blue = avg career performance • Amber = avg last 3 races • Green = last race (improved vs. avg) • Red = last race (declined vs. avg)
- Trend Line
- Angled line above the bars: rising = improving form • falling = declining form.
- Horizontal Line
- Field average — the mean career performance of all horses in this race.
- Color Circles
- Standard post-position colors below each lane — same as the Total Pace chart.
- Border
- Thicker border = this horse’s post position.
Figure Comparison
- Rating
- The three Pick Pony algorithm ratings (Algo 1, Algo 2, Algo 3) that make up the overall PP AI Rating — higher is a stronger contender rating.
- Speed
- Career average speed, recent 3-race average, and last-race speed figure — spot horses in improving or declining form.
- Pace
- Average Early (E1), Mid (E2), and Stretch (LP) pace figures — reveals pace-setters vs. closers vs. all-the-way types.
- This horse
- The horse whose stats card is open is highlighted with a darker column background.
Winning Profiles
- Axes
- X: Win % from last 10 starts — Y: In-the-money % (top-3 finishes) from last 10 starts.
- Quadrants
- Consistent Winners (top-right): high win & ITM — reliable performers.
Place Threats (top-left): boards often but doesn’t win often — good exacta/trifecta angles.
Streaky (bottom-right): wins occasionally, misses the board often — all-or-nothing.
Developing (bottom-left): still finding form — longshot territory. - Reference Lines
- Dashed lines mark field averages. Dots to the right win more; dots higher board more.
- This horse
- Highlighted with a gold border and larger dot.
AI Model Comparison
- Winner Models (green)
- Mod1(W), Mod2(W), and Mod3(W) trained to predict race winners. Higher score = stronger contender.
- Longshot Models (red)
- Mod1-LS, Mod2-LS, and Mod3-LS trained to find high-value longshots. Higher score = stronger longshot candidate.
- Form Model (blue)
- Mod4 sequence model trained on recent form patterns. Higher score = stronger recent form profile.
- This horse
- Highlighted with a darker column background.
Race Pace Simulation Guide
- Slider
- Drag left→right to advance from gate to finish. Drag all the way back to reset the race.
- Predicted Finish Order
- Factors in contested pace burn, each horse’s effort curve (peaked-early vs. peaked-late), and wide trip cost from outside posts. Updated live when Track Bias changes.
- Pace Scenario
- Lone Speed: single E horse likely rates and holds. Contested: two E horses burn each other — closers benefit. Hot Pace: speed meltdown, deep closers thrive. Soft: no early speed, moderate fractions throughout.
- Track Bias
- Slider below canvas. −2 = strong closer/wet bias; +2 = strong speed/rail bias. Recomputes the predicted finish order.
- Boxed Indicator
- Dashed orange ring = horse is surrounded (rival ahead, rival behind, wall outside). In a real race this horse must find a clear path to run.
- Running Styles
- E/EE = early speed (rushes to rail). P = presser (stalks the pace). S = stalker. SS = slow starter / closer.
| Stat | vs. Current Card | vs. All Horses |
|---|---|---|
| Averages
Career-average metrics across all AI race analysis. Performance and pace averages reflect estimated historical performance; trainer and jockey grades score in-the-money percentages. Grading scale: A = elite • B = above average • C = average • D = below average • F = poor • — = no data |
||
| Pick Pony AI Rating | B | B |
| Pace Trip Longshot | — | — |
| Connections Longshot | — | — |
| Situational Longshot | — | — |
| Speed | D | F |
| Early Pace | A | A |
| Mid Pace | D | C |
| Late Pace | D | D |
| Finish Pos | F | F |
| Dirt Speed | C | C |
| Turf Speed | B | C |
| Distance Speed | F | F |
| Trainer Effectiveness | A | B |
| Jockey Effectiveness | A | A |
| 3rd Party Ratings | B | D |
| Recent
Performance analysis from the horse's recent races, weighted to reflect current form. Sprint and Route FPS (Foot Per Second) measure pace efficiency over the horse's recent sprints and routes respectively. Grading scale: A = elite • B = above average • C = average • D = below average • F = poor • — = no data |
||
| Speed | D | F |
| Early Pace | A | B |
| Mid Pace | C | C |
| Late Pace | F | D |
| Sprint FPS | A | A |
| Route FPS | B | C |
| Trainer Effectiveness | A | B |
| Jockey Effectiveness | A | A |
| 3rd Party Ratings | B | D |
| Predictions
AI-generated projections for the upcoming race, derived from prior AI analysis for speed and pace trends, surface and distance suitability, and current conditions. Grading scale: A = elite • B = above average • C = average • D = below average • F = poor • — = no data |
||
| Speed | F | F |
| Early Pace | A | A |
| Mid Pace | D | C |
| Late Pace | C | C |
Chart Guide (2.0.36)
- Bubbles
- Color = surface: green (turf), brown (dirt), blue (synthetic)
- Top number = finishing position; bottom number in parentheses = starting post position
- Height above line = beaten lengths — closer means a smaller margin
- Border = track conditions: green (FST/GD/FM), yellow (WF/SL/YLD), red (SY/MY/FRZ/SFT/HVY)
- Connecting Line
- Solid = good conditions; dashed = bad conditions
- Line Symbol
- ▲ Triangle = sprint (7f or less); ● Circle = route (more than 7f)
- Days Between Races
- Small number above each bubble (e.g. 19d) = days since the previous race — helps spot freshness, layoffs, and tight scheduling.
- Shaded Band (Bollinger)
- Highlights volatility — a wider band means more variation in recent performance
- Performance Trend
- Straight line showing the overall performance direction — angled up = improving, angled down = declining
- Dashed Reference Line
- AI Opponent = AI analysis class-level par for the race
AI Model History Guide
- Lines
- Each solid line shows this horse’s model score over its last 10 races: blue = Mod1, green = Mod2, amber = Mod3.
- Dashed Lines
- Dashed lines represent the current race’s field average for each model — a score below the dashed line indicates the horse ranked below average in this model’s assessment.
- Higher is Stronger
- All three model scores are 0–100: a higher number means the model rates this horse more favorably among the field.
Mod1(W): 82 (1/8) Mod2(W): 75 (2/8) Mod3(W): 79 (3/8) Mod1-LS: 55 (6/8) Win Prob: 18.4% Value Score: 1.35 ★
Performance vs. Peers Guide
- Bars (per post)
- Blue = avg career performance • Amber = avg last 3 races • Green = last race (improved vs. avg) • Red = last race (declined vs. avg)
- Trend Line
- Angled line above the bars: rising = improving form • falling = declining form.
- Horizontal Line
- Field average — the mean career performance of all horses in this race.
- Color Circles
- Standard post-position colors below each lane — same as the Total Pace chart.
- Border
- Thicker border = this horse’s post position.
Figure Comparison
- Rating
- The three Pick Pony algorithm ratings (Algo 1, Algo 2, Algo 3) that make up the overall PP AI Rating — higher is a stronger contender rating.
- Speed
- Career average speed, recent 3-race average, and last-race speed figure — spot horses in improving or declining form.
- Pace
- Average Early (E1), Mid (E2), and Stretch (LP) pace figures — reveals pace-setters vs. closers vs. all-the-way types.
- This horse
- The horse whose stats card is open is highlighted with a darker column background.
Winning Profiles
- Axes
- X: Win % from last 10 starts — Y: In-the-money % (top-3 finishes) from last 10 starts.
- Quadrants
- Consistent Winners (top-right): high win & ITM — reliable performers.
Place Threats (top-left): boards often but doesn’t win often — good exacta/trifecta angles.
Streaky (bottom-right): wins occasionally, misses the board often — all-or-nothing.
Developing (bottom-left): still finding form — longshot territory. - Reference Lines
- Dashed lines mark field averages. Dots to the right win more; dots higher board more.
- This horse
- Highlighted with a gold border and larger dot.
AI Model Comparison
- Winner Models (green)
- Mod1(W), Mod2(W), and Mod3(W) trained to predict race winners. Higher score = stronger contender.
- Longshot Models (red)
- Mod1-LS, Mod2-LS, and Mod3-LS trained to find high-value longshots. Higher score = stronger longshot candidate.
- Form Model (blue)
- Mod4 sequence model trained on recent form patterns. Higher score = stronger recent form profile.
- This horse
- Highlighted with a darker column background.
Race Pace Simulation Guide
- Slider
- Drag left→right to advance from gate to finish. Drag all the way back to reset the race.
- Predicted Finish Order
- Factors in contested pace burn, each horse’s effort curve (peaked-early vs. peaked-late), and wide trip cost from outside posts. Updated live when Track Bias changes.
- Pace Scenario
- Lone Speed: single E horse likely rates and holds. Contested: two E horses burn each other — closers benefit. Hot Pace: speed meltdown, deep closers thrive. Soft: no early speed, moderate fractions throughout.
- Track Bias
- Slider below canvas. −2 = strong closer/wet bias; +2 = strong speed/rail bias. Recomputes the predicted finish order.
- Boxed Indicator
- Dashed orange ring = horse is surrounded (rival ahead, rival behind, wall outside). In a real race this horse must find a clear path to run.
- Running Styles
- E/EE = early speed (rushes to rail). P = presser (stalks the pace). S = stalker. SS = slow starter / closer.
| Stat | vs. Current Card | vs. All Horses |
|---|---|---|
| Averages
Career-average metrics across all AI race analysis. Performance and pace averages reflect estimated historical performance; trainer and jockey grades score in-the-money percentages. Grading scale: A = elite • B = above average • C = average • D = below average • F = poor • — = no data |
||
| Pick Pony AI Rating | A | B |
| Pace Trip Longshot | — | — |
| Connections Longshot | — | — |
| Situational Longshot | — | — |
| Speed | A | C |
| Early Pace | B | B |
| Mid Pace | A | B |
| Late Pace | A | B |
| Finish Pos | A | C |
| Dirt Speed | A | B |
| Turf Speed | A | B |
| Distance Speed | A | B |
| Trainer Effectiveness | C | D |
| Jockey Effectiveness | B | B |
| 3rd Party Ratings | A | D |
| Recent
Performance analysis from the horse's recent races, weighted to reflect current form. Sprint and Route FPS (Foot Per Second) measure pace efficiency over the horse's recent sprints and routes respectively. Grading scale: A = elite • B = above average • C = average • D = below average • F = poor • — = no data |
||
| Speed | A | D |
| Early Pace | B | B |
| Mid Pace | A | B |
| Late Pace | A | C |
| Sprint FPS | D | C |
| Route FPS | D | C |
| Trainer Effectiveness | C | D |
| Jockey Effectiveness | B | B |
| 3rd Party Ratings | A | D |
| Predictions
AI-generated projections for the upcoming race, derived from prior AI analysis for speed and pace trends, surface and distance suitability, and current conditions. Grading scale: A = elite • B = above average • C = average • D = below average • F = poor • — = no data |
||
| Speed | A | C |
| Early Pace | B | B |
| Mid Pace | B | B |
| Late Pace | C | C |
Chart Guide (2.0.36)
- Bubbles
- Color = surface: green (turf), brown (dirt), blue (synthetic)
- Top number = finishing position; bottom number in parentheses = starting post position
- Height above line = beaten lengths — closer means a smaller margin
- Border = track conditions: green (FST/GD/FM), yellow (WF/SL/YLD), red (SY/MY/FRZ/SFT/HVY)
- Connecting Line
- Solid = good conditions; dashed = bad conditions
- Line Symbol
- ▲ Triangle = sprint (7f or less); ● Circle = route (more than 7f)
- Days Between Races
- Small number above each bubble (e.g. 19d) = days since the previous race — helps spot freshness, layoffs, and tight scheduling.
- Shaded Band (Bollinger)
- Highlights volatility — a wider band means more variation in recent performance
- Performance Trend
- Straight line showing the overall performance direction — angled up = improving, angled down = declining
- Dashed Reference Line
- AI Opponent = AI analysis class-level par for the race
AI Model History Guide
- Lines
- Each solid line shows this horse’s model score over its last 10 races: blue = Mod1, green = Mod2, amber = Mod3.
- Dashed Lines
- Dashed lines represent the current race’s field average for each model — a score below the dashed line indicates the horse ranked below average in this model’s assessment.
- Higher is Stronger
- All three model scores are 0–100: a higher number means the model rates this horse more favorably among the field.
Mod1(W): 82 (1/8) Mod2(W): 75 (2/8) Mod3(W): 79 (3/8) Mod1-LS: 55 (6/8) Win Prob: 18.4% Value Score: 1.35 ★
Performance vs. Peers Guide
- Bars (per post)
- Blue = avg career performance • Amber = avg last 3 races • Green = last race (improved vs. avg) • Red = last race (declined vs. avg)
- Trend Line
- Angled line above the bars: rising = improving form • falling = declining form.
- Horizontal Line
- Field average — the mean career performance of all horses in this race.
- Color Circles
- Standard post-position colors below each lane — same as the Total Pace chart.
- Border
- Thicker border = this horse’s post position.
Figure Comparison
- Rating
- The three Pick Pony algorithm ratings (Algo 1, Algo 2, Algo 3) that make up the overall PP AI Rating — higher is a stronger contender rating.
- Speed
- Career average speed, recent 3-race average, and last-race speed figure — spot horses in improving or declining form.
- Pace
- Average Early (E1), Mid (E2), and Stretch (LP) pace figures — reveals pace-setters vs. closers vs. all-the-way types.
- This horse
- The horse whose stats card is open is highlighted with a darker column background.
Winning Profiles
- Axes
- X: Win % from last 10 starts — Y: In-the-money % (top-3 finishes) from last 10 starts.
- Quadrants
- Consistent Winners (top-right): high win & ITM — reliable performers.
Place Threats (top-left): boards often but doesn’t win often — good exacta/trifecta angles.
Streaky (bottom-right): wins occasionally, misses the board often — all-or-nothing.
Developing (bottom-left): still finding form — longshot territory. - Reference Lines
- Dashed lines mark field averages. Dots to the right win more; dots higher board more.
- This horse
- Highlighted with a gold border and larger dot.
AI Model Comparison
- Winner Models (green)
- Mod1(W), Mod2(W), and Mod3(W) trained to predict race winners. Higher score = stronger contender.
- Longshot Models (red)
- Mod1-LS, Mod2-LS, and Mod3-LS trained to find high-value longshots. Higher score = stronger longshot candidate.
- Form Model (blue)
- Mod4 sequence model trained on recent form patterns. Higher score = stronger recent form profile.
- This horse
- Highlighted with a darker column background.
Race Pace Simulation Guide
- Slider
- Drag left→right to advance from gate to finish. Drag all the way back to reset the race.
- Predicted Finish Order
- Factors in contested pace burn, each horse’s effort curve (peaked-early vs. peaked-late), and wide trip cost from outside posts. Updated live when Track Bias changes.
- Pace Scenario
- Lone Speed: single E horse likely rates and holds. Contested: two E horses burn each other — closers benefit. Hot Pace: speed meltdown, deep closers thrive. Soft: no early speed, moderate fractions throughout.
- Track Bias
- Slider below canvas. −2 = strong closer/wet bias; +2 = strong speed/rail bias. Recomputes the predicted finish order.
- Boxed Indicator
- Dashed orange ring = horse is surrounded (rival ahead, rival behind, wall outside). In a real race this horse must find a clear path to run.
- Running Styles
- E/EE = early speed (rushes to rail). P = presser (stalks the pace). S = stalker. SS = slow starter / closer.
| Stat | vs. Current Card | vs. All Horses |
|---|---|---|
| Averages
Career-average metrics across all AI race analysis. Performance and pace averages reflect estimated historical performance; trainer and jockey grades score in-the-money percentages. Grading scale: A = elite • B = above average • C = average • D = below average • F = poor • — = no data |
||
| Pick Pony AI Rating | C | D |
| Pace Trip Longshot | — | — |
| Connections Longshot | — | — |
| Situational Longshot | — | — |
| Speed | B | C |
| Early Pace | A | B |
| Mid Pace | A | B |
| Late Pace | A | B |
| Finish Pos | C | D |
| Dirt Speed | C | B |
| Turf Speed | A | B |
| Distance Speed | C | B |
| Trainer Effectiveness | A | B |
| Jockey Effectiveness | D | C |
| 3rd Party Ratings | B | C |
| Recent
Performance analysis from the horse's recent races, weighted to reflect current form. Sprint and Route FPS (Foot Per Second) measure pace efficiency over the horse's recent sprints and routes respectively. Grading scale: A = elite • B = above average • C = average • D = below average • F = poor • — = no data |
||
| Speed | B | C |
| Early Pace | A | A |
| Mid Pace | C | B |
| Late Pace | B | B |
| Sprint FPS | C | C |
| Route FPS | D | C |
| Trainer Effectiveness | A | B |
| Jockey Effectiveness | D | C |
| 3rd Party Ratings | B | C |
| Predictions
AI-generated projections for the upcoming race, derived from prior AI analysis for speed and pace trends, surface and distance suitability, and current conditions. Grading scale: A = elite • B = above average • C = average • D = below average • F = poor • — = no data |
||
| Speed | A | C |
| Early Pace | A | B |
| Mid Pace | A | B |
| Late Pace | C | C |
Chart Guide (2.0.36)
- Bubbles
- Color = surface: green (turf), brown (dirt), blue (synthetic)
- Top number = finishing position; bottom number in parentheses = starting post position
- Height above line = beaten lengths — closer means a smaller margin
- Border = track conditions: green (FST/GD/FM), yellow (WF/SL/YLD), red (SY/MY/FRZ/SFT/HVY)
- Connecting Line
- Solid = good conditions; dashed = bad conditions
- Line Symbol
- ▲ Triangle = sprint (7f or less); ● Circle = route (more than 7f)
- Days Between Races
- Small number above each bubble (e.g. 19d) = days since the previous race — helps spot freshness, layoffs, and tight scheduling.
- Shaded Band (Bollinger)
- Highlights volatility — a wider band means more variation in recent performance
- Performance Trend
- Straight line showing the overall performance direction — angled up = improving, angled down = declining
- Dashed Reference Line
- AI Opponent = AI analysis class-level par for the race
AI Model History Guide
- Lines
- Each solid line shows this horse’s model score over its last 10 races: blue = Mod1, green = Mod2, amber = Mod3.
- Dashed Lines
- Dashed lines represent the current race’s field average for each model — a score below the dashed line indicates the horse ranked below average in this model’s assessment.
- Higher is Stronger
- All three model scores are 0–100: a higher number means the model rates this horse more favorably among the field.
Mod1(W): 82 (1/8) Mod2(W): 75 (2/8) Mod3(W): 79 (3/8) Mod1-LS: 55 (6/8) Win Prob: 18.4% Value Score: 1.35 ★
Performance vs. Peers Guide
- Bars (per post)
- Blue = avg career performance • Amber = avg last 3 races • Green = last race (improved vs. avg) • Red = last race (declined vs. avg)
- Trend Line
- Angled line above the bars: rising = improving form • falling = declining form.
- Horizontal Line
- Field average — the mean career performance of all horses in this race.
- Color Circles
- Standard post-position colors below each lane — same as the Total Pace chart.
- Border
- Thicker border = this horse’s post position.
Figure Comparison
- Rating
- The three Pick Pony algorithm ratings (Algo 1, Algo 2, Algo 3) that make up the overall PP AI Rating — higher is a stronger contender rating.
- Speed
- Career average speed, recent 3-race average, and last-race speed figure — spot horses in improving or declining form.
- Pace
- Average Early (E1), Mid (E2), and Stretch (LP) pace figures — reveals pace-setters vs. closers vs. all-the-way types.
- This horse
- The horse whose stats card is open is highlighted with a darker column background.
Winning Profiles
- Axes
- X: Win % from last 10 starts — Y: In-the-money % (top-3 finishes) from last 10 starts.
- Quadrants
- Consistent Winners (top-right): high win & ITM — reliable performers.
Place Threats (top-left): boards often but doesn’t win often — good exacta/trifecta angles.
Streaky (bottom-right): wins occasionally, misses the board often — all-or-nothing.
Developing (bottom-left): still finding form — longshot territory. - Reference Lines
- Dashed lines mark field averages. Dots to the right win more; dots higher board more.
- This horse
- Highlighted with a gold border and larger dot.
AI Model Comparison
- Winner Models (green)
- Mod1(W), Mod2(W), and Mod3(W) trained to predict race winners. Higher score = stronger contender.
- Longshot Models (red)
- Mod1-LS, Mod2-LS, and Mod3-LS trained to find high-value longshots. Higher score = stronger longshot candidate.
- Form Model (blue)
- Mod4 sequence model trained on recent form patterns. Higher score = stronger recent form profile.
- This horse
- Highlighted with a darker column background.
Race Pace Simulation Guide
- Slider
- Drag left→right to advance from gate to finish. Drag all the way back to reset the race.
- Predicted Finish Order
- Factors in contested pace burn, each horse’s effort curve (peaked-early vs. peaked-late), and wide trip cost from outside posts. Updated live when Track Bias changes.
- Pace Scenario
- Lone Speed: single E horse likely rates and holds. Contested: two E horses burn each other — closers benefit. Hot Pace: speed meltdown, deep closers thrive. Soft: no early speed, moderate fractions throughout.
- Track Bias
- Slider below canvas. −2 = strong closer/wet bias; +2 = strong speed/rail bias. Recomputes the predicted finish order.
- Boxed Indicator
- Dashed orange ring = horse is surrounded (rival ahead, rival behind, wall outside). In a real race this horse must find a clear path to run.
- Running Styles
- E/EE = early speed (rushes to rail). P = presser (stalks the pace). S = stalker. SS = slow starter / closer.
| Stat | vs. Current Card | vs. All Horses |
|---|---|---|
| Averages
Career-average metrics across all AI race analysis. Performance and pace averages reflect estimated historical performance; trainer and jockey grades score in-the-money percentages. Grading scale: A = elite • B = above average • C = average • D = below average • F = poor • — = no data |
||
| Pick Pony AI Rating | F | D |
| Pace Trip Longshot | — | — |
| Connections Longshot | — | — |
| Situational Longshot | — | — |
| Speed | F | D |
| Early Pace | D | C |
| Mid Pace | F | C |
| Late Pace | C | C |
| Finish Pos | C | D |
| Dirt Speed | F | C |
| Turf Speed | C | B |
| Distance Speed | D | C |
| Trainer Effectiveness | D | C |
| Jockey Effectiveness | C | B |
| 3rd Party Ratings | A | C |
| Recent
Performance analysis from the horse's recent races, weighted to reflect current form. Sprint and Route FPS (Foot Per Second) measure pace efficiency over the horse's recent sprints and routes respectively. Grading scale: A = elite • B = above average • C = average • D = below average • F = poor • — = no data |
||
| Speed | B | C |
| Early Pace | F | C |
| Mid Pace | D | B |
| Late Pace | A | B |
| Sprint FPS | D | C |
| Route FPS | C | C |
| Trainer Effectiveness | D | C |
| Jockey Effectiveness | C | B |
| 3rd Party Ratings | A | C |
| Predictions
AI-generated projections for the upcoming race, derived from prior AI analysis for speed and pace trends, surface and distance suitability, and current conditions. Grading scale: A = elite • B = above average • C = average • D = below average • F = poor • — = no data |
||
| Speed | F | D |
| Early Pace | C | C |
| Mid Pace | F | C |
| Late Pace | C | C |
Chart Guide (2.0.36)
- Bubbles
- Color = surface: green (turf), brown (dirt), blue (synthetic)
- Top number = finishing position; bottom number in parentheses = starting post position
- Height above line = beaten lengths — closer means a smaller margin
- Border = track conditions: green (FST/GD/FM), yellow (WF/SL/YLD), red (SY/MY/FRZ/SFT/HVY)
- Connecting Line
- Solid = good conditions; dashed = bad conditions
- Line Symbol
- ▲ Triangle = sprint (7f or less); ● Circle = route (more than 7f)
- Days Between Races
- Small number above each bubble (e.g. 19d) = days since the previous race — helps spot freshness, layoffs, and tight scheduling.
- Shaded Band (Bollinger)
- Highlights volatility — a wider band means more variation in recent performance
- Performance Trend
- Straight line showing the overall performance direction — angled up = improving, angled down = declining
- Dashed Reference Line
- AI Opponent = AI analysis class-level par for the race
AI Model History Guide
- Lines
- Each solid line shows this horse’s model score over its last 10 races: blue = Mod1, green = Mod2, amber = Mod3.
- Dashed Lines
- Dashed lines represent the current race’s field average for each model — a score below the dashed line indicates the horse ranked below average in this model’s assessment.
- Higher is Stronger
- All three model scores are 0–100: a higher number means the model rates this horse more favorably among the field.
Mod1(W): 82 (1/8) Mod2(W): 75 (2/8) Mod3(W): 79 (3/8) Mod1-LS: 55 (6/8) Win Prob: 18.4% Value Score: 1.35 ★
Performance vs. Peers Guide
- Bars (per post)
- Blue = avg career performance • Amber = avg last 3 races • Green = last race (improved vs. avg) • Red = last race (declined vs. avg)
- Trend Line
- Angled line above the bars: rising = improving form • falling = declining form.
- Horizontal Line
- Field average — the mean career performance of all horses in this race.
- Color Circles
- Standard post-position colors below each lane — same as the Total Pace chart.
- Border
- Thicker border = this horse’s post position.
Figure Comparison
- Rating
- The three Pick Pony algorithm ratings (Algo 1, Algo 2, Algo 3) that make up the overall PP AI Rating — higher is a stronger contender rating.
- Speed
- Career average speed, recent 3-race average, and last-race speed figure — spot horses in improving or declining form.
- Pace
- Average Early (E1), Mid (E2), and Stretch (LP) pace figures — reveals pace-setters vs. closers vs. all-the-way types.
- This horse
- The horse whose stats card is open is highlighted with a darker column background.
Winning Profiles
- Axes
- X: Win % from last 10 starts — Y: In-the-money % (top-3 finishes) from last 10 starts.
- Quadrants
- Consistent Winners (top-right): high win & ITM — reliable performers.
Place Threats (top-left): boards often but doesn’t win often — good exacta/trifecta angles.
Streaky (bottom-right): wins occasionally, misses the board often — all-or-nothing.
Developing (bottom-left): still finding form — longshot territory. - Reference Lines
- Dashed lines mark field averages. Dots to the right win more; dots higher board more.
- This horse
- Highlighted with a gold border and larger dot.
AI Model Comparison
- Winner Models (green)
- Mod1(W), Mod2(W), and Mod3(W) trained to predict race winners. Higher score = stronger contender.
- Longshot Models (red)
- Mod1-LS, Mod2-LS, and Mod3-LS trained to find high-value longshots. Higher score = stronger longshot candidate.
- Form Model (blue)
- Mod4 sequence model trained on recent form patterns. Higher score = stronger recent form profile.
- This horse
- Highlighted with a darker column background.
Race Pace Simulation Guide
- Slider
- Drag left→right to advance from gate to finish. Drag all the way back to reset the race.
- Predicted Finish Order
- Factors in contested pace burn, each horse’s effort curve (peaked-early vs. peaked-late), and wide trip cost from outside posts. Updated live when Track Bias changes.
- Pace Scenario
- Lone Speed: single E horse likely rates and holds. Contested: two E horses burn each other — closers benefit. Hot Pace: speed meltdown, deep closers thrive. Soft: no early speed, moderate fractions throughout.
- Track Bias
- Slider below canvas. −2 = strong closer/wet bias; +2 = strong speed/rail bias. Recomputes the predicted finish order.
- Boxed Indicator
- Dashed orange ring = horse is surrounded (rival ahead, rival behind, wall outside). In a real race this horse must find a clear path to run.
- Running Styles
- E/EE = early speed (rushes to rail). P = presser (stalks the pace). S = stalker. SS = slow starter / closer.
| Stat | vs. Current Card | vs. All Horses |
|---|---|---|
| Averages
Career-average metrics across all AI race analysis. Performance and pace averages reflect estimated historical performance; trainer and jockey grades score in-the-money percentages. Grading scale: A = elite • B = above average • C = average • D = below average • F = poor • — = no data |
||
| Pick Pony AI Rating | B | D |
| Pace Trip Longshot | — | — |
| Connections Longshot | — | — |
| Situational Longshot | — | — |
| Speed | D | D |
| Early Pace | C | B |
| Mid Pace | C | C |
| Late Pace | F | D |
| Finish Pos | F | D |
| Dirt Speed | D | B |
| Turf Speed | B | B |
| Distance Speed | B | B |
| Trainer Effectiveness | A | B |
| Jockey Effectiveness | B | B |
| 3rd Party Ratings | F | D |
| Recent
Performance analysis from the horse's recent races, weighted to reflect current form. Sprint and Route FPS (Foot Per Second) measure pace efficiency over the horse's recent sprints and routes respectively. Grading scale: A = elite • B = above average • C = average • D = below average • F = poor • — = no data |
||
| Speed | F | D |
| Early Pace | C | B |
| Mid Pace | A | B |
| Late Pace | F | D |
| Sprint FPS | B | B |
| Route FPS | A | B |
| Trainer Effectiveness | A | B |
| Jockey Effectiveness | B | B |
| 3rd Party Ratings | F | D |
| Predictions
AI-generated projections for the upcoming race, derived from prior AI analysis for speed and pace trends, surface and distance suitability, and current conditions. Grading scale: A = elite • B = above average • C = average • D = below average • F = poor • — = no data |
||
| Speed | D | D |
| Early Pace | B | B |
| Mid Pace | C | B |
| Late Pace | C | C |
Chart Guide (2.0.36)
- Bubbles
- Color = surface: green (turf), brown (dirt), blue (synthetic)
- Top number = finishing position; bottom number in parentheses = starting post position
- Height above line = beaten lengths — closer means a smaller margin
- Border = track conditions: green (FST/GD/FM), yellow (WF/SL/YLD), red (SY/MY/FRZ/SFT/HVY)
- Connecting Line
- Solid = good conditions; dashed = bad conditions
- Line Symbol
- ▲ Triangle = sprint (7f or less); ● Circle = route (more than 7f)
- Days Between Races
- Small number above each bubble (e.g. 19d) = days since the previous race — helps spot freshness, layoffs, and tight scheduling.
- Shaded Band (Bollinger)
- Highlights volatility — a wider band means more variation in recent performance
- Performance Trend
- Straight line showing the overall performance direction — angled up = improving, angled down = declining
- Dashed Reference Line
- AI Opponent = AI analysis class-level par for the race
AI Model History Guide
- Lines
- Each solid line shows this horse’s model score over its last 10 races: blue = Mod1, green = Mod2, amber = Mod3.
- Dashed Lines
- Dashed lines represent the current race’s field average for each model — a score below the dashed line indicates the horse ranked below average in this model’s assessment.
- Higher is Stronger
- All three model scores are 0–100: a higher number means the model rates this horse more favorably among the field.
Mod1(W): 82 (1/8) Mod2(W): 75 (2/8) Mod3(W): 79 (3/8) Mod1-LS: 55 (6/8) Win Prob: 18.4% Value Score: 1.35 ★
Performance vs. Peers Guide
- Bars (per post)
- Blue = avg career performance • Amber = avg last 3 races • Green = last race (improved vs. avg) • Red = last race (declined vs. avg)
- Trend Line
- Angled line above the bars: rising = improving form • falling = declining form.
- Horizontal Line
- Field average — the mean career performance of all horses in this race.
- Color Circles
- Standard post-position colors below each lane — same as the Total Pace chart.
- Border
- Thicker border = this horse’s post position.
Figure Comparison
- Rating
- The three Pick Pony algorithm ratings (Algo 1, Algo 2, Algo 3) that make up the overall PP AI Rating — higher is a stronger contender rating.
- Speed
- Career average speed, recent 3-race average, and last-race speed figure — spot horses in improving or declining form.
- Pace
- Average Early (E1), Mid (E2), and Stretch (LP) pace figures — reveals pace-setters vs. closers vs. all-the-way types.
- This horse
- The horse whose stats card is open is highlighted with a darker column background.
Winning Profiles
- Axes
- X: Win % from last 10 starts — Y: In-the-money % (top-3 finishes) from last 10 starts.
- Quadrants
- Consistent Winners (top-right): high win & ITM — reliable performers.
Place Threats (top-left): boards often but doesn’t win often — good exacta/trifecta angles.
Streaky (bottom-right): wins occasionally, misses the board often — all-or-nothing.
Developing (bottom-left): still finding form — longshot territory. - Reference Lines
- Dashed lines mark field averages. Dots to the right win more; dots higher board more.
- This horse
- Highlighted with a gold border and larger dot.
AI Model Comparison
- Winner Models (green)
- Mod1(W), Mod2(W), and Mod3(W) trained to predict race winners. Higher score = stronger contender.
- Longshot Models (red)
- Mod1-LS, Mod2-LS, and Mod3-LS trained to find high-value longshots. Higher score = stronger longshot candidate.
- Form Model (blue)
- Mod4 sequence model trained on recent form patterns. Higher score = stronger recent form profile.
- This horse
- Highlighted with a darker column background.
Race Pace Simulation Guide
- Slider
- Drag left→right to advance from gate to finish. Drag all the way back to reset the race.
- Predicted Finish Order
- Factors in contested pace burn, each horse’s effort curve (peaked-early vs. peaked-late), and wide trip cost from outside posts. Updated live when Track Bias changes.
- Pace Scenario
- Lone Speed: single E horse likely rates and holds. Contested: two E horses burn each other — closers benefit. Hot Pace: speed meltdown, deep closers thrive. Soft: no early speed, moderate fractions throughout.
- Track Bias
- Slider below canvas. −2 = strong closer/wet bias; +2 = strong speed/rail bias. Recomputes the predicted finish order.
- Boxed Indicator
- Dashed orange ring = horse is surrounded (rival ahead, rival behind, wall outside). In a real race this horse must find a clear path to run.
- Running Styles
- E/EE = early speed (rushes to rail). P = presser (stalks the pace). S = stalker. SS = slow starter / closer.
| Stat | vs. Current Card | vs. All Horses |
|---|---|---|
| Averages
Career-average metrics across all AI race analysis. Performance and pace averages reflect estimated historical performance; trainer and jockey grades score in-the-money percentages. Grading scale: A = elite • B = above average • C = average • D = below average • F = poor • — = no data |
||
| Pick Pony AI Rating | D | D |
| Pace Trip Longshot | — | — |
| Connections Longshot | — | — |
| Situational Longshot | — | — |
| Speed | C | C |
| Early Pace | B | B |
| Mid Pace | A | B |
| Late Pace | D | C |
| Finish Pos | A | C |
| Dirt Speed | B | B |
| Turf Speed | F | C |
| Distance Speed | F | C |
| Trainer Effectiveness | F | D |
| Jockey Effectiveness | F | F |
| 3rd Party Ratings | D | C |
| Recent
Performance analysis from the horse's recent races, weighted to reflect current form. Sprint and Route FPS (Foot Per Second) measure pace efficiency over the horse's recent sprints and routes respectively. Grading scale: A = elite • B = above average • C = average • D = below average • F = poor • — = no data |
||
| Speed | B | C |
| Early Pace | C | B |
| Mid Pace | F | B |
| Late Pace | C | C |
| Sprint FPS | A | B |
| Route FPS | A | A |
| Trainer Effectiveness | F | D |
| Jockey Effectiveness | F | F |
| 3rd Party Ratings | D | C |
| Predictions
AI-generated projections for the upcoming race, derived from prior AI analysis for speed and pace trends, surface and distance suitability, and current conditions. Grading scale: A = elite • B = above average • C = average • D = below average • F = poor • — = no data |
||
| Speed | C | D |
| Early Pace | D | C |
| Mid Pace | A | B |
| Late Pace | C | C |
Chart Guide (2.0.36)
- Bubbles
- Color = surface: green (turf), brown (dirt), blue (synthetic)
- Top number = finishing position; bottom number in parentheses = starting post position
- Height above line = beaten lengths — closer means a smaller margin
- Border = track conditions: green (FST/GD/FM), yellow (WF/SL/YLD), red (SY/MY/FRZ/SFT/HVY)
- Connecting Line
- Solid = good conditions; dashed = bad conditions
- Line Symbol
- ▲ Triangle = sprint (7f or less); ● Circle = route (more than 7f)
- Days Between Races
- Small number above each bubble (e.g. 19d) = days since the previous race — helps spot freshness, layoffs, and tight scheduling.
- Shaded Band (Bollinger)
- Highlights volatility — a wider band means more variation in recent performance
- Performance Trend
- Straight line showing the overall performance direction — angled up = improving, angled down = declining
- Dashed Reference Line
- AI Opponent = AI analysis class-level par for the race
AI Model History Guide
- Lines
- Each solid line shows this horse’s model score over its last 10 races: blue = Mod1, green = Mod2, amber = Mod3.
- Dashed Lines
- Dashed lines represent the current race’s field average for each model — a score below the dashed line indicates the horse ranked below average in this model’s assessment.
- Higher is Stronger
- All three model scores are 0–100: a higher number means the model rates this horse more favorably among the field.
Mod1(W): 82 (1/8) Mod2(W): 75 (2/8) Mod3(W): 79 (3/8) Mod1-LS: 55 (6/8) Win Prob: 18.4% Value Score: 1.35 ★
Performance vs. Peers Guide
- Bars (per post)
- Blue = avg career performance • Amber = avg last 3 races • Green = last race (improved vs. avg) • Red = last race (declined vs. avg)
- Trend Line
- Angled line above the bars: rising = improving form • falling = declining form.
- Horizontal Line
- Field average — the mean career performance of all horses in this race.
- Color Circles
- Standard post-position colors below each lane — same as the Total Pace chart.
- Border
- Thicker border = this horse’s post position.
Figure Comparison
- Rating
- The three Pick Pony algorithm ratings (Algo 1, Algo 2, Algo 3) that make up the overall PP AI Rating — higher is a stronger contender rating.
- Speed
- Career average speed, recent 3-race average, and last-race speed figure — spot horses in improving or declining form.
- Pace
- Average Early (E1), Mid (E2), and Stretch (LP) pace figures — reveals pace-setters vs. closers vs. all-the-way types.
- This horse
- The horse whose stats card is open is highlighted with a darker column background.
Winning Profiles
- Axes
- X: Win % from last 10 starts — Y: In-the-money % (top-3 finishes) from last 10 starts.
- Quadrants
- Consistent Winners (top-right): high win & ITM — reliable performers.
Place Threats (top-left): boards often but doesn’t win often — good exacta/trifecta angles.
Streaky (bottom-right): wins occasionally, misses the board often — all-or-nothing.
Developing (bottom-left): still finding form — longshot territory. - Reference Lines
- Dashed lines mark field averages. Dots to the right win more; dots higher board more.
- This horse
- Highlighted with a gold border and larger dot.
AI Model Comparison
- Winner Models (green)
- Mod1(W), Mod2(W), and Mod3(W) trained to predict race winners. Higher score = stronger contender.
- Longshot Models (red)
- Mod1-LS, Mod2-LS, and Mod3-LS trained to find high-value longshots. Higher score = stronger longshot candidate.
- Form Model (blue)
- Mod4 sequence model trained on recent form patterns. Higher score = stronger recent form profile.
- This horse
- Highlighted with a darker column background.
Race Pace Simulation Guide
- Slider
- Drag left→right to advance from gate to finish. Drag all the way back to reset the race.
- Predicted Finish Order
- Factors in contested pace burn, each horse’s effort curve (peaked-early vs. peaked-late), and wide trip cost from outside posts. Updated live when Track Bias changes.
- Pace Scenario
- Lone Speed: single E horse likely rates and holds. Contested: two E horses burn each other — closers benefit. Hot Pace: speed meltdown, deep closers thrive. Soft: no early speed, moderate fractions throughout.
- Track Bias
- Slider below canvas. −2 = strong closer/wet bias; +2 = strong speed/rail bias. Recomputes the predicted finish order.
- Boxed Indicator
- Dashed orange ring = horse is surrounded (rival ahead, rival behind, wall outside). In a real race this horse must find a clear path to run.
- Running Styles
- E/EE = early speed (rushes to rail). P = presser (stalks the pace). S = stalker. SS = slow starter / closer.
| Stat | vs. Current Card | vs. All Horses |
|---|---|---|
| Averages
Career-average metrics across all AI race analysis. Performance and pace averages reflect estimated historical performance; trainer and jockey grades score in-the-money percentages. Grading scale: A = elite • B = above average • C = average • D = below average • F = poor • — = no data |
||
| Pick Pony AI Rating | A | C |
| Pace Trip Longshot | — | — |
| Connections Longshot | — | — |
| Situational Longshot | — | — |
| Speed | A | B |
| Early Pace | A | B |
| Mid Pace | B | B |
| Late Pace | B | C |
| Finish Pos | D | D |
| Dirt Speed | A | B |
| Turf Speed | D | C |
| Distance Speed | A | B |
| Trainer Effectiveness | C | C |
| Jockey Effectiveness | A | A |
| 3rd Party Ratings | C | C |
| Recent
Performance analysis from the horse's recent races, weighted to reflect current form. Sprint and Route FPS (Foot Per Second) measure pace efficiency over the horse's recent sprints and routes respectively. Grading scale: A = elite • B = above average • C = average • D = below average • F = poor • — = no data |
||
| Speed | D | D |
| Early Pace | A | A |
| Mid Pace | A | A |
| Late Pace | D | D |
| Sprint FPS | A | A |
| Route FPS | B | C |
| Trainer Effectiveness | C | C |
| Jockey Effectiveness | A | A |
| 3rd Party Ratings | C | C |
| Predictions
AI-generated projections for the upcoming race, derived from prior AI analysis for speed and pace trends, surface and distance suitability, and current conditions. Grading scale: A = elite • B = above average • C = average • D = below average • F = poor • — = no data |
||
| Speed | B | D |
| Early Pace | A | B |
| Mid Pace | B | B |
| Late Pace | C | C |
Chart Guide (2.0.36)
- Bubbles
- Color = surface: green (turf), brown (dirt), blue (synthetic)
- Top number = finishing position; bottom number in parentheses = starting post position
- Height above line = beaten lengths — closer means a smaller margin
- Border = track conditions: green (FST/GD/FM), yellow (WF/SL/YLD), red (SY/MY/FRZ/SFT/HVY)
- Connecting Line
- Solid = good conditions; dashed = bad conditions
- Line Symbol
- ▲ Triangle = sprint (7f or less); ● Circle = route (more than 7f)
- Days Between Races
- Small number above each bubble (e.g. 19d) = days since the previous race — helps spot freshness, layoffs, and tight scheduling.
- Shaded Band (Bollinger)
- Highlights volatility — a wider band means more variation in recent performance
- Performance Trend
- Straight line showing the overall performance direction — angled up = improving, angled down = declining
- Dashed Reference Line
- AI Opponent = AI analysis class-level par for the race
AI Model History Guide
- Lines
- Each solid line shows this horse’s model score over its last 10 races: blue = Mod1, green = Mod2, amber = Mod3.
- Dashed Lines
- Dashed lines represent the current race’s field average for each model — a score below the dashed line indicates the horse ranked below average in this model’s assessment.
- Higher is Stronger
- All three model scores are 0–100: a higher number means the model rates this horse more favorably among the field.
Mod1(W): 82 (1/8) Mod2(W): 75 (2/8) Mod3(W): 79 (3/8) Mod1-LS: 55 (6/8) Win Prob: 18.4% Value Score: 1.35 ★
Performance vs. Peers Guide
- Bars (per post)
- Blue = avg career performance • Amber = avg last 3 races • Green = last race (improved vs. avg) • Red = last race (declined vs. avg)
- Trend Line
- Angled line above the bars: rising = improving form • falling = declining form.
- Horizontal Line
- Field average — the mean career performance of all horses in this race.
- Color Circles
- Standard post-position colors below each lane — same as the Total Pace chart.
- Border
- Thicker border = this horse’s post position.
Figure Comparison
- Rating
- The three Pick Pony algorithm ratings (Algo 1, Algo 2, Algo 3) that make up the overall PP AI Rating — higher is a stronger contender rating.
- Speed
- Career average speed, recent 3-race average, and last-race speed figure — spot horses in improving or declining form.
- Pace
- Average Early (E1), Mid (E2), and Stretch (LP) pace figures — reveals pace-setters vs. closers vs. all-the-way types.
- This horse
- The horse whose stats card is open is highlighted with a darker column background.
Winning Profiles
- Axes
- X: Win % from last 10 starts — Y: In-the-money % (top-3 finishes) from last 10 starts.
- Quadrants
- Consistent Winners (top-right): high win & ITM — reliable performers.
Place Threats (top-left): boards often but doesn’t win often — good exacta/trifecta angles.
Streaky (bottom-right): wins occasionally, misses the board often — all-or-nothing.
Developing (bottom-left): still finding form — longshot territory. - Reference Lines
- Dashed lines mark field averages. Dots to the right win more; dots higher board more.
- This horse
- Highlighted with a gold border and larger dot.
AI Model Comparison
- Winner Models (green)
- Mod1(W), Mod2(W), and Mod3(W) trained to predict race winners. Higher score = stronger contender.
- Longshot Models (red)
- Mod1-LS, Mod2-LS, and Mod3-LS trained to find high-value longshots. Higher score = stronger longshot candidate.
- Form Model (blue)
- Mod4 sequence model trained on recent form patterns. Higher score = stronger recent form profile.
- This horse
- Highlighted with a darker column background.
Race Pace Simulation Guide
- Slider
- Drag left→right to advance from gate to finish. Drag all the way back to reset the race.
- Predicted Finish Order
- Factors in contested pace burn, each horse’s effort curve (peaked-early vs. peaked-late), and wide trip cost from outside posts. Updated live when Track Bias changes.
- Pace Scenario
- Lone Speed: single E horse likely rates and holds. Contested: two E horses burn each other — closers benefit. Hot Pace: speed meltdown, deep closers thrive. Soft: no early speed, moderate fractions throughout.
- Track Bias
- Slider below canvas. −2 = strong closer/wet bias; +2 = strong speed/rail bias. Recomputes the predicted finish order.
- Boxed Indicator
- Dashed orange ring = horse is surrounded (rival ahead, rival behind, wall outside). In a real race this horse must find a clear path to run.
- Running Styles
- E/EE = early speed (rushes to rail). P = presser (stalks the pace). S = stalker. SS = slow starter / closer.
| Stat | vs. Current Card | vs. All Horses |
|---|---|---|
| Averages
Career-average metrics across all AI race analysis. Performance and pace averages reflect estimated historical performance; trainer and jockey grades score in-the-money percentages. Grading scale: A = elite • B = above average • C = average • D = below average • F = poor • — = no data |
||
| Pick Pony AI Rating | A | B |
| Pace Trip Longshot | — | — |
| Connections Longshot | — | — |
| Situational Longshot | — | — |
| Speed | A | B |
| Early Pace | F | D |
| Mid Pace | D | C |
| Late Pace | A | A |
| Finish Pos | A | B |
| Dirt Speed | A | A |
| Turf Speed | A | A |
| Distance Speed | A | A |
| Trainer Effectiveness | C | C |
| Jockey Effectiveness | A | B |
| 3rd Party Ratings | A | B |
| Recent
Performance analysis from the horse's recent races, weighted to reflect current form. Sprint and Route FPS (Foot Per Second) measure pace efficiency over the horse's recent sprints and routes respectively. Grading scale: A = elite • B = above average • C = average • D = below average • F = poor • — = no data |
||
| Speed | A | B |
| Early Pace | D | C |
| Mid Pace | B | B |
| Late Pace | A | A |
| Sprint FPS | F | D |
| Route FPS | F | D |
| Trainer Effectiveness | C | C |
| Jockey Effectiveness | A | B |
| 3rd Party Ratings | A | B |
| Predictions
AI-generated projections for the upcoming race, derived from prior AI analysis for speed and pace trends, surface and distance suitability, and current conditions. Grading scale: A = elite • B = above average • C = average • D = below average • F = poor • — = no data |
||
| Speed | A | B |
| Early Pace | F | C |
| Mid Pace | D | B |
| Late Pace | C | C |
Chart Guide (2.0.36)
- Bubbles
- Color = surface: green (turf), brown (dirt), blue (synthetic)
- Top number = finishing position; bottom number in parentheses = starting post position
- Height above line = beaten lengths — closer means a smaller margin
- Border = track conditions: green (FST/GD/FM), yellow (WF/SL/YLD), red (SY/MY/FRZ/SFT/HVY)
- Connecting Line
- Solid = good conditions; dashed = bad conditions
- Line Symbol
- ▲ Triangle = sprint (7f or less); ● Circle = route (more than 7f)
- Days Between Races
- Small number above each bubble (e.g. 19d) = days since the previous race — helps spot freshness, layoffs, and tight scheduling.
- Shaded Band (Bollinger)
- Highlights volatility — a wider band means more variation in recent performance
- Performance Trend
- Straight line showing the overall performance direction — angled up = improving, angled down = declining
- Dashed Reference Line
- AI Opponent = AI analysis class-level par for the race
AI Model History Guide
- Lines
- Each solid line shows this horse’s model score over its last 10 races: blue = Mod1, green = Mod2, amber = Mod3.
- Dashed Lines
- Dashed lines represent the current race’s field average for each model — a score below the dashed line indicates the horse ranked below average in this model’s assessment.
- Higher is Stronger
- All three model scores are 0–100: a higher number means the model rates this horse more favorably among the field.
Mod1(W): 82 (1/8) Mod2(W): 75 (2/8) Mod3(W): 79 (3/8) Mod1-LS: 55 (6/8) Win Prob: 18.4% Value Score: 1.35 ★
Performance vs. Peers Guide
- Bars (per post)
- Blue = avg career performance • Amber = avg last 3 races • Green = last race (improved vs. avg) • Red = last race (declined vs. avg)
- Trend Line
- Angled line above the bars: rising = improving form • falling = declining form.
- Horizontal Line
- Field average — the mean career performance of all horses in this race.
- Color Circles
- Standard post-position colors below each lane — same as the Total Pace chart.
- Border
- Thicker border = this horse’s post position.
Figure Comparison
- Rating
- The three Pick Pony algorithm ratings (Algo 1, Algo 2, Algo 3) that make up the overall PP AI Rating — higher is a stronger contender rating.
- Speed
- Career average speed, recent 3-race average, and last-race speed figure — spot horses in improving or declining form.
- Pace
- Average Early (E1), Mid (E2), and Stretch (LP) pace figures — reveals pace-setters vs. closers vs. all-the-way types.
- This horse
- The horse whose stats card is open is highlighted with a darker column background.
Winning Profiles
- Axes
- X: Win % from last 10 starts — Y: In-the-money % (top-3 finishes) from last 10 starts.
- Quadrants
- Consistent Winners (top-right): high win & ITM — reliable performers.
Place Threats (top-left): boards often but doesn’t win often — good exacta/trifecta angles.
Streaky (bottom-right): wins occasionally, misses the board often — all-or-nothing.
Developing (bottom-left): still finding form — longshot territory. - Reference Lines
- Dashed lines mark field averages. Dots to the right win more; dots higher board more.
- This horse
- Highlighted with a gold border and larger dot.
AI Model Comparison
- Winner Models (green)
- Mod1(W), Mod2(W), and Mod3(W) trained to predict race winners. Higher score = stronger contender.
- Longshot Models (red)
- Mod1-LS, Mod2-LS, and Mod3-LS trained to find high-value longshots. Higher score = stronger longshot candidate.
- Form Model (blue)
- Mod4 sequence model trained on recent form patterns. Higher score = stronger recent form profile.
- This horse
- Highlighted with a darker column background.
Race Pace Simulation Guide
- Slider
- Drag left→right to advance from gate to finish. Drag all the way back to reset the race.
- Predicted Finish Order
- Factors in contested pace burn, each horse’s effort curve (peaked-early vs. peaked-late), and wide trip cost from outside posts. Updated live when Track Bias changes.
- Pace Scenario
- Lone Speed: single E horse likely rates and holds. Contested: two E horses burn each other — closers benefit. Hot Pace: speed meltdown, deep closers thrive. Soft: no early speed, moderate fractions throughout.
- Track Bias
- Slider below canvas. −2 = strong closer/wet bias; +2 = strong speed/rail bias. Recomputes the predicted finish order.
- Boxed Indicator
- Dashed orange ring = horse is surrounded (rival ahead, rival behind, wall outside). In a real race this horse must find a clear path to run.
- Running Styles
- E/EE = early speed (rushes to rail). P = presser (stalks the pace). S = stalker. SS = slow starter / closer.
| Stat | vs. Current Card | vs. All Horses |
|---|---|---|
| Averages
Career-average metrics across all AI race analysis. Performance and pace averages reflect estimated historical performance; trainer and jockey grades score in-the-money percentages. Grading scale: A = elite • B = above average • C = average • D = below average • F = poor • — = no data |
||
| Pick Pony AI Rating | B | D |
| Pace Trip Longshot | — | — |
| Connections Longshot | — | — |
| Situational Longshot | — | — |
| Speed | A | D |
| Early Pace | B | B |
| Mid Pace | A | B |
| Late Pace | B | D |
| Finish Pos | C | F |
| Dirt Speed | D | C |
| Turf Speed | D | D |
| Distance Speed | C | C |
| Trainer Effectiveness | A | B |
| Jockey Effectiveness | C | C |
| 3rd Party Ratings | B | D |
| Recent
Performance analysis from the horse's recent races, weighted to reflect current form. Sprint and Route FPS (Foot Per Second) measure pace efficiency over the horse's recent sprints and routes respectively. Grading scale: A = elite • B = above average • C = average • D = below average • F = poor • — = no data |
||
| Speed | B | D |
| Early Pace | B | A |
| Mid Pace | A | B |
| Late Pace | F | D |
| Sprint FPS | C | C |
| Route FPS | D | D |
| Trainer Effectiveness | A | B |
| Jockey Effectiveness | C | C |
| 3rd Party Ratings | B | D |
| Predictions
AI-generated projections for the upcoming race, derived from prior AI analysis for speed and pace trends, surface and distance suitability, and current conditions. Grading scale: A = elite • B = above average • C = average • D = below average • F = poor • — = no data |
||
| Speed | A | D |
| Early Pace | B | B |
| Mid Pace | A | B |
| Late Pace | C | C |
Chart Guide (2.0.36)
- Bubbles
- Color = surface: green (turf), brown (dirt), blue (synthetic)
- Top number = finishing position; bottom number in parentheses = starting post position
- Height above line = beaten lengths — closer means a smaller margin
- Border = track conditions: green (FST/GD/FM), yellow (WF/SL/YLD), red (SY/MY/FRZ/SFT/HVY)
- Connecting Line
- Solid = good conditions; dashed = bad conditions
- Line Symbol
- ▲ Triangle = sprint (7f or less); ● Circle = route (more than 7f)
- Days Between Races
- Small number above each bubble (e.g. 19d) = days since the previous race — helps spot freshness, layoffs, and tight scheduling.
- Shaded Band (Bollinger)
- Highlights volatility — a wider band means more variation in recent performance
- Performance Trend
- Straight line showing the overall performance direction — angled up = improving, angled down = declining
- Dashed Reference Line
- AI Opponent = AI analysis class-level par for the race
AI Model History Guide
- Lines
- Each solid line shows this horse’s model score over its last 10 races: blue = Mod1, green = Mod2, amber = Mod3.
- Dashed Lines
- Dashed lines represent the current race’s field average for each model — a score below the dashed line indicates the horse ranked below average in this model’s assessment.
- Higher is Stronger
- All three model scores are 0–100: a higher number means the model rates this horse more favorably among the field.
Mod1(W): 82 (1/8) Mod2(W): 75 (2/8) Mod3(W): 79 (3/8) Mod1-LS: 55 (6/8) Win Prob: 18.4% Value Score: 1.35 ★
Performance vs. Peers Guide
- Bars (per post)
- Blue = avg career performance • Amber = avg last 3 races • Green = last race (improved vs. avg) • Red = last race (declined vs. avg)
- Trend Line
- Angled line above the bars: rising = improving form • falling = declining form.
- Horizontal Line
- Field average — the mean career performance of all horses in this race.
- Color Circles
- Standard post-position colors below each lane — same as the Total Pace chart.
- Border
- Thicker border = this horse’s post position.
Figure Comparison
- Rating
- The three Pick Pony algorithm ratings (Algo 1, Algo 2, Algo 3) that make up the overall PP AI Rating — higher is a stronger contender rating.
- Speed
- Career average speed, recent 3-race average, and last-race speed figure — spot horses in improving or declining form.
- Pace
- Average Early (E1), Mid (E2), and Stretch (LP) pace figures — reveals pace-setters vs. closers vs. all-the-way types.
- This horse
- The horse whose stats card is open is highlighted with a darker column background.
Winning Profiles
- Axes
- X: Win % from last 10 starts — Y: In-the-money % (top-3 finishes) from last 10 starts.
- Quadrants
- Consistent Winners (top-right): high win & ITM — reliable performers.
Place Threats (top-left): boards often but doesn’t win often — good exacta/trifecta angles.
Streaky (bottom-right): wins occasionally, misses the board often — all-or-nothing.
Developing (bottom-left): still finding form — longshot territory. - Reference Lines
- Dashed lines mark field averages. Dots to the right win more; dots higher board more.
- This horse
- Highlighted with a gold border and larger dot.
AI Model Comparison
- Winner Models (green)
- Mod1(W), Mod2(W), and Mod3(W) trained to predict race winners. Higher score = stronger contender.
- Longshot Models (red)
- Mod1-LS, Mod2-LS, and Mod3-LS trained to find high-value longshots. Higher score = stronger longshot candidate.
- Form Model (blue)
- Mod4 sequence model trained on recent form patterns. Higher score = stronger recent form profile.
- This horse
- Highlighted with a darker column background.
Race Pace Simulation Guide
- Slider
- Drag left→right to advance from gate to finish. Drag all the way back to reset the race.
- Predicted Finish Order
- Factors in contested pace burn, each horse’s effort curve (peaked-early vs. peaked-late), and wide trip cost from outside posts. Updated live when Track Bias changes.
- Pace Scenario
- Lone Speed: single E horse likely rates and holds. Contested: two E horses burn each other — closers benefit. Hot Pace: speed meltdown, deep closers thrive. Soft: no early speed, moderate fractions throughout.
- Track Bias
- Slider below canvas. −2 = strong closer/wet bias; +2 = strong speed/rail bias. Recomputes the predicted finish order.
- Boxed Indicator
- Dashed orange ring = horse is surrounded (rival ahead, rival behind, wall outside). In a real race this horse must find a clear path to run.
- Running Styles
- E/EE = early speed (rushes to rail). P = presser (stalks the pace). S = stalker. SS = slow starter / closer.
| Stat | vs. Current Card | vs. All Horses |
|---|---|---|
| Averages
Career-average metrics across all AI race analysis. Performance and pace averages reflect estimated historical performance; trainer and jockey grades score in-the-money percentages. Grading scale: A = elite • B = above average • C = average • D = below average • F = poor • — = no data |
||
| Pick Pony AI Rating | A | B |
| Pace Trip Longshot | — | — |
| Connections Longshot | — | — |
| Situational Longshot | — | — |
| Speed | B | D |
| Early Pace | B | B |
| Mid Pace | B | B |
| Late Pace | C | D |
| Finish Pos | A | C |
| Dirt Speed | B | C |
| Turf Speed | A | B |
| Distance Speed | A | C |
| Trainer Effectiveness | B | B |
| Jockey Effectiveness | B | B |
| 3rd Party Ratings | A | D |
| Recent
Performance analysis from the horse's recent races, weighted to reflect current form. Sprint and Route FPS (Foot Per Second) measure pace efficiency over the horse's recent sprints and routes respectively. Grading scale: A = elite • B = above average • C = average • D = below average • F = poor • — = no data |
||
| Speed | A | D |
| Early Pace | B | A |
| Mid Pace | A | B |
| Late Pace | A | D |
| Sprint FPS | A | A |
| Route FPS | A | A |
| Trainer Effectiveness | B | B |
| Jockey Effectiveness | B | B |
| 3rd Party Ratings | A | D |
| Predictions
AI-generated projections for the upcoming race, derived from prior AI analysis for speed and pace trends, surface and distance suitability, and current conditions. Grading scale: A = elite • B = above average • C = average • D = below average • F = poor • — = no data |
||
| Speed | C | D |
| Early Pace | A | B |
| Mid Pace | B | B |
| Late Pace | C | C |
Chart Guide (2.0.36)
- Bubbles
- Color = surface: green (turf), brown (dirt), blue (synthetic)
- Top number = finishing position; bottom number in parentheses = starting post position
- Height above line = beaten lengths — closer means a smaller margin
- Border = track conditions: green (FST/GD/FM), yellow (WF/SL/YLD), red (SY/MY/FRZ/SFT/HVY)
- Connecting Line
- Solid = good conditions; dashed = bad conditions
- Line Symbol
- ▲ Triangle = sprint (7f or less); ● Circle = route (more than 7f)
- Days Between Races
- Small number above each bubble (e.g. 19d) = days since the previous race — helps spot freshness, layoffs, and tight scheduling.
- Shaded Band (Bollinger)
- Highlights volatility — a wider band means more variation in recent performance
- Performance Trend
- Straight line showing the overall performance direction — angled up = improving, angled down = declining
- Dashed Reference Line
- AI Opponent = AI analysis class-level par for the race
AI Model History Guide
- Lines
- Each solid line shows this horse’s model score over its last 10 races: blue = Mod1, green = Mod2, amber = Mod3.
- Dashed Lines
- Dashed lines represent the current race’s field average for each model — a score below the dashed line indicates the horse ranked below average in this model’s assessment.
- Higher is Stronger
- All three model scores are 0–100: a higher number means the model rates this horse more favorably among the field.
Mod1(W): 82 (1/8) Mod2(W): 75 (2/8) Mod3(W): 79 (3/8) Mod1-LS: 55 (6/8) Win Prob: 18.4% Value Score: 1.35 ★
Performance vs. Peers Guide
- Bars (per post)
- Blue = avg career performance • Amber = avg last 3 races • Green = last race (improved vs. avg) • Red = last race (declined vs. avg)
- Trend Line
- Angled line above the bars: rising = improving form • falling = declining form.
- Horizontal Line
- Field average — the mean career performance of all horses in this race.
- Color Circles
- Standard post-position colors below each lane — same as the Total Pace chart.
- Border
- Thicker border = this horse’s post position.
Figure Comparison
- Rating
- The three Pick Pony algorithm ratings (Algo 1, Algo 2, Algo 3) that make up the overall PP AI Rating — higher is a stronger contender rating.
- Speed
- Career average speed, recent 3-race average, and last-race speed figure — spot horses in improving or declining form.
- Pace
- Average Early (E1), Mid (E2), and Stretch (LP) pace figures — reveals pace-setters vs. closers vs. all-the-way types.
- This horse
- The horse whose stats card is open is highlighted with a darker column background.
Winning Profiles
- Axes
- X: Win % from last 10 starts — Y: In-the-money % (top-3 finishes) from last 10 starts.
- Quadrants
- Consistent Winners (top-right): high win & ITM — reliable performers.
Place Threats (top-left): boards often but doesn’t win often — good exacta/trifecta angles.
Streaky (bottom-right): wins occasionally, misses the board often — all-or-nothing.
Developing (bottom-left): still finding form — longshot territory. - Reference Lines
- Dashed lines mark field averages. Dots to the right win more; dots higher board more.
- This horse
- Highlighted with a gold border and larger dot.
AI Model Comparison
- Winner Models (green)
- Mod1(W), Mod2(W), and Mod3(W) trained to predict race winners. Higher score = stronger contender.
- Longshot Models (red)
- Mod1-LS, Mod2-LS, and Mod3-LS trained to find high-value longshots. Higher score = stronger longshot candidate.
- Form Model (blue)
- Mod4 sequence model trained on recent form patterns. Higher score = stronger recent form profile.
- This horse
- Highlighted with a darker column background.
Race Pace Simulation Guide
- Slider
- Drag left→right to advance from gate to finish. Drag all the way back to reset the race.
- Predicted Finish Order
- Factors in contested pace burn, each horse’s effort curve (peaked-early vs. peaked-late), and wide trip cost from outside posts. Updated live when Track Bias changes.
- Pace Scenario
- Lone Speed: single E horse likely rates and holds. Contested: two E horses burn each other — closers benefit. Hot Pace: speed meltdown, deep closers thrive. Soft: no early speed, moderate fractions throughout.
- Track Bias
- Slider below canvas. −2 = strong closer/wet bias; +2 = strong speed/rail bias. Recomputes the predicted finish order.
- Boxed Indicator
- Dashed orange ring = horse is surrounded (rival ahead, rival behind, wall outside). In a real race this horse must find a clear path to run.
- Running Styles
- E/EE = early speed (rushes to rail). P = presser (stalks the pace). S = stalker. SS = slow starter / closer.
| Stat | vs. Current Card | vs. All Horses |
|---|---|---|
| Averages
Career-average metrics across all AI race analysis. Performance and pace averages reflect estimated historical performance; trainer and jockey grades score in-the-money percentages. Grading scale: A = elite • B = above average • C = average • D = below average • F = poor • — = no data |
||
| Pick Pony AI Rating | A | B |
| Pace Trip Longshot | — | — |
| Connections Longshot | — | — |
| Situational Longshot | — | — |
| Speed | A | C |
| Early Pace | A | B |
| Mid Pace | A | A |
| Late Pace | A | D |
| Finish Pos | B | D |
| Dirt Speed | A | B |
| Turf Speed | D | D |
| Distance Speed | A | B |
| Trainer Effectiveness | C | C |
| Jockey Effectiveness | A | B |
| 3rd Party Ratings | A | C |
| Recent
Performance analysis from the horse's recent races, weighted to reflect current form. Sprint and Route FPS (Foot Per Second) measure pace efficiency over the horse's recent sprints and routes respectively. Grading scale: A = elite • B = above average • C = average • D = below average • F = poor • — = no data |
||
| Speed | A | D |
| Early Pace | A | A |
| Mid Pace | B | B |
| Late Pace | A | D |
| Sprint FPS | B | B |
| Route FPS | C | C |
| Trainer Effectiveness | C | C |
| Jockey Effectiveness | A | B |
| 3rd Party Ratings | A | C |
| Predictions
AI-generated projections for the upcoming race, derived from prior AI analysis for speed and pace trends, surface and distance suitability, and current conditions. Grading scale: A = elite • B = above average • C = average • D = below average • F = poor • — = no data |
||
| Speed | A | D |
| Early Pace | B | B |
| Mid Pace | A | A |
| Late Pace | C | C |
Chart Guide (2.0.36)
- Bubbles
- Color = surface: green (turf), brown (dirt), blue (synthetic)
- Top number = finishing position; bottom number in parentheses = starting post position
- Height above line = beaten lengths — closer means a smaller margin
- Border = track conditions: green (FST/GD/FM), yellow (WF/SL/YLD), red (SY/MY/FRZ/SFT/HVY)
- Connecting Line
- Solid = good conditions; dashed = bad conditions
- Line Symbol
- ▲ Triangle = sprint (7f or less); ● Circle = route (more than 7f)
- Days Between Races
- Small number above each bubble (e.g. 19d) = days since the previous race — helps spot freshness, layoffs, and tight scheduling.
- Shaded Band (Bollinger)
- Highlights volatility — a wider band means more variation in recent performance
- Performance Trend
- Straight line showing the overall performance direction — angled up = improving, angled down = declining
- Dashed Reference Line
- AI Opponent = AI analysis class-level par for the race
AI Model History Guide
- Lines
- Each solid line shows this horse’s model score over its last 10 races: blue = Mod1, green = Mod2, amber = Mod3.
- Dashed Lines
- Dashed lines represent the current race’s field average for each model — a score below the dashed line indicates the horse ranked below average in this model’s assessment.
- Higher is Stronger
- All three model scores are 0–100: a higher number means the model rates this horse more favorably among the field.
Mod1(W): 82 (1/8) Mod2(W): 75 (2/8) Mod3(W): 79 (3/8) Mod1-LS: 55 (6/8) Win Prob: 18.4% Value Score: 1.35 ★
Performance vs. Peers Guide
- Bars (per post)
- Blue = avg career performance • Amber = avg last 3 races • Green = last race (improved vs. avg) • Red = last race (declined vs. avg)
- Trend Line
- Angled line above the bars: rising = improving form • falling = declining form.
- Horizontal Line
- Field average — the mean career performance of all horses in this race.
- Color Circles
- Standard post-position colors below each lane — same as the Total Pace chart.
- Border
- Thicker border = this horse’s post position.
Figure Comparison
- Rating
- The three Pick Pony algorithm ratings (Algo 1, Algo 2, Algo 3) that make up the overall PP AI Rating — higher is a stronger contender rating.
- Speed
- Career average speed, recent 3-race average, and last-race speed figure — spot horses in improving or declining form.
- Pace
- Average Early (E1), Mid (E2), and Stretch (LP) pace figures — reveals pace-setters vs. closers vs. all-the-way types.
- This horse
- The horse whose stats card is open is highlighted with a darker column background.
Winning Profiles
- Axes
- X: Win % from last 10 starts — Y: In-the-money % (top-3 finishes) from last 10 starts.
- Quadrants
- Consistent Winners (top-right): high win & ITM — reliable performers.
Place Threats (top-left): boards often but doesn’t win often — good exacta/trifecta angles.
Streaky (bottom-right): wins occasionally, misses the board often — all-or-nothing.
Developing (bottom-left): still finding form — longshot territory. - Reference Lines
- Dashed lines mark field averages. Dots to the right win more; dots higher board more.
- This horse
- Highlighted with a gold border and larger dot.
AI Model Comparison
- Winner Models (green)
- Mod1(W), Mod2(W), and Mod3(W) trained to predict race winners. Higher score = stronger contender.
- Longshot Models (red)
- Mod1-LS, Mod2-LS, and Mod3-LS trained to find high-value longshots. Higher score = stronger longshot candidate.
- Form Model (blue)
- Mod4 sequence model trained on recent form patterns. Higher score = stronger recent form profile.
- This horse
- Highlighted with a darker column background.
Race Pace Simulation Guide
- Slider
- Drag left→right to advance from gate to finish. Drag all the way back to reset the race.
- Predicted Finish Order
- Factors in contested pace burn, each horse’s effort curve (peaked-early vs. peaked-late), and wide trip cost from outside posts. Updated live when Track Bias changes.
- Pace Scenario
- Lone Speed: single E horse likely rates and holds. Contested: two E horses burn each other — closers benefit. Hot Pace: speed meltdown, deep closers thrive. Soft: no early speed, moderate fractions throughout.
- Track Bias
- Slider below canvas. −2 = strong closer/wet bias; +2 = strong speed/rail bias. Recomputes the predicted finish order.
- Boxed Indicator
- Dashed orange ring = horse is surrounded (rival ahead, rival behind, wall outside). In a real race this horse must find a clear path to run.
- Running Styles
- E/EE = early speed (rushes to rail). P = presser (stalks the pace). S = stalker. SS = slow starter / closer.
| Stat | vs. Current Card | vs. All Horses |
|---|---|---|
| Averages
Career-average metrics across all AI race analysis. Performance and pace averages reflect estimated historical performance; trainer and jockey grades score in-the-money percentages. Grading scale: A = elite • B = above average • C = average • D = below average • F = poor • — = no data |
||
| Pick Pony AI Rating | B | C |
| Pace Trip Longshot | — | — |
| Connections Longshot | — | — |
| Situational Longshot | — | — |
| Speed | A | B |
| Early Pace | B | C |
| Mid Pace | A | C |
| Late Pace | A | A |
| Finish Pos | A | B |
| Dirt Speed | A | A |
| Turf Speed | C | B |
| Distance Speed | C | C |
| Trainer Effectiveness | C | B |
| Jockey Effectiveness | C | B |
| 3rd Party Ratings | C | B |
| Recent
Performance analysis from the horse's recent races, weighted to reflect current form. Sprint and Route FPS (Foot Per Second) measure pace efficiency over the horse's recent sprints and routes respectively. Grading scale: A = elite • B = above average • C = average • D = below average • F = poor • — = no data |
||
| Speed | A | B |
| Early Pace | B | B |
| Mid Pace | A | B |
| Late Pace | A | A |
| Sprint FPS | B | C |
| Route FPS | C | C |
| Trainer Effectiveness | C | B |
| Jockey Effectiveness | C | B |
| 3rd Party Ratings | C | B |
| Predictions
AI-generated projections for the upcoming race, derived from prior AI analysis for speed and pace trends, surface and distance suitability, and current conditions. Grading scale: A = elite • B = above average • C = average • D = below average • F = poor • — = no data |
||
| Speed | A | B |
| Early Pace | A | C |
| Mid Pace | A | B |
| Late Pace | C | C |
Chart Guide (2.0.36)
- Bubbles
- Color = surface: green (turf), brown (dirt), blue (synthetic)
- Top number = finishing position; bottom number in parentheses = starting post position
- Height above line = beaten lengths — closer means a smaller margin
- Border = track conditions: green (FST/GD/FM), yellow (WF/SL/YLD), red (SY/MY/FRZ/SFT/HVY)
- Connecting Line
- Solid = good conditions; dashed = bad conditions
- Line Symbol
- ▲ Triangle = sprint (7f or less); ● Circle = route (more than 7f)
- Days Between Races
- Small number above each bubble (e.g. 19d) = days since the previous race — helps spot freshness, layoffs, and tight scheduling.
- Shaded Band (Bollinger)
- Highlights volatility — a wider band means more variation in recent performance
- Performance Trend
- Straight line showing the overall performance direction — angled up = improving, angled down = declining
- Dashed Reference Line
- AI Opponent = AI analysis class-level par for the race
AI Model History Guide
- Lines
- Each solid line shows this horse’s model score over its last 10 races: blue = Mod1, green = Mod2, amber = Mod3.
- Dashed Lines
- Dashed lines represent the current race’s field average for each model — a score below the dashed line indicates the horse ranked below average in this model’s assessment.
- Higher is Stronger
- All three model scores are 0–100: a higher number means the model rates this horse more favorably among the field.
Mod1(W): 82 (1/8) Mod2(W): 75 (2/8) Mod3(W): 79 (3/8) Mod1-LS: 55 (6/8) Win Prob: 18.4% Value Score: 1.35 ★
Performance vs. Peers Guide
- Bars (per post)
- Blue = avg career performance • Amber = avg last 3 races • Green = last race (improved vs. avg) • Red = last race (declined vs. avg)
- Trend Line
- Angled line above the bars: rising = improving form • falling = declining form.
- Horizontal Line
- Field average — the mean career performance of all horses in this race.
- Color Circles
- Standard post-position colors below each lane — same as the Total Pace chart.
- Border
- Thicker border = this horse’s post position.
Figure Comparison
- Rating
- The three Pick Pony algorithm ratings (Algo 1, Algo 2, Algo 3) that make up the overall PP AI Rating — higher is a stronger contender rating.
- Speed
- Career average speed, recent 3-race average, and last-race speed figure — spot horses in improving or declining form.
- Pace
- Average Early (E1), Mid (E2), and Stretch (LP) pace figures — reveals pace-setters vs. closers vs. all-the-way types.
- This horse
- The horse whose stats card is open is highlighted with a darker column background.
Winning Profiles
- Axes
- X: Win % from last 10 starts — Y: In-the-money % (top-3 finishes) from last 10 starts.
- Quadrants
- Consistent Winners (top-right): high win & ITM — reliable performers.
Place Threats (top-left): boards often but doesn’t win often — good exacta/trifecta angles.
Streaky (bottom-right): wins occasionally, misses the board often — all-or-nothing.
Developing (bottom-left): still finding form — longshot territory. - Reference Lines
- Dashed lines mark field averages. Dots to the right win more; dots higher board more.
- This horse
- Highlighted with a gold border and larger dot.
AI Model Comparison
- Winner Models (green)
- Mod1(W), Mod2(W), and Mod3(W) trained to predict race winners. Higher score = stronger contender.
- Longshot Models (red)
- Mod1-LS, Mod2-LS, and Mod3-LS trained to find high-value longshots. Higher score = stronger longshot candidate.
- Form Model (blue)
- Mod4 sequence model trained on recent form patterns. Higher score = stronger recent form profile.
- This horse
- Highlighted with a darker column background.
Race Pace Simulation Guide
- Slider
- Drag left→right to advance from gate to finish. Drag all the way back to reset the race.
- Predicted Finish Order
- Factors in contested pace burn, each horse’s effort curve (peaked-early vs. peaked-late), and wide trip cost from outside posts. Updated live when Track Bias changes.
- Pace Scenario
- Lone Speed: single E horse likely rates and holds. Contested: two E horses burn each other — closers benefit. Hot Pace: speed meltdown, deep closers thrive. Soft: no early speed, moderate fractions throughout.
- Track Bias
- Slider below canvas. −2 = strong closer/wet bias; +2 = strong speed/rail bias. Recomputes the predicted finish order.
- Boxed Indicator
- Dashed orange ring = horse is surrounded (rival ahead, rival behind, wall outside). In a real race this horse must find a clear path to run.
- Running Styles
- E/EE = early speed (rushes to rail). P = presser (stalks the pace). S = stalker. SS = slow starter / closer.
| Stat | vs. Current Card | vs. All Horses |
|---|---|---|
| Averages
Career-average metrics across all AI race analysis. Performance and pace averages reflect estimated historical performance; trainer and jockey grades score in-the-money percentages. Grading scale: A = elite • B = above average • C = average • D = below average • F = poor • — = no data |
||
| Pick Pony AI Rating | C | C |
| Pace Trip Longshot | — | — |
| Connections Longshot | — | — |
| Situational Longshot | — | — |
| Speed | B | B |
| Early Pace | A | B |
| Mid Pace | A | B |
| Late Pace | C | B |
| Finish Pos | B | C |
| Dirt Speed | B | B |
| Turf Speed | C | C |
| Distance Speed | F | F |
| Trainer Effectiveness | A | A |
| Jockey Effectiveness | B | B |
| 3rd Party Ratings | A | B |
| Recent
Performance analysis from the horse's recent races, weighted to reflect current form. Sprint and Route FPS (Foot Per Second) measure pace efficiency over the horse's recent sprints and routes respectively. Grading scale: A = elite • B = above average • C = average • D = below average • F = poor • — = no data |
||
| Speed | B | B |
| Early Pace | A | B |
| Mid Pace | A | A |
| Late Pace | B | A |
| Sprint FPS | A | A |
| Route FPS | A | B |
| Trainer Effectiveness | A | A |
| Jockey Effectiveness | B | B |
| 3rd Party Ratings | A | B |
| Predictions
AI-generated projections for the upcoming race, derived from prior AI analysis for speed and pace trends, surface and distance suitability, and current conditions. Grading scale: A = elite • B = above average • C = average • D = below average • F = poor • — = no data |
||
| Speed | B | B |
| Early Pace | A | B |
| Mid Pace | A | A |
| Late Pace | C | C |
Chart Guide (2.0.36)
- Bubbles
- Color = surface: green (turf), brown (dirt), blue (synthetic)
- Top number = finishing position; bottom number in parentheses = starting post position
- Height above line = beaten lengths — closer means a smaller margin
- Border = track conditions: green (FST/GD/FM), yellow (WF/SL/YLD), red (SY/MY/FRZ/SFT/HVY)
- Connecting Line
- Solid = good conditions; dashed = bad conditions
- Line Symbol
- ▲ Triangle = sprint (7f or less); ● Circle = route (more than 7f)
- Days Between Races
- Small number above each bubble (e.g. 19d) = days since the previous race — helps spot freshness, layoffs, and tight scheduling.
- Shaded Band (Bollinger)
- Highlights volatility — a wider band means more variation in recent performance
- Performance Trend
- Straight line showing the overall performance direction — angled up = improving, angled down = declining
- Dashed Reference Line
- AI Opponent = AI analysis class-level par for the race
AI Model History Guide
- Lines
- Each solid line shows this horse’s model score over its last 10 races: blue = Mod1, green = Mod2, amber = Mod3.
- Dashed Lines
- Dashed lines represent the current race’s field average for each model — a score below the dashed line indicates the horse ranked below average in this model’s assessment.
- Higher is Stronger
- All three model scores are 0–100: a higher number means the model rates this horse more favorably among the field.
Mod1(W): 82 (1/8) Mod2(W): 75 (2/8) Mod3(W): 79 (3/8) Mod1-LS: 55 (6/8) Win Prob: 18.4% Value Score: 1.35 ★
Performance vs. Peers Guide
- Bars (per post)
- Blue = avg career performance • Amber = avg last 3 races • Green = last race (improved vs. avg) • Red = last race (declined vs. avg)
- Trend Line
- Angled line above the bars: rising = improving form • falling = declining form.
- Horizontal Line
- Field average — the mean career performance of all horses in this race.
- Color Circles
- Standard post-position colors below each lane — same as the Total Pace chart.
- Border
- Thicker border = this horse’s post position.
Figure Comparison
- Rating
- The three Pick Pony algorithm ratings (Algo 1, Algo 2, Algo 3) that make up the overall PP AI Rating — higher is a stronger contender rating.
- Speed
- Career average speed, recent 3-race average, and last-race speed figure — spot horses in improving or declining form.
- Pace
- Average Early (E1), Mid (E2), and Stretch (LP) pace figures — reveals pace-setters vs. closers vs. all-the-way types.
- This horse
- The horse whose stats card is open is highlighted with a darker column background.
Winning Profiles
- Axes
- X: Win % from last 10 starts — Y: In-the-money % (top-3 finishes) from last 10 starts.
- Quadrants
- Consistent Winners (top-right): high win & ITM — reliable performers.
Place Threats (top-left): boards often but doesn’t win often — good exacta/trifecta angles.
Streaky (bottom-right): wins occasionally, misses the board often — all-or-nothing.
Developing (bottom-left): still finding form — longshot territory. - Reference Lines
- Dashed lines mark field averages. Dots to the right win more; dots higher board more.
- This horse
- Highlighted with a gold border and larger dot.
AI Model Comparison
- Winner Models (green)
- Mod1(W), Mod2(W), and Mod3(W) trained to predict race winners. Higher score = stronger contender.
- Longshot Models (red)
- Mod1-LS, Mod2-LS, and Mod3-LS trained to find high-value longshots. Higher score = stronger longshot candidate.
- Form Model (blue)
- Mod4 sequence model trained on recent form patterns. Higher score = stronger recent form profile.
- This horse
- Highlighted with a darker column background.
Race Pace Simulation Guide
- Slider
- Drag left→right to advance from gate to finish. Drag all the way back to reset the race.
- Predicted Finish Order
- Factors in contested pace burn, each horse’s effort curve (peaked-early vs. peaked-late), and wide trip cost from outside posts. Updated live when Track Bias changes.
- Pace Scenario
- Lone Speed: single E horse likely rates and holds. Contested: two E horses burn each other — closers benefit. Hot Pace: speed meltdown, deep closers thrive. Soft: no early speed, moderate fractions throughout.
- Track Bias
- Slider below canvas. −2 = strong closer/wet bias; +2 = strong speed/rail bias. Recomputes the predicted finish order.
- Boxed Indicator
- Dashed orange ring = horse is surrounded (rival ahead, rival behind, wall outside). In a real race this horse must find a clear path to run.
- Running Styles
- E/EE = early speed (rushes to rail). P = presser (stalks the pace). S = stalker. SS = slow starter / closer.
| Stat | vs. Current Card | vs. All Horses |
|---|---|---|
| Averages
Career-average metrics across all AI race analysis. Performance and pace averages reflect estimated historical performance; trainer and jockey grades score in-the-money percentages. Grading scale: A = elite • B = above average • C = average • D = below average • F = poor • — = no data |
||
| Pick Pony AI Rating | A | B |
| Pace Trip Longshot | — | — |
| Connections Longshot | — | — |
| Situational Longshot | — | — |
| Speed | C | B |
| Early Pace | C | C |
| Mid Pace | B | C |
| Late Pace | C | B |
| Finish Pos | C | C |
| Dirt Speed | C | B |
| Turf Speed | B | A |
| Distance Speed | B | B |
| Trainer Effectiveness | B | B |
| Jockey Effectiveness | A | A |
| 3rd Party Ratings | B | B |
| Recent
Performance analysis from the horse's recent races, weighted to reflect current form. Sprint and Route FPS (Foot Per Second) measure pace efficiency over the horse's recent sprints and routes respectively. Grading scale: A = elite • B = above average • C = average • D = below average • F = poor • — = no data |
||
| Speed | C | B |
| Early Pace | C | C |
| Mid Pace | C | C |
| Late Pace | A | A |
| Sprint FPS | A | A |
| Route FPS | A | B |
| Trainer Effectiveness | B | B |
| Jockey Effectiveness | A | A |
| 3rd Party Ratings | B | B |
| Predictions
AI-generated projections for the upcoming race, derived from prior AI analysis for speed and pace trends, surface and distance suitability, and current conditions. Grading scale: A = elite • B = above average • C = average • D = below average • F = poor • — = no data |
||
| Speed | C | C |
| Early Pace | C | C |
| Mid Pace | B | C |
| Late Pace | C | C |
Chart Guide (2.0.36)
- Bubbles
- Color = surface: green (turf), brown (dirt), blue (synthetic)
- Top number = finishing position; bottom number in parentheses = starting post position
- Height above line = beaten lengths — closer means a smaller margin
- Border = track conditions: green (FST/GD/FM), yellow (WF/SL/YLD), red (SY/MY/FRZ/SFT/HVY)
- Connecting Line
- Solid = good conditions; dashed = bad conditions
- Line Symbol
- ▲ Triangle = sprint (7f or less); ● Circle = route (more than 7f)
- Days Between Races
- Small number above each bubble (e.g. 19d) = days since the previous race — helps spot freshness, layoffs, and tight scheduling.
- Shaded Band (Bollinger)
- Highlights volatility — a wider band means more variation in recent performance
- Performance Trend
- Straight line showing the overall performance direction — angled up = improving, angled down = declining
- Dashed Reference Line
- AI Opponent = AI analysis class-level par for the race
AI Model History Guide
- Lines
- Each solid line shows this horse’s model score over its last 10 races: blue = Mod1, green = Mod2, amber = Mod3.
- Dashed Lines
- Dashed lines represent the current race’s field average for each model — a score below the dashed line indicates the horse ranked below average in this model’s assessment.
- Higher is Stronger
- All three model scores are 0–100: a higher number means the model rates this horse more favorably among the field.
Mod1(W): 82 (1/8) Mod2(W): 75 (2/8) Mod3(W): 79 (3/8) Mod1-LS: 55 (6/8) Win Prob: 18.4% Value Score: 1.35 ★
Performance vs. Peers Guide
- Bars (per post)
- Blue = avg career performance • Amber = avg last 3 races • Green = last race (improved vs. avg) • Red = last race (declined vs. avg)
- Trend Line
- Angled line above the bars: rising = improving form • falling = declining form.
- Horizontal Line
- Field average — the mean career performance of all horses in this race.
- Color Circles
- Standard post-position colors below each lane — same as the Total Pace chart.
- Border
- Thicker border = this horse’s post position.
Figure Comparison
- Rating
- The three Pick Pony algorithm ratings (Algo 1, Algo 2, Algo 3) that make up the overall PP AI Rating — higher is a stronger contender rating.
- Speed
- Career average speed, recent 3-race average, and last-race speed figure — spot horses in improving or declining form.
- Pace
- Average Early (E1), Mid (E2), and Stretch (LP) pace figures — reveals pace-setters vs. closers vs. all-the-way types.
- This horse
- The horse whose stats card is open is highlighted with a darker column background.
Winning Profiles
- Axes
- X: Win % from last 10 starts — Y: In-the-money % (top-3 finishes) from last 10 starts.
- Quadrants
- Consistent Winners (top-right): high win & ITM — reliable performers.
Place Threats (top-left): boards often but doesn’t win often — good exacta/trifecta angles.
Streaky (bottom-right): wins occasionally, misses the board often — all-or-nothing.
Developing (bottom-left): still finding form — longshot territory. - Reference Lines
- Dashed lines mark field averages. Dots to the right win more; dots higher board more.
- This horse
- Highlighted with a gold border and larger dot.
AI Model Comparison
- Winner Models (green)
- Mod1(W), Mod2(W), and Mod3(W) trained to predict race winners. Higher score = stronger contender.
- Longshot Models (red)
- Mod1-LS, Mod2-LS, and Mod3-LS trained to find high-value longshots. Higher score = stronger longshot candidate.
- Form Model (blue)
- Mod4 sequence model trained on recent form patterns. Higher score = stronger recent form profile.
- This horse
- Highlighted with a darker column background.
Race Pace Simulation Guide
- Slider
- Drag left→right to advance from gate to finish. Drag all the way back to reset the race.
- Predicted Finish Order
- Factors in contested pace burn, each horse’s effort curve (peaked-early vs. peaked-late), and wide trip cost from outside posts. Updated live when Track Bias changes.
- Pace Scenario
- Lone Speed: single E horse likely rates and holds. Contested: two E horses burn each other — closers benefit. Hot Pace: speed meltdown, deep closers thrive. Soft: no early speed, moderate fractions throughout.
- Track Bias
- Slider below canvas. −2 = strong closer/wet bias; +2 = strong speed/rail bias. Recomputes the predicted finish order.
- Boxed Indicator
- Dashed orange ring = horse is surrounded (rival ahead, rival behind, wall outside). In a real race this horse must find a clear path to run.
- Running Styles
- E/EE = early speed (rushes to rail). P = presser (stalks the pace). S = stalker. SS = slow starter / closer.
| Stat | vs. Current Card | vs. All Horses |
|---|---|---|
| Averages
Career-average metrics across all AI race analysis. Performance and pace averages reflect estimated historical performance; trainer and jockey grades score in-the-money percentages. Grading scale: A = elite • B = above average • C = average • D = below average • F = poor • — = no data |
||
| Pick Pony AI Rating | A | A |
| Pace Trip Longshot | — | — |
| Connections Longshot | — | — |
| Situational Longshot | — | — |
| Speed | A | B |
| Early Pace | A | A |
| Mid Pace | B | A |
| Late Pace | B | B |
| Finish Pos | B | B |
| Dirt Speed | D | D |
| Turf Speed | A | A |
| Distance Speed | A | A |
| Trainer Effectiveness | A | A |
| Jockey Effectiveness | B | B |
| 3rd Party Ratings | A | A |
| Recent
Performance analysis from the horse's recent races, weighted to reflect current form. Sprint and Route FPS (Foot Per Second) measure pace efficiency over the horse's recent sprints and routes respectively. Grading scale: A = elite • B = above average • C = average • D = below average • F = poor • — = no data |
||
| Speed | C | B |
| Early Pace | A | A |
| Mid Pace | B | A |
| Late Pace | D | C |
| Sprint FPS | A | A |
| Route FPS | A | A |
| Trainer Effectiveness | A | A |
| Jockey Effectiveness | B | B |
| 3rd Party Ratings | A | A |
| Predictions
AI-generated projections for the upcoming race, derived from prior AI analysis for speed and pace trends, surface and distance suitability, and current conditions. Grading scale: A = elite • B = above average • C = average • D = below average • F = poor • — = no data |
||
| Speed | D | C |
| Early Pace | A | A |
| Mid Pace | B | A |
| Late Pace | C | C |
Chart Guide (2.0.36)
- Bubbles
- Color = surface: green (turf), brown (dirt), blue (synthetic)
- Top number = finishing position; bottom number in parentheses = starting post position
- Height above line = beaten lengths — closer means a smaller margin
- Border = track conditions: green (FST/GD/FM), yellow (WF/SL/YLD), red (SY/MY/FRZ/SFT/HVY)
- Connecting Line
- Solid = good conditions; dashed = bad conditions
- Line Symbol
- ▲ Triangle = sprint (7f or less); ● Circle = route (more than 7f)
- Days Between Races
- Small number above each bubble (e.g. 19d) = days since the previous race — helps spot freshness, layoffs, and tight scheduling.
- Shaded Band (Bollinger)
- Highlights volatility — a wider band means more variation in recent performance
- Performance Trend
- Straight line showing the overall performance direction — angled up = improving, angled down = declining
- Dashed Reference Line
- AI Opponent = AI analysis class-level par for the race
AI Model History Guide
- Lines
- Each solid line shows this horse’s model score over its last 10 races: blue = Mod1, green = Mod2, amber = Mod3.
- Dashed Lines
- Dashed lines represent the current race’s field average for each model — a score below the dashed line indicates the horse ranked below average in this model’s assessment.
- Higher is Stronger
- All three model scores are 0–100: a higher number means the model rates this horse more favorably among the field.
Mod1(W): 82 (1/8) Mod2(W): 75 (2/8) Mod3(W): 79 (3/8) Mod1-LS: 55 (6/8) Win Prob: 18.4% Value Score: 1.35 ★
Performance vs. Peers Guide
- Bars (per post)
- Blue = avg career performance • Amber = avg last 3 races • Green = last race (improved vs. avg) • Red = last race (declined vs. avg)
- Trend Line
- Angled line above the bars: rising = improving form • falling = declining form.
- Horizontal Line
- Field average — the mean career performance of all horses in this race.
- Color Circles
- Standard post-position colors below each lane — same as the Total Pace chart.
- Border
- Thicker border = this horse’s post position.
Figure Comparison
- Rating
- The three Pick Pony algorithm ratings (Algo 1, Algo 2, Algo 3) that make up the overall PP AI Rating — higher is a stronger contender rating.
- Speed
- Career average speed, recent 3-race average, and last-race speed figure — spot horses in improving or declining form.
- Pace
- Average Early (E1), Mid (E2), and Stretch (LP) pace figures — reveals pace-setters vs. closers vs. all-the-way types.
- This horse
- The horse whose stats card is open is highlighted with a darker column background.
Winning Profiles
- Axes
- X: Win % from last 10 starts — Y: In-the-money % (top-3 finishes) from last 10 starts.
- Quadrants
- Consistent Winners (top-right): high win & ITM — reliable performers.
Place Threats (top-left): boards often but doesn’t win often — good exacta/trifecta angles.
Streaky (bottom-right): wins occasionally, misses the board often — all-or-nothing.
Developing (bottom-left): still finding form — longshot territory. - Reference Lines
- Dashed lines mark field averages. Dots to the right win more; dots higher board more.
- This horse
- Highlighted with a gold border and larger dot.
AI Model Comparison
- Winner Models (green)
- Mod1(W), Mod2(W), and Mod3(W) trained to predict race winners. Higher score = stronger contender.
- Longshot Models (red)
- Mod1-LS, Mod2-LS, and Mod3-LS trained to find high-value longshots. Higher score = stronger longshot candidate.
- Form Model (blue)
- Mod4 sequence model trained on recent form patterns. Higher score = stronger recent form profile.
- This horse
- Highlighted with a darker column background.
Race Pace Simulation Guide
- Slider
- Drag left→right to advance from gate to finish. Drag all the way back to reset the race.
- Predicted Finish Order
- Factors in contested pace burn, each horse’s effort curve (peaked-early vs. peaked-late), and wide trip cost from outside posts. Updated live when Track Bias changes.
- Pace Scenario
- Lone Speed: single E horse likely rates and holds. Contested: two E horses burn each other — closers benefit. Hot Pace: speed meltdown, deep closers thrive. Soft: no early speed, moderate fractions throughout.
- Track Bias
- Slider below canvas. −2 = strong closer/wet bias; +2 = strong speed/rail bias. Recomputes the predicted finish order.
- Boxed Indicator
- Dashed orange ring = horse is surrounded (rival ahead, rival behind, wall outside). In a real race this horse must find a clear path to run.
- Running Styles
- E/EE = early speed (rushes to rail). P = presser (stalks the pace). S = stalker. SS = slow starter / closer.
| Stat | vs. Current Card | vs. All Horses |
|---|---|---|
| Averages
Career-average metrics across all AI race analysis. Performance and pace averages reflect estimated historical performance; trainer and jockey grades score in-the-money percentages. Grading scale: A = elite • B = above average • C = average • D = below average • F = poor • — = no data |
||
| Pick Pony AI Rating | A | B |
| Pace Trip Longshot | — | — |
| Connections Longshot | — | — |
| Situational Longshot | — | — |
| Speed | B | B |
| Early Pace | B | A |
| Mid Pace | B | A |
| Late Pace | C | C |
| Finish Pos | D | C |
| Dirt Speed | B | B |
| Turf Speed | B | A |
| Distance Speed | A | A |
| Trainer Effectiveness | B | B |
| Jockey Effectiveness | A | A |
| 3rd Party Ratings | A | B |
| Recent
Performance analysis from the horse's recent races, weighted to reflect current form. Sprint and Route FPS (Foot Per Second) measure pace efficiency over the horse's recent sprints and routes respectively. Grading scale: A = elite • B = above average • C = average • D = below average • F = poor • — = no data |
||
| Speed | C | B |
| Early Pace | B | A |
| Mid Pace | C | B |
| Late Pace | A | A |
| Sprint FPS | A | A |
| Route FPS | A | A |
| Trainer Effectiveness | B | B |
| Jockey Effectiveness | A | A |
| 3rd Party Ratings | A | B |
| Predictions
AI-generated projections for the upcoming race, derived from prior AI analysis for speed and pace trends, surface and distance suitability, and current conditions. Grading scale: A = elite • B = above average • C = average • D = below average • F = poor • — = no data |
||
| Speed | B | B |
| Early Pace | B | A |
| Mid Pace | B | A |
| Late Pace | C | C |
Chart Guide (2.0.36)
- Bubbles
- Color = surface: green (turf), brown (dirt), blue (synthetic)
- Top number = finishing position; bottom number in parentheses = starting post position
- Height above line = beaten lengths — closer means a smaller margin
- Border = track conditions: green (FST/GD/FM), yellow (WF/SL/YLD), red (SY/MY/FRZ/SFT/HVY)
- Connecting Line
- Solid = good conditions; dashed = bad conditions
- Line Symbol
- ▲ Triangle = sprint (7f or less); ● Circle = route (more than 7f)
- Days Between Races
- Small number above each bubble (e.g. 19d) = days since the previous race — helps spot freshness, layoffs, and tight scheduling.
- Shaded Band (Bollinger)
- Highlights volatility — a wider band means more variation in recent performance
- Performance Trend
- Straight line showing the overall performance direction — angled up = improving, angled down = declining
- Dashed Reference Line
- AI Opponent = AI analysis class-level par for the race
AI Model History Guide
- Lines
- Each solid line shows this horse’s model score over its last 10 races: blue = Mod1, green = Mod2, amber = Mod3.
- Dashed Lines
- Dashed lines represent the current race’s field average for each model — a score below the dashed line indicates the horse ranked below average in this model’s assessment.
- Higher is Stronger
- All three model scores are 0–100: a higher number means the model rates this horse more favorably among the field.
Mod1(W): 82 (1/8) Mod2(W): 75 (2/8) Mod3(W): 79 (3/8) Mod1-LS: 55 (6/8) Win Prob: 18.4% Value Score: 1.35 ★
Performance vs. Peers Guide
- Bars (per post)
- Blue = avg career performance • Amber = avg last 3 races • Green = last race (improved vs. avg) • Red = last race (declined vs. avg)
- Trend Line
- Angled line above the bars: rising = improving form • falling = declining form.
- Horizontal Line
- Field average — the mean career performance of all horses in this race.
- Color Circles
- Standard post-position colors below each lane — same as the Total Pace chart.
- Border
- Thicker border = this horse’s post position.
Figure Comparison
- Rating
- The three Pick Pony algorithm ratings (Algo 1, Algo 2, Algo 3) that make up the overall PP AI Rating — higher is a stronger contender rating.
- Speed
- Career average speed, recent 3-race average, and last-race speed figure — spot horses in improving or declining form.
- Pace
- Average Early (E1), Mid (E2), and Stretch (LP) pace figures — reveals pace-setters vs. closers vs. all-the-way types.
- This horse
- The horse whose stats card is open is highlighted with a darker column background.
Winning Profiles
- Axes
- X: Win % from last 10 starts — Y: In-the-money % (top-3 finishes) from last 10 starts.
- Quadrants
- Consistent Winners (top-right): high win & ITM — reliable performers.
Place Threats (top-left): boards often but doesn’t win often — good exacta/trifecta angles.
Streaky (bottom-right): wins occasionally, misses the board often — all-or-nothing.
Developing (bottom-left): still finding form — longshot territory. - Reference Lines
- Dashed lines mark field averages. Dots to the right win more; dots higher board more.
- This horse
- Highlighted with a gold border and larger dot.
AI Model Comparison
- Winner Models (green)
- Mod1(W), Mod2(W), and Mod3(W) trained to predict race winners. Higher score = stronger contender.
- Longshot Models (red)
- Mod1-LS, Mod2-LS, and Mod3-LS trained to find high-value longshots. Higher score = stronger longshot candidate.
- Form Model (blue)
- Mod4 sequence model trained on recent form patterns. Higher score = stronger recent form profile.
- This horse
- Highlighted with a darker column background.
Race Pace Simulation Guide
- Slider
- Drag left→right to advance from gate to finish. Drag all the way back to reset the race.
- Predicted Finish Order
- Factors in contested pace burn, each horse’s effort curve (peaked-early vs. peaked-late), and wide trip cost from outside posts. Updated live when Track Bias changes.
- Pace Scenario
- Lone Speed: single E horse likely rates and holds. Contested: two E horses burn each other — closers benefit. Hot Pace: speed meltdown, deep closers thrive. Soft: no early speed, moderate fractions throughout.
- Track Bias
- Slider below canvas. −2 = strong closer/wet bias; +2 = strong speed/rail bias. Recomputes the predicted finish order.
- Boxed Indicator
- Dashed orange ring = horse is surrounded (rival ahead, rival behind, wall outside). In a real race this horse must find a clear path to run.
- Running Styles
- E/EE = early speed (rushes to rail). P = presser (stalks the pace). S = stalker. SS = slow starter / closer.
| Stat | vs. Current Card | vs. All Horses |
|---|---|---|
| Averages
Career-average metrics across all AI race analysis. Performance and pace averages reflect estimated historical performance; trainer and jockey grades score in-the-money percentages. Grading scale: A = elite • B = above average • C = average • D = below average • F = poor • — = no data |
||
| Pick Pony AI Rating | C | C |
| Pace Trip Longshot | — | — |
| Connections Longshot | — | — |
| Situational Longshot | — | — |
| Speed | A | B |
| Early Pace | B | A |
| Mid Pace | A | A |
| Late Pace | D | C |
| Finish Pos | F | F |
| Dirt Speed | F | F |
| Turf Speed | B | A |
| Distance Speed | C | B |
| Trainer Effectiveness | A | A |
| Jockey Effectiveness | D | C |
| 3rd Party Ratings | B | B |
| Recent
Performance analysis from the horse's recent races, weighted to reflect current form. Sprint and Route FPS (Foot Per Second) measure pace efficiency over the horse's recent sprints and routes respectively. Grading scale: A = elite • B = above average • C = average • D = below average • F = poor • — = no data |
||
| Speed | B | B |
| Early Pace | B | A |
| Mid Pace | A | A |
| Late Pace | D | C |
| Sprint FPS | C | B |
| Route FPS | C | C |
| Trainer Effectiveness | A | A |
| Jockey Effectiveness | D | C |
| 3rd Party Ratings | B | B |
| Predictions
AI-generated projections for the upcoming race, derived from prior AI analysis for speed and pace trends, surface and distance suitability, and current conditions. Grading scale: A = elite • B = above average • C = average • D = below average • F = poor • — = no data |
||
| Speed | A | B |
| Early Pace | B | A |
| Mid Pace | A | A |
| Late Pace | C | C |
Chart Guide (2.0.36)
- Bubbles
- Color = surface: green (turf), brown (dirt), blue (synthetic)
- Top number = finishing position; bottom number in parentheses = starting post position
- Height above line = beaten lengths — closer means a smaller margin
- Border = track conditions: green (FST/GD/FM), yellow (WF/SL/YLD), red (SY/MY/FRZ/SFT/HVY)
- Connecting Line
- Solid = good conditions; dashed = bad conditions
- Line Symbol
- ▲ Triangle = sprint (7f or less); ● Circle = route (more than 7f)
- Days Between Races
- Small number above each bubble (e.g. 19d) = days since the previous race — helps spot freshness, layoffs, and tight scheduling.
- Shaded Band (Bollinger)
- Highlights volatility — a wider band means more variation in recent performance
- Performance Trend
- Straight line showing the overall performance direction — angled up = improving, angled down = declining
- Dashed Reference Line
- AI Opponent = AI analysis class-level par for the race
AI Model History Guide
- Lines
- Each solid line shows this horse’s model score over its last 10 races: blue = Mod1, green = Mod2, amber = Mod3.
- Dashed Lines
- Dashed lines represent the current race’s field average for each model — a score below the dashed line indicates the horse ranked below average in this model’s assessment.
- Higher is Stronger
- All three model scores are 0–100: a higher number means the model rates this horse more favorably among the field.
Mod1(W): 82 (1/8) Mod2(W): 75 (2/8) Mod3(W): 79 (3/8) Mod1-LS: 55 (6/8) Win Prob: 18.4% Value Score: 1.35 ★
Performance vs. Peers Guide
- Bars (per post)
- Blue = avg career performance • Amber = avg last 3 races • Green = last race (improved vs. avg) • Red = last race (declined vs. avg)
- Trend Line
- Angled line above the bars: rising = improving form • falling = declining form.
- Horizontal Line
- Field average — the mean career performance of all horses in this race.
- Color Circles
- Standard post-position colors below each lane — same as the Total Pace chart.
- Border
- Thicker border = this horse’s post position.
Figure Comparison
- Rating
- The three Pick Pony algorithm ratings (Algo 1, Algo 2, Algo 3) that make up the overall PP AI Rating — higher is a stronger contender rating.
- Speed
- Career average speed, recent 3-race average, and last-race speed figure — spot horses in improving or declining form.
- Pace
- Average Early (E1), Mid (E2), and Stretch (LP) pace figures — reveals pace-setters vs. closers vs. all-the-way types.
- This horse
- The horse whose stats card is open is highlighted with a darker column background.
Winning Profiles
- Axes
- X: Win % from last 10 starts — Y: In-the-money % (top-3 finishes) from last 10 starts.
- Quadrants
- Consistent Winners (top-right): high win & ITM — reliable performers.
Place Threats (top-left): boards often but doesn’t win often — good exacta/trifecta angles.
Streaky (bottom-right): wins occasionally, misses the board often — all-or-nothing.
Developing (bottom-left): still finding form — longshot territory. - Reference Lines
- Dashed lines mark field averages. Dots to the right win more; dots higher board more.
- This horse
- Highlighted with a gold border and larger dot.
AI Model Comparison
- Winner Models (green)
- Mod1(W), Mod2(W), and Mod3(W) trained to predict race winners. Higher score = stronger contender.
- Longshot Models (red)
- Mod1-LS, Mod2-LS, and Mod3-LS trained to find high-value longshots. Higher score = stronger longshot candidate.
- Form Model (blue)
- Mod4 sequence model trained on recent form patterns. Higher score = stronger recent form profile.
- This horse
- Highlighted with a darker column background.
Race Pace Simulation Guide
- Slider
- Drag left→right to advance from gate to finish. Drag all the way back to reset the race.
- Predicted Finish Order
- Factors in contested pace burn, each horse’s effort curve (peaked-early vs. peaked-late), and wide trip cost from outside posts. Updated live when Track Bias changes.
- Pace Scenario
- Lone Speed: single E horse likely rates and holds. Contested: two E horses burn each other — closers benefit. Hot Pace: speed meltdown, deep closers thrive. Soft: no early speed, moderate fractions throughout.
- Track Bias
- Slider below canvas. −2 = strong closer/wet bias; +2 = strong speed/rail bias. Recomputes the predicted finish order.
- Boxed Indicator
- Dashed orange ring = horse is surrounded (rival ahead, rival behind, wall outside). In a real race this horse must find a clear path to run.
- Running Styles
- E/EE = early speed (rushes to rail). P = presser (stalks the pace). S = stalker. SS = slow starter / closer.
| Stat | vs. Current Card | vs. All Horses |
|---|---|---|
| Averages
Career-average metrics across all AI race analysis. Performance and pace averages reflect estimated historical performance; trainer and jockey grades score in-the-money percentages. Grading scale: A = elite • B = above average • C = average • D = below average • F = poor • — = no data |
||
| Pick Pony AI Rating | B | B |
| Pace Trip Longshot | — | — |
| Connections Longshot | — | — |
| Situational Longshot | — | — |
| Speed | C | B |
| Early Pace | C | B |
| Mid Pace | C | A |
| Late Pace | A | B |
| Finish Pos | A | B |
| Dirt Speed | B | B |
| Turf Speed | D | B |
| Distance Speed | D | C |
| Trainer Effectiveness | A | A |
| Jockey Effectiveness | A | B |
| 3rd Party Ratings | B | B |
| Recent
Performance analysis from the horse's recent races, weighted to reflect current form. Sprint and Route FPS (Foot Per Second) measure pace efficiency over the horse's recent sprints and routes respectively. Grading scale: A = elite • B = above average • C = average • D = below average • F = poor • — = no data |
||
| Speed | A | B |
| Early Pace | C | B |
| Mid Pace | B | A |
| Late Pace | A | A |
| Sprint FPS | B | A |
| Route FPS | A | A |
| Trainer Effectiveness | A | A |
| Jockey Effectiveness | A | B |
| 3rd Party Ratings | B | B |
| Predictions
AI-generated projections for the upcoming race, derived from prior AI analysis for speed and pace trends, surface and distance suitability, and current conditions. Grading scale: A = elite • B = above average • C = average • D = below average • F = poor • — = no data |
||
| Speed | B | B |
| Early Pace | C | B |
| Mid Pace | C | A |
| Late Pace | C | C |
Chart Guide (2.0.36)
- Bubbles
- Color = surface: green (turf), brown (dirt), blue (synthetic)
- Top number = finishing position; bottom number in parentheses = starting post position
- Height above line = beaten lengths — closer means a smaller margin
- Border = track conditions: green (FST/GD/FM), yellow (WF/SL/YLD), red (SY/MY/FRZ/SFT/HVY)
- Connecting Line
- Solid = good conditions; dashed = bad conditions
- Line Symbol
- ▲ Triangle = sprint (7f or less); ● Circle = route (more than 7f)
- Days Between Races
- Small number above each bubble (e.g. 19d) = days since the previous race — helps spot freshness, layoffs, and tight scheduling.
- Shaded Band (Bollinger)
- Highlights volatility — a wider band means more variation in recent performance
- Performance Trend
- Straight line showing the overall performance direction — angled up = improving, angled down = declining
- Dashed Reference Line
- AI Opponent = AI analysis class-level par for the race
AI Model History Guide
- Lines
- Each solid line shows this horse’s model score over its last 10 races: blue = Mod1, green = Mod2, amber = Mod3.
- Dashed Lines
- Dashed lines represent the current race’s field average for each model — a score below the dashed line indicates the horse ranked below average in this model’s assessment.
- Higher is Stronger
- All three model scores are 0–100: a higher number means the model rates this horse more favorably among the field.
Mod1(W): 82 (1/8) Mod2(W): 75 (2/8) Mod3(W): 79 (3/8) Mod1-LS: 55 (6/8) Win Prob: 18.4% Value Score: 1.35 ★
Performance vs. Peers Guide
- Bars (per post)
- Blue = avg career performance • Amber = avg last 3 races • Green = last race (improved vs. avg) • Red = last race (declined vs. avg)
- Trend Line
- Angled line above the bars: rising = improving form • falling = declining form.
- Horizontal Line
- Field average — the mean career performance of all horses in this race.
- Color Circles
- Standard post-position colors below each lane — same as the Total Pace chart.
- Border
- Thicker border = this horse’s post position.
Figure Comparison
- Rating
- The three Pick Pony algorithm ratings (Algo 1, Algo 2, Algo 3) that make up the overall PP AI Rating — higher is a stronger contender rating.
- Speed
- Career average speed, recent 3-race average, and last-race speed figure — spot horses in improving or declining form.
- Pace
- Average Early (E1), Mid (E2), and Stretch (LP) pace figures — reveals pace-setters vs. closers vs. all-the-way types.
- This horse
- The horse whose stats card is open is highlighted with a darker column background.
Winning Profiles
- Axes
- X: Win % from last 10 starts — Y: In-the-money % (top-3 finishes) from last 10 starts.
- Quadrants
- Consistent Winners (top-right): high win & ITM — reliable performers.
Place Threats (top-left): boards often but doesn’t win often — good exacta/trifecta angles.
Streaky (bottom-right): wins occasionally, misses the board often — all-or-nothing.
Developing (bottom-left): still finding form — longshot territory. - Reference Lines
- Dashed lines mark field averages. Dots to the right win more; dots higher board more.
- This horse
- Highlighted with a gold border and larger dot.
AI Model Comparison
- Winner Models (green)
- Mod1(W), Mod2(W), and Mod3(W) trained to predict race winners. Higher score = stronger contender.
- Longshot Models (red)
- Mod1-LS, Mod2-LS, and Mod3-LS trained to find high-value longshots. Higher score = stronger longshot candidate.
- Form Model (blue)
- Mod4 sequence model trained on recent form patterns. Higher score = stronger recent form profile.
- This horse
- Highlighted with a darker column background.
Race Pace Simulation Guide
- Slider
- Drag left→right to advance from gate to finish. Drag all the way back to reset the race.
- Predicted Finish Order
- Factors in contested pace burn, each horse’s effort curve (peaked-early vs. peaked-late), and wide trip cost from outside posts. Updated live when Track Bias changes.
- Pace Scenario
- Lone Speed: single E horse likely rates and holds. Contested: two E horses burn each other — closers benefit. Hot Pace: speed meltdown, deep closers thrive. Soft: no early speed, moderate fractions throughout.
- Track Bias
- Slider below canvas. −2 = strong closer/wet bias; +2 = strong speed/rail bias. Recomputes the predicted finish order.
- Boxed Indicator
- Dashed orange ring = horse is surrounded (rival ahead, rival behind, wall outside). In a real race this horse must find a clear path to run.
- Running Styles
- E/EE = early speed (rushes to rail). P = presser (stalks the pace). S = stalker. SS = slow starter / closer.
| Stat | vs. Current Card | vs. All Horses |
|---|---|---|
| Averages
Career-average metrics across all AI race analysis. Performance and pace averages reflect estimated historical performance; trainer and jockey grades score in-the-money percentages. Grading scale: A = elite • B = above average • C = average • D = below average • F = poor • — = no data |
||
| Pick Pony AI Rating | B | B |
| Pace Trip Longshot | — | — |
| Connections Longshot | — | — |
| Situational Longshot | — | — |
| Speed | A | A |
| Early Pace | B | A |
| Mid Pace | B | A |
| Late Pace | A | A |
| Finish Pos | B | B |
| Dirt Speed | B | B |
| Turf Speed | C | D |
| Distance Speed | C | F |
| Trainer Effectiveness | B | C |
| Jockey Effectiveness | D | B |
| 3rd Party Ratings | B | B |
| Recent
Performance analysis from the horse's recent races, weighted to reflect current form. Sprint and Route FPS (Foot Per Second) measure pace efficiency over the horse's recent sprints and routes respectively. Grading scale: A = elite • B = above average • C = average • D = below average • F = poor • — = no data |
||
| Speed | A | A |
| Early Pace | B | B |
| Mid Pace | B | A |
| Late Pace | A | A |
| Sprint FPS | A | A |
| Route FPS | A | A |
| Trainer Effectiveness | B | C |
| Jockey Effectiveness | D | B |
| 3rd Party Ratings | B | B |
| Predictions
AI-generated projections for the upcoming race, derived from prior AI analysis for speed and pace trends, surface and distance suitability, and current conditions. Grading scale: A = elite • B = above average • C = average • D = below average • F = poor • — = no data |
||
| Speed | B | A |
| Early Pace | D | F |
| Mid Pace | D | F |
| Late Pace | C | C |
Chart Guide (2.0.36)
- Bubbles
- Color = surface: green (turf), brown (dirt), blue (synthetic)
- Top number = finishing position; bottom number in parentheses = starting post position
- Height above line = beaten lengths — closer means a smaller margin
- Border = track conditions: green (FST/GD/FM), yellow (WF/SL/YLD), red (SY/MY/FRZ/SFT/HVY)
- Connecting Line
- Solid = good conditions; dashed = bad conditions
- Line Symbol
- ▲ Triangle = sprint (7f or less); ● Circle = route (more than 7f)
- Days Between Races
- Small number above each bubble (e.g. 19d) = days since the previous race — helps spot freshness, layoffs, and tight scheduling.
- Shaded Band (Bollinger)
- Highlights volatility — a wider band means more variation in recent performance
- Performance Trend
- Straight line showing the overall performance direction — angled up = improving, angled down = declining
- Dashed Reference Line
- AI Opponent = AI analysis class-level par for the race
AI Model History Guide
- Lines
- Each solid line shows this horse’s model score over its last 10 races: blue = Mod1, green = Mod2, amber = Mod3.
- Dashed Lines
- Dashed lines represent the current race’s field average for each model — a score below the dashed line indicates the horse ranked below average in this model’s assessment.
- Higher is Stronger
- All three model scores are 0–100: a higher number means the model rates this horse more favorably among the field.
Mod1(W): 82 (1/8) Mod2(W): 75 (2/8) Mod3(W): 79 (3/8) Mod1-LS: 55 (6/8) Win Prob: 18.4% Value Score: 1.35 ★
Performance vs. Peers Guide
- Bars (per post)
- Blue = avg career performance • Amber = avg last 3 races • Green = last race (improved vs. avg) • Red = last race (declined vs. avg)
- Trend Line
- Angled line above the bars: rising = improving form • falling = declining form.
- Horizontal Line
- Field average — the mean career performance of all horses in this race.
- Color Circles
- Standard post-position colors below each lane — same as the Total Pace chart.
- Border
- Thicker border = this horse’s post position.
Figure Comparison
- Rating
- The three Pick Pony algorithm ratings (Algo 1, Algo 2, Algo 3) that make up the overall PP AI Rating — higher is a stronger contender rating.
- Speed
- Career average speed, recent 3-race average, and last-race speed figure — spot horses in improving or declining form.
- Pace
- Average Early (E1), Mid (E2), and Stretch (LP) pace figures — reveals pace-setters vs. closers vs. all-the-way types.
- This horse
- The horse whose stats card is open is highlighted with a darker column background.
Winning Profiles
- Axes
- X: Win % from last 10 starts — Y: In-the-money % (top-3 finishes) from last 10 starts.
- Quadrants
- Consistent Winners (top-right): high win & ITM — reliable performers.
Place Threats (top-left): boards often but doesn’t win often — good exacta/trifecta angles.
Streaky (bottom-right): wins occasionally, misses the board often — all-or-nothing.
Developing (bottom-left): still finding form — longshot territory. - Reference Lines
- Dashed lines mark field averages. Dots to the right win more; dots higher board more.
- This horse
- Highlighted with a gold border and larger dot.
AI Model Comparison
- Winner Models (green)
- Mod1(W), Mod2(W), and Mod3(W) trained to predict race winners. Higher score = stronger contender.
- Longshot Models (red)
- Mod1-LS, Mod2-LS, and Mod3-LS trained to find high-value longshots. Higher score = stronger longshot candidate.
- Form Model (blue)
- Mod4 sequence model trained on recent form patterns. Higher score = stronger recent form profile.
- This horse
- Highlighted with a darker column background.
Race Pace Simulation Guide
- Slider
- Drag left→right to advance from gate to finish. Drag all the way back to reset the race.
- Predicted Finish Order
- Factors in contested pace burn, each horse’s effort curve (peaked-early vs. peaked-late), and wide trip cost from outside posts. Updated live when Track Bias changes.
- Pace Scenario
- Lone Speed: single E horse likely rates and holds. Contested: two E horses burn each other — closers benefit. Hot Pace: speed meltdown, deep closers thrive. Soft: no early speed, moderate fractions throughout.
- Track Bias
- Slider below canvas. −2 = strong closer/wet bias; +2 = strong speed/rail bias. Recomputes the predicted finish order.
- Boxed Indicator
- Dashed orange ring = horse is surrounded (rival ahead, rival behind, wall outside). In a real race this horse must find a clear path to run.
- Running Styles
- E/EE = early speed (rushes to rail). P = presser (stalks the pace). S = stalker. SS = slow starter / closer.
| Stat | vs. Current Card | vs. All Horses |
|---|---|---|
| Averages
Career-average metrics across all AI race analysis. Performance and pace averages reflect estimated historical performance; trainer and jockey grades score in-the-money percentages. Grading scale: A = elite • B = above average • C = average • D = below average • F = poor • — = no data |
||
| Pick Pony AI Rating | A | A |
| Pace Trip Longshot | — | — |
| Connections Longshot | — | — |
| Situational Longshot | — | — |
| Speed | A | A |
| Early Pace | A | A |
| Mid Pace | A | A |
| Late Pace | B | B |
| Finish Pos | D | D |
| Dirt Speed | A | A |
| Turf Speed | C | D |
| Distance Speed | A | A |
| Trainer Effectiveness | C | C |
| Jockey Effectiveness | A | A |
| 3rd Party Ratings | A | A |
| Recent
Performance analysis from the horse's recent races, weighted to reflect current form. Sprint and Route FPS (Foot Per Second) measure pace efficiency over the horse's recent sprints and routes respectively. Grading scale: A = elite • B = above average • C = average • D = below average • F = poor • — = no data |
||
| Speed | A | A |
| Early Pace | A | A |
| Mid Pace | A | A |
| Late Pace | B | C |
| Sprint FPS | B | B |
| Route FPS | C | B |
| Trainer Effectiveness | C | C |
| Jockey Effectiveness | A | A |
| 3rd Party Ratings | A | A |
| Predictions
AI-generated projections for the upcoming race, derived from prior AI analysis for speed and pace trends, surface and distance suitability, and current conditions. Grading scale: A = elite • B = above average • C = average • D = below average • F = poor • — = no data |
||
| Speed | A | A |
| Early Pace | B | A |
| Mid Pace | A | A |
| Late Pace | C | C |
Chart Guide (2.0.36)
- Bubbles
- Color = surface: green (turf), brown (dirt), blue (synthetic)
- Top number = finishing position; bottom number in parentheses = starting post position
- Height above line = beaten lengths — closer means a smaller margin
- Border = track conditions: green (FST/GD/FM), yellow (WF/SL/YLD), red (SY/MY/FRZ/SFT/HVY)
- Connecting Line
- Solid = good conditions; dashed = bad conditions
- Line Symbol
- ▲ Triangle = sprint (7f or less); ● Circle = route (more than 7f)
- Days Between Races
- Small number above each bubble (e.g. 19d) = days since the previous race — helps spot freshness, layoffs, and tight scheduling.
- Shaded Band (Bollinger)
- Highlights volatility — a wider band means more variation in recent performance
- Performance Trend
- Straight line showing the overall performance direction — angled up = improving, angled down = declining
- Dashed Reference Line
- AI Opponent = AI analysis class-level par for the race
AI Model History Guide
- Lines
- Each solid line shows this horse’s model score over its last 10 races: blue = Mod1, green = Mod2, amber = Mod3.
- Dashed Lines
- Dashed lines represent the current race’s field average for each model — a score below the dashed line indicates the horse ranked below average in this model’s assessment.
- Higher is Stronger
- All three model scores are 0–100: a higher number means the model rates this horse more favorably among the field.
Mod1(W): 82 (1/8) Mod2(W): 75 (2/8) Mod3(W): 79 (3/8) Mod1-LS: 55 (6/8) Win Prob: 18.4% Value Score: 1.35 ★
Performance vs. Peers Guide
- Bars (per post)
- Blue = avg career performance • Amber = avg last 3 races • Green = last race (improved vs. avg) • Red = last race (declined vs. avg)
- Trend Line
- Angled line above the bars: rising = improving form • falling = declining form.
- Horizontal Line
- Field average — the mean career performance of all horses in this race.
- Color Circles
- Standard post-position colors below each lane — same as the Total Pace chart.
- Border
- Thicker border = this horse’s post position.
Figure Comparison
- Rating
- The three Pick Pony algorithm ratings (Algo 1, Algo 2, Algo 3) that make up the overall PP AI Rating — higher is a stronger contender rating.
- Speed
- Career average speed, recent 3-race average, and last-race speed figure — spot horses in improving or declining form.
- Pace
- Average Early (E1), Mid (E2), and Stretch (LP) pace figures — reveals pace-setters vs. closers vs. all-the-way types.
- This horse
- The horse whose stats card is open is highlighted with a darker column background.
Winning Profiles
- Axes
- X: Win % from last 10 starts — Y: In-the-money % (top-3 finishes) from last 10 starts.
- Quadrants
- Consistent Winners (top-right): high win & ITM — reliable performers.
Place Threats (top-left): boards often but doesn’t win often — good exacta/trifecta angles.
Streaky (bottom-right): wins occasionally, misses the board often — all-or-nothing.
Developing (bottom-left): still finding form — longshot territory. - Reference Lines
- Dashed lines mark field averages. Dots to the right win more; dots higher board more.
- This horse
- Highlighted with a gold border and larger dot.
AI Model Comparison
- Winner Models (green)
- Mod1(W), Mod2(W), and Mod3(W) trained to predict race winners. Higher score = stronger contender.
- Longshot Models (red)
- Mod1-LS, Mod2-LS, and Mod3-LS trained to find high-value longshots. Higher score = stronger longshot candidate.
- Form Model (blue)
- Mod4 sequence model trained on recent form patterns. Higher score = stronger recent form profile.
- This horse
- Highlighted with a darker column background.
Race Pace Simulation Guide
- Slider
- Drag left→right to advance from gate to finish. Drag all the way back to reset the race.
- Predicted Finish Order
- Factors in contested pace burn, each horse’s effort curve (peaked-early vs. peaked-late), and wide trip cost from outside posts. Updated live when Track Bias changes.
- Pace Scenario
- Lone Speed: single E horse likely rates and holds. Contested: two E horses burn each other — closers benefit. Hot Pace: speed meltdown, deep closers thrive. Soft: no early speed, moderate fractions throughout.
- Track Bias
- Slider below canvas. −2 = strong closer/wet bias; +2 = strong speed/rail bias. Recomputes the predicted finish order.
- Boxed Indicator
- Dashed orange ring = horse is surrounded (rival ahead, rival behind, wall outside). In a real race this horse must find a clear path to run.
- Running Styles
- E/EE = early speed (rushes to rail). P = presser (stalks the pace). S = stalker. SS = slow starter / closer.
| Stat | vs. Current Card | vs. All Horses |
|---|---|---|
| Averages
Career-average metrics across all AI race analysis. Performance and pace averages reflect estimated historical performance; trainer and jockey grades score in-the-money percentages. Grading scale: A = elite • B = above average • C = average • D = below average • F = poor • — = no data |
||
| Pick Pony AI Rating | A | A |
| Pace Trip Longshot | — | — |
| Connections Longshot | — | — |
| Situational Longshot | — | — |
| Speed | B | A |
| Early Pace | C | B |
| Mid Pace | C | A |
| Late Pace | A | B |
| Finish Pos | B | B |
| Dirt Speed | A | A |
| Turf Speed | C | D |
| Distance Speed | C | F |
| Trainer Effectiveness | A | A |
| Jockey Effectiveness | B | B |
| 3rd Party Ratings | A | A |
| Recent
Performance analysis from the horse's recent races, weighted to reflect current form. Sprint and Route FPS (Foot Per Second) measure pace efficiency over the horse's recent sprints and routes respectively. Grading scale: A = elite • B = above average • C = average • D = below average • F = poor • — = no data |
||
| Speed | C | B |
| Early Pace | C | B |
| Mid Pace | C | A |
| Late Pace | A | B |
| Sprint FPS | C | B |
| Route FPS | A | A |
| Trainer Effectiveness | A | A |
| Jockey Effectiveness | B | B |
| 3rd Party Ratings | A | A |
| Predictions
AI-generated projections for the upcoming race, derived from prior AI analysis for speed and pace trends, surface and distance suitability, and current conditions. Grading scale: A = elite • B = above average • C = average • D = below average • F = poor • — = no data |
||
| Speed | A | A |
| Early Pace | A | A |
| Mid Pace | A | A |
| Late Pace | C | C |
AI Model History Guide
- Lines
- Each solid line shows this horse’s model score over its last 10 races: blue = Mod1, green = Mod2, amber = Mod3.
- Dashed Lines
- Dashed lines represent the current race’s field average for each model — a score below the dashed line indicates the horse ranked below average in this model’s assessment.
- Higher is Stronger
- All three model scores are 0–100: a higher number means the model rates this horse more favorably among the field.
Mod1(W): 82 (1/8) Mod2(W): 75 (2/8) Mod3(W): 79 (3/8) Mod1-LS: 55 (6/8) Win Prob: 18.4% Value Score: 1.35 ★
Performance vs. Peers Guide
- Bars (per post)
- Blue = avg career performance • Amber = avg last 3 races • Green = last race (improved vs. avg) • Red = last race (declined vs. avg)
- Trend Line
- Angled line above the bars: rising = improving form • falling = declining form.
- Horizontal Line
- Field average — the mean career performance of all horses in this race.
- Color Circles
- Standard post-position colors below each lane — same as the Total Pace chart.
- Border
- Thicker border = this horse’s post position.
Figure Comparison
- Rating
- The three Pick Pony algorithm ratings (Algo 1, Algo 2, Algo 3) that make up the overall PP AI Rating — higher is a stronger contender rating.
- Speed
- Career average speed, recent 3-race average, and last-race speed figure — spot horses in improving or declining form.
- Pace
- Average Early (E1), Mid (E2), and Stretch (LP) pace figures — reveals pace-setters vs. closers vs. all-the-way types.
- This horse
- The horse whose stats card is open is highlighted with a darker column background.
Winning Profiles
- Axes
- X: Win % from last 10 starts — Y: In-the-money % (top-3 finishes) from last 10 starts.
- Quadrants
- Consistent Winners (top-right): high win & ITM — reliable performers.
Place Threats (top-left): boards often but doesn’t win often — good exacta/trifecta angles.
Streaky (bottom-right): wins occasionally, misses the board often — all-or-nothing.
Developing (bottom-left): still finding form — longshot territory. - Reference Lines
- Dashed lines mark field averages. Dots to the right win more; dots higher board more.
- This horse
- Highlighted with a gold border and larger dot.
AI Model Comparison
- Winner Models (green)
- Mod1(W), Mod2(W), and Mod3(W) trained to predict race winners. Higher score = stronger contender.
- Longshot Models (red)
- Mod1-LS, Mod2-LS, and Mod3-LS trained to find high-value longshots. Higher score = stronger longshot candidate.
- Form Model (blue)
- Mod4 sequence model trained on recent form patterns. Higher score = stronger recent form profile.
- This horse
- Highlighted with a darker column background.
Race Pace Simulation Guide
- Slider
- Drag left→right to advance from gate to finish. Drag all the way back to reset the race.
- Predicted Finish Order
- Factors in contested pace burn, each horse’s effort curve (peaked-early vs. peaked-late), and wide trip cost from outside posts. Updated live when Track Bias changes.
- Pace Scenario
- Lone Speed: single E horse likely rates and holds. Contested: two E horses burn each other — closers benefit. Hot Pace: speed meltdown, deep closers thrive. Soft: no early speed, moderate fractions throughout.
- Track Bias
- Slider below canvas. −2 = strong closer/wet bias; +2 = strong speed/rail bias. Recomputes the predicted finish order.
- Boxed Indicator
- Dashed orange ring = horse is surrounded (rival ahead, rival behind, wall outside). In a real race this horse must find a clear path to run.
- Running Styles
- E/EE = early speed (rushes to rail). P = presser (stalks the pace). S = stalker. SS = slow starter / closer.
| Stat | vs. Current Card | vs. All Horses |
|---|---|---|
| Averages
Career-average metrics across all AI race analysis. Performance and pace averages reflect estimated historical performance; trainer and jockey grades score in-the-money percentages. Grading scale: A = elite • B = above average • C = average • D = below average • F = poor • — = no data |
||
| Pick Pony AI Rating | C | C |
| Pace Trip Longshot | — | — |
| Connections Longshot | — | — |
| Situational Longshot | — | — |
| Speed | F | F |
| Early Pace | F | F |
| Mid Pace | F | F |
| Late Pace | F | F |
| Finish Pos | A | A |
| Dirt Speed | D | F |
| Turf Speed | C | D |
| Distance Speed | C | F |
| Trainer Effectiveness | A | B |
| Jockey Effectiveness | A | A |
| 3rd Party Ratings | F | F |
| Recent
Performance analysis from the horse's recent races, weighted to reflect current form. Sprint and Route FPS (Foot Per Second) measure pace efficiency over the horse's recent sprints and routes respectively. Grading scale: A = elite • B = above average • C = average • D = below average • F = poor • — = no data |
||
| Speed | F | F |
| Early Pace | F | F |
| Mid Pace | F | F |
| Late Pace | F | F |
| Sprint FPS | F | F |
| Route FPS | F | F |
| Trainer Effectiveness | A | B |
| Jockey Effectiveness | A | A |
| 3rd Party Ratings | F | F |
| Predictions
AI-generated projections for the upcoming race, derived from prior AI analysis for speed and pace trends, surface and distance suitability, and current conditions. Grading scale: A = elite • B = above average • C = average • D = below average • F = poor • — = no data |
||
| Speed | F | F |
| Early Pace | D | F |
| Mid Pace | D | F |
| Late Pace | C | C |
Chart Guide (2.0.36)
- Bubbles
- Color = surface: green (turf), brown (dirt), blue (synthetic)
- Top number = finishing position; bottom number in parentheses = starting post position
- Height above line = beaten lengths — closer means a smaller margin
- Border = track conditions: green (FST/GD/FM), yellow (WF/SL/YLD), red (SY/MY/FRZ/SFT/HVY)
- Connecting Line
- Solid = good conditions; dashed = bad conditions
- Line Symbol
- ▲ Triangle = sprint (7f or less); ● Circle = route (more than 7f)
- Days Between Races
- Small number above each bubble (e.g. 19d) = days since the previous race — helps spot freshness, layoffs, and tight scheduling.
- Shaded Band (Bollinger)
- Highlights volatility — a wider band means more variation in recent performance
- Performance Trend
- Straight line showing the overall performance direction — angled up = improving, angled down = declining
- Dashed Reference Line
- AI Opponent = AI analysis class-level par for the race
AI Model History Guide
- Lines
- Each solid line shows this horse’s model score over its last 10 races: blue = Mod1, green = Mod2, amber = Mod3.
- Dashed Lines
- Dashed lines represent the current race’s field average for each model — a score below the dashed line indicates the horse ranked below average in this model’s assessment.
- Higher is Stronger
- All three model scores are 0–100: a higher number means the model rates this horse more favorably among the field.
Mod1(W): 82 (1/8) Mod2(W): 75 (2/8) Mod3(W): 79 (3/8) Mod1-LS: 55 (6/8) Win Prob: 18.4% Value Score: 1.35 ★
Performance vs. Peers Guide
- Bars (per post)
- Blue = avg career performance • Amber = avg last 3 races • Green = last race (improved vs. avg) • Red = last race (declined vs. avg)
- Trend Line
- Angled line above the bars: rising = improving form • falling = declining form.
- Horizontal Line
- Field average — the mean career performance of all horses in this race.
- Color Circles
- Standard post-position colors below each lane — same as the Total Pace chart.
- Border
- Thicker border = this horse’s post position.
Figure Comparison
- Rating
- The three Pick Pony algorithm ratings (Algo 1, Algo 2, Algo 3) that make up the overall PP AI Rating — higher is a stronger contender rating.
- Speed
- Career average speed, recent 3-race average, and last-race speed figure — spot horses in improving or declining form.
- Pace
- Average Early (E1), Mid (E2), and Stretch (LP) pace figures — reveals pace-setters vs. closers vs. all-the-way types.
- This horse
- The horse whose stats card is open is highlighted with a darker column background.
Winning Profiles
- Axes
- X: Win % from last 10 starts — Y: In-the-money % (top-3 finishes) from last 10 starts.
- Quadrants
- Consistent Winners (top-right): high win & ITM — reliable performers.
Place Threats (top-left): boards often but doesn’t win often — good exacta/trifecta angles.
Streaky (bottom-right): wins occasionally, misses the board often — all-or-nothing.
Developing (bottom-left): still finding form — longshot territory. - Reference Lines
- Dashed lines mark field averages. Dots to the right win more; dots higher board more.
- This horse
- Highlighted with a gold border and larger dot.
AI Model Comparison
- Winner Models (green)
- Mod1(W), Mod2(W), and Mod3(W) trained to predict race winners. Higher score = stronger contender.
- Longshot Models (red)
- Mod1-LS, Mod2-LS, and Mod3-LS trained to find high-value longshots. Higher score = stronger longshot candidate.
- Form Model (blue)
- Mod4 sequence model trained on recent form patterns. Higher score = stronger recent form profile.
- This horse
- Highlighted with a darker column background.
Race Pace Simulation Guide
- Slider
- Drag left→right to advance from gate to finish. Drag all the way back to reset the race.
- Predicted Finish Order
- Factors in contested pace burn, each horse’s effort curve (peaked-early vs. peaked-late), and wide trip cost from outside posts. Updated live when Track Bias changes.
- Pace Scenario
- Lone Speed: single E horse likely rates and holds. Contested: two E horses burn each other — closers benefit. Hot Pace: speed meltdown, deep closers thrive. Soft: no early speed, moderate fractions throughout.
- Track Bias
- Slider below canvas. −2 = strong closer/wet bias; +2 = strong speed/rail bias. Recomputes the predicted finish order.
- Boxed Indicator
- Dashed orange ring = horse is surrounded (rival ahead, rival behind, wall outside). In a real race this horse must find a clear path to run.
- Running Styles
- E/EE = early speed (rushes to rail). P = presser (stalks the pace). S = stalker. SS = slow starter / closer.
| Stat | vs. Current Card | vs. All Horses |
|---|---|---|
| Averages
Career-average metrics across all AI race analysis. Performance and pace averages reflect estimated historical performance; trainer and jockey grades score in-the-money percentages. Grading scale: A = elite • B = above average • C = average • D = below average • F = poor • — = no data |
||
| Pick Pony AI Rating | A | B |
| Pace Trip Longshot | — | — |
| Connections Longshot | — | — |
| Situational Longshot | — | — |
| Speed | B | B |
| Early Pace | A | A |
| Mid Pace | A | A |
| Late Pace | F | D |
| Finish Pos | F | F |
| Dirt Speed | C | B |
| Turf Speed | B | A |
| Distance Speed | A | A |
| Trainer Effectiveness | C | C |
| Jockey Effectiveness | C | B |
| 3rd Party Ratings | B | A |
| Recent
Performance analysis from the horse's recent races, weighted to reflect current form. Sprint and Route FPS (Foot Per Second) measure pace efficiency over the horse's recent sprints and routes respectively. Grading scale: A = elite • B = above average • C = average • D = below average • F = poor • — = no data |
||
| Speed | B | B |
| Early Pace | A | A |
| Mid Pace | A | A |
| Late Pace | F | D |
| Sprint FPS | A | A |
| Route FPS | A | A |
| Trainer Effectiveness | C | C |
| Jockey Effectiveness | C | B |
| 3rd Party Ratings | B | A |
| Predictions
AI-generated projections for the upcoming race, derived from prior AI analysis for speed and pace trends, surface and distance suitability, and current conditions. Grading scale: A = elite • B = above average • C = average • D = below average • F = poor • — = no data |
||
| Speed | B | B |
| Early Pace | A | B |
| Mid Pace | A | A |
| Late Pace | C | C |
Chart Guide (2.0.36)
- Bubbles
- Color = surface: green (turf), brown (dirt), blue (synthetic)
- Top number = finishing position; bottom number in parentheses = starting post position
- Height above line = beaten lengths — closer means a smaller margin
- Border = track conditions: green (FST/GD/FM), yellow (WF/SL/YLD), red (SY/MY/FRZ/SFT/HVY)
- Connecting Line
- Solid = good conditions; dashed = bad conditions
- Line Symbol
- ▲ Triangle = sprint (7f or less); ● Circle = route (more than 7f)
- Days Between Races
- Small number above each bubble (e.g. 19d) = days since the previous race — helps spot freshness, layoffs, and tight scheduling.
- Shaded Band (Bollinger)
- Highlights volatility — a wider band means more variation in recent performance
- Performance Trend
- Straight line showing the overall performance direction — angled up = improving, angled down = declining
- Dashed Reference Line
- AI Opponent = AI analysis class-level par for the race
AI Model History Guide
- Lines
- Each solid line shows this horse’s model score over its last 10 races: blue = Mod1, green = Mod2, amber = Mod3.
- Dashed Lines
- Dashed lines represent the current race’s field average for each model — a score below the dashed line indicates the horse ranked below average in this model’s assessment.
- Higher is Stronger
- All three model scores are 0–100: a higher number means the model rates this horse more favorably among the field.
Mod1(W): 82 (1/8) Mod2(W): 75 (2/8) Mod3(W): 79 (3/8) Mod1-LS: 55 (6/8) Win Prob: 18.4% Value Score: 1.35 ★
Performance vs. Peers Guide
- Bars (per post)
- Blue = avg career performance • Amber = avg last 3 races • Green = last race (improved vs. avg) • Red = last race (declined vs. avg)
- Trend Line
- Angled line above the bars: rising = improving form • falling = declining form.
- Horizontal Line
- Field average — the mean career performance of all horses in this race.
- Color Circles
- Standard post-position colors below each lane — same as the Total Pace chart.
- Border
- Thicker border = this horse’s post position.
Figure Comparison
- Rating
- The three Pick Pony algorithm ratings (Algo 1, Algo 2, Algo 3) that make up the overall PP AI Rating — higher is a stronger contender rating.
- Speed
- Career average speed, recent 3-race average, and last-race speed figure — spot horses in improving or declining form.
- Pace
- Average Early (E1), Mid (E2), and Stretch (LP) pace figures — reveals pace-setters vs. closers vs. all-the-way types.
- This horse
- The horse whose stats card is open is highlighted with a darker column background.
Winning Profiles
- Axes
- X: Win % from last 10 starts — Y: In-the-money % (top-3 finishes) from last 10 starts.
- Quadrants
- Consistent Winners (top-right): high win & ITM — reliable performers.
Place Threats (top-left): boards often but doesn’t win often — good exacta/trifecta angles.
Streaky (bottom-right): wins occasionally, misses the board often — all-or-nothing.
Developing (bottom-left): still finding form — longshot territory. - Reference Lines
- Dashed lines mark field averages. Dots to the right win more; dots higher board more.
- This horse
- Highlighted with a gold border and larger dot.
AI Model Comparison
- Winner Models (green)
- Mod1(W), Mod2(W), and Mod3(W) trained to predict race winners. Higher score = stronger contender.
- Longshot Models (red)
- Mod1-LS, Mod2-LS, and Mod3-LS trained to find high-value longshots. Higher score = stronger longshot candidate.
- Form Model (blue)
- Mod4 sequence model trained on recent form patterns. Higher score = stronger recent form profile.
- This horse
- Highlighted with a darker column background.
Race Pace Simulation Guide
- Slider
- Drag left→right to advance from gate to finish. Drag all the way back to reset the race.
- Predicted Finish Order
- Factors in contested pace burn, each horse’s effort curve (peaked-early vs. peaked-late), and wide trip cost from outside posts. Updated live when Track Bias changes.
- Pace Scenario
- Lone Speed: single E horse likely rates and holds. Contested: two E horses burn each other — closers benefit. Hot Pace: speed meltdown, deep closers thrive. Soft: no early speed, moderate fractions throughout.
- Track Bias
- Slider below canvas. −2 = strong closer/wet bias; +2 = strong speed/rail bias. Recomputes the predicted finish order.
- Boxed Indicator
- Dashed orange ring = horse is surrounded (rival ahead, rival behind, wall outside). In a real race this horse must find a clear path to run.
- Running Styles
- E/EE = early speed (rushes to rail). P = presser (stalks the pace). S = stalker. SS = slow starter / closer.
| Stat | vs. Current Card | vs. All Horses |
|---|---|---|
| Averages
Career-average metrics across all AI race analysis. Performance and pace averages reflect estimated historical performance; trainer and jockey grades score in-the-money percentages. Grading scale: A = elite • B = above average • C = average • D = below average • F = poor • — = no data |
||
| Pick Pony AI Rating | A | B |
| Pace Trip Longshot | — | — |
| Connections Longshot | — | — |
| Situational Longshot | — | — |
| Speed | F | C |
| Early Pace | A | B |
| Mid Pace | F | C |
| Late Pace | B | B |
| Finish Pos | C | C |
| Dirt Speed | D | B |
| Turf Speed | A | A |
| Distance Speed | A | A |
| Trainer Effectiveness | A | B |
| Jockey Effectiveness | A | A |
| 3rd Party Ratings | A | A |
| Recent
Performance analysis from the horse's recent races, weighted to reflect current form. Sprint and Route FPS (Foot Per Second) measure pace efficiency over the horse's recent sprints and routes respectively. Grading scale: A = elite • B = above average • C = average • D = below average • F = poor • — = no data |
||
| Speed | A | B |
| Early Pace | B | C |
| Mid Pace | C | C |
| Late Pace | B | A |
| Sprint FPS | A | B |
| Route FPS | B | B |
| Trainer Effectiveness | A | B |
| Jockey Effectiveness | A | A |
| 3rd Party Ratings | A | A |
| Predictions
AI-generated projections for the upcoming race, derived from prior AI analysis for speed and pace trends, surface and distance suitability, and current conditions. Grading scale: A = elite • B = above average • C = average • D = below average • F = poor • — = no data |
||
| Speed | F | D |
| Early Pace | A | B |
| Mid Pace | D | C |
| Late Pace | C | C |
Chart Guide (2.0.36)
- Bubbles
- Color = surface: green (turf), brown (dirt), blue (synthetic)
- Top number = finishing position; bottom number in parentheses = starting post position
- Height above line = beaten lengths — closer means a smaller margin
- Border = track conditions: green (FST/GD/FM), yellow (WF/SL/YLD), red (SY/MY/FRZ/SFT/HVY)
- Connecting Line
- Solid = good conditions; dashed = bad conditions
- Line Symbol
- ▲ Triangle = sprint (7f or less); ● Circle = route (more than 7f)
- Days Between Races
- Small number above each bubble (e.g. 19d) = days since the previous race — helps spot freshness, layoffs, and tight scheduling.
- Shaded Band (Bollinger)
- Highlights volatility — a wider band means more variation in recent performance
- Performance Trend
- Straight line showing the overall performance direction — angled up = improving, angled down = declining
- Dashed Reference Line
- AI Opponent = AI analysis class-level par for the race
AI Model History Guide
- Lines
- Each solid line shows this horse’s model score over its last 10 races: blue = Mod1, green = Mod2, amber = Mod3.
- Dashed Lines
- Dashed lines represent the current race’s field average for each model — a score below the dashed line indicates the horse ranked below average in this model’s assessment.
- Higher is Stronger
- All three model scores are 0–100: a higher number means the model rates this horse more favorably among the field.
Mod1(W): 82 (1/8) Mod2(W): 75 (2/8) Mod3(W): 79 (3/8) Mod1-LS: 55 (6/8) Win Prob: 18.4% Value Score: 1.35 ★
Performance vs. Peers Guide
- Bars (per post)
- Blue = avg career performance • Amber = avg last 3 races • Green = last race (improved vs. avg) • Red = last race (declined vs. avg)
- Trend Line
- Angled line above the bars: rising = improving form • falling = declining form.
- Horizontal Line
- Field average — the mean career performance of all horses in this race.
- Color Circles
- Standard post-position colors below each lane — same as the Total Pace chart.
- Border
- Thicker border = this horse’s post position.
Figure Comparison
- Rating
- The three Pick Pony algorithm ratings (Algo 1, Algo 2, Algo 3) that make up the overall PP AI Rating — higher is a stronger contender rating.
- Speed
- Career average speed, recent 3-race average, and last-race speed figure — spot horses in improving or declining form.
- Pace
- Average Early (E1), Mid (E2), and Stretch (LP) pace figures — reveals pace-setters vs. closers vs. all-the-way types.
- This horse
- The horse whose stats card is open is highlighted with a darker column background.
Winning Profiles
- Axes
- X: Win % from last 10 starts — Y: In-the-money % (top-3 finishes) from last 10 starts.
- Quadrants
- Consistent Winners (top-right): high win & ITM — reliable performers.
Place Threats (top-left): boards often but doesn’t win often — good exacta/trifecta angles.
Streaky (bottom-right): wins occasionally, misses the board often — all-or-nothing.
Developing (bottom-left): still finding form — longshot territory. - Reference Lines
- Dashed lines mark field averages. Dots to the right win more; dots higher board more.
- This horse
- Highlighted with a gold border and larger dot.
AI Model Comparison
- Winner Models (green)
- Mod1(W), Mod2(W), and Mod3(W) trained to predict race winners. Higher score = stronger contender.
- Longshot Models (red)
- Mod1-LS, Mod2-LS, and Mod3-LS trained to find high-value longshots. Higher score = stronger longshot candidate.
- Form Model (blue)
- Mod4 sequence model trained on recent form patterns. Higher score = stronger recent form profile.
- This horse
- Highlighted with a darker column background.
Race Pace Simulation Guide
- Slider
- Drag left→right to advance from gate to finish. Drag all the way back to reset the race.
- Predicted Finish Order
- Factors in contested pace burn, each horse’s effort curve (peaked-early vs. peaked-late), and wide trip cost from outside posts. Updated live when Track Bias changes.
- Pace Scenario
- Lone Speed: single E horse likely rates and holds. Contested: two E horses burn each other — closers benefit. Hot Pace: speed meltdown, deep closers thrive. Soft: no early speed, moderate fractions throughout.
- Track Bias
- Slider below canvas. −2 = strong closer/wet bias; +2 = strong speed/rail bias. Recomputes the predicted finish order.
- Boxed Indicator
- Dashed orange ring = horse is surrounded (rival ahead, rival behind, wall outside). In a real race this horse must find a clear path to run.
- Running Styles
- E/EE = early speed (rushes to rail). P = presser (stalks the pace). S = stalker. SS = slow starter / closer.
| Stat | vs. Current Card | vs. All Horses |
|---|---|---|
| Averages
Career-average metrics across all AI race analysis. Performance and pace averages reflect estimated historical performance; trainer and jockey grades score in-the-money percentages. Grading scale: A = elite • B = above average • C = average • D = below average • F = poor • — = no data |
||
| Pick Pony AI Rating | B | B |
| Pace Trip Longshot | — | — |
| Connections Longshot | — | — |
| Situational Longshot | — | — |
| Speed | C | B |
| Early Pace | F | D |
| Mid Pace | F | D |
| Late Pace | A | A |
| Finish Pos | A | C |
| Dirt Speed | D | B |
| Turf Speed | D | A |
| Distance Speed | C | A |
| Trainer Effectiveness | C | C |
| Jockey Effectiveness | F | F |
| 3rd Party Ratings | A | A |
| Recent
Performance analysis from the horse's recent races, weighted to reflect current form. Sprint and Route FPS (Foot Per Second) measure pace efficiency over the horse's recent sprints and routes respectively. Grading scale: A = elite • B = above average • C = average • D = below average • F = poor • — = no data |
||
| Speed | D | B |
| Early Pace | F | F |
| Mid Pace | F | D |
| Late Pace | A | A |
| Sprint FPS | F | D |
| Route FPS | F | D |
| Trainer Effectiveness | C | C |
| Jockey Effectiveness | F | F |
| 3rd Party Ratings | A | A |
| Predictions
AI-generated projections for the upcoming race, derived from prior AI analysis for speed and pace trends, surface and distance suitability, and current conditions. Grading scale: A = elite • B = above average • C = average • D = below average • F = poor • — = no data |
||
| Speed | C | B |
| Early Pace | F | D |
| Mid Pace | F | D |
| Late Pace | C | C |
Chart Guide (2.0.36)
- Bubbles
- Color = surface: green (turf), brown (dirt), blue (synthetic)
- Top number = finishing position; bottom number in parentheses = starting post position
- Height above line = beaten lengths — closer means a smaller margin
- Border = track conditions: green (FST/GD/FM), yellow (WF/SL/YLD), red (SY/MY/FRZ/SFT/HVY)
- Connecting Line
- Solid = good conditions; dashed = bad conditions
- Line Symbol
- ▲ Triangle = sprint (7f or less); ● Circle = route (more than 7f)
- Days Between Races
- Small number above each bubble (e.g. 19d) = days since the previous race — helps spot freshness, layoffs, and tight scheduling.
- Shaded Band (Bollinger)
- Highlights volatility — a wider band means more variation in recent performance
- Performance Trend
- Straight line showing the overall performance direction — angled up = improving, angled down = declining
- Dashed Reference Line
- AI Opponent = AI analysis class-level par for the race
AI Model History Guide
- Lines
- Each solid line shows this horse’s model score over its last 10 races: blue = Mod1, green = Mod2, amber = Mod3.
- Dashed Lines
- Dashed lines represent the current race’s field average for each model — a score below the dashed line indicates the horse ranked below average in this model’s assessment.
- Higher is Stronger
- All three model scores are 0–100: a higher number means the model rates this horse more favorably among the field.
Mod1(W): 82 (1/8) Mod2(W): 75 (2/8) Mod3(W): 79 (3/8) Mod1-LS: 55 (6/8) Win Prob: 18.4% Value Score: 1.35 ★
Performance vs. Peers Guide
- Bars (per post)
- Blue = avg career performance • Amber = avg last 3 races • Green = last race (improved vs. avg) • Red = last race (declined vs. avg)
- Trend Line
- Angled line above the bars: rising = improving form • falling = declining form.
- Horizontal Line
- Field average — the mean career performance of all horses in this race.
- Color Circles
- Standard post-position colors below each lane — same as the Total Pace chart.
- Border
- Thicker border = this horse’s post position.
Figure Comparison
- Rating
- The three Pick Pony algorithm ratings (Algo 1, Algo 2, Algo 3) that make up the overall PP AI Rating — higher is a stronger contender rating.
- Speed
- Career average speed, recent 3-race average, and last-race speed figure — spot horses in improving or declining form.
- Pace
- Average Early (E1), Mid (E2), and Stretch (LP) pace figures — reveals pace-setters vs. closers vs. all-the-way types.
- This horse
- The horse whose stats card is open is highlighted with a darker column background.
Winning Profiles
- Axes
- X: Win % from last 10 starts — Y: In-the-money % (top-3 finishes) from last 10 starts.
- Quadrants
- Consistent Winners (top-right): high win & ITM — reliable performers.
Place Threats (top-left): boards often but doesn’t win often — good exacta/trifecta angles.
Streaky (bottom-right): wins occasionally, misses the board often — all-or-nothing.
Developing (bottom-left): still finding form — longshot territory. - Reference Lines
- Dashed lines mark field averages. Dots to the right win more; dots higher board more.
- This horse
- Highlighted with a gold border and larger dot.
AI Model Comparison
- Winner Models (green)
- Mod1(W), Mod2(W), and Mod3(W) trained to predict race winners. Higher score = stronger contender.
- Longshot Models (red)
- Mod1-LS, Mod2-LS, and Mod3-LS trained to find high-value longshots. Higher score = stronger longshot candidate.
- Form Model (blue)
- Mod4 sequence model trained on recent form patterns. Higher score = stronger recent form profile.
- This horse
- Highlighted with a darker column background.
Race Pace Simulation Guide
- Slider
- Drag left→right to advance from gate to finish. Drag all the way back to reset the race.
- Predicted Finish Order
- Factors in contested pace burn, each horse’s effort curve (peaked-early vs. peaked-late), and wide trip cost from outside posts. Updated live when Track Bias changes.
- Pace Scenario
- Lone Speed: single E horse likely rates and holds. Contested: two E horses burn each other — closers benefit. Hot Pace: speed meltdown, deep closers thrive. Soft: no early speed, moderate fractions throughout.
- Track Bias
- Slider below canvas. −2 = strong closer/wet bias; +2 = strong speed/rail bias. Recomputes the predicted finish order.
- Boxed Indicator
- Dashed orange ring = horse is surrounded (rival ahead, rival behind, wall outside). In a real race this horse must find a clear path to run.
- Running Styles
- E/EE = early speed (rushes to rail). P = presser (stalks the pace). S = stalker. SS = slow starter / closer.
| Stat | vs. Current Card | vs. All Horses |
|---|---|---|
| Averages
Career-average metrics across all AI race analysis. Performance and pace averages reflect estimated historical performance; trainer and jockey grades score in-the-money percentages. Grading scale: A = elite • B = above average • C = average • D = below average • F = poor • — = no data |
||
| Pick Pony AI Rating | B | B |
| Pace Trip Longshot | — | — |
| Connections Longshot | — | — |
| Situational Longshot | — | — |
| Speed | C | B |
| Early Pace | D | C |
| Mid Pace | C | B |
| Late Pace | C | B |
| Finish Pos | C | C |
| Dirt Speed | F | D |
| Turf Speed | D | A |
| Distance Speed | C | A |
| Trainer Effectiveness | C | C |
| Jockey Effectiveness | A | A |
| 3rd Party Ratings | A | A |
| Recent
Performance analysis from the horse's recent races, weighted to reflect current form. Sprint and Route FPS (Foot Per Second) measure pace efficiency over the horse's recent sprints and routes respectively. Grading scale: A = elite • B = above average • C = average • D = below average • F = poor • — = no data |
||
| Speed | D | B |
| Early Pace | F | D |
| Mid Pace | F | D |
| Late Pace | A | A |
| Sprint FPS | C | C |
| Route FPS | A | B |
| Trainer Effectiveness | C | C |
| Jockey Effectiveness | A | A |
| 3rd Party Ratings | A | A |
| Predictions
AI-generated projections for the upcoming race, derived from prior AI analysis for speed and pace trends, surface and distance suitability, and current conditions. Grading scale: A = elite • B = above average • C = average • D = below average • F = poor • — = no data |
||
| Speed | C | B |
| Early Pace | D | D |
| Mid Pace | D | C |
| Late Pace | C | C |
Chart Guide (2.0.36)
- Bubbles
- Color = surface: green (turf), brown (dirt), blue (synthetic)
- Top number = finishing position; bottom number in parentheses = starting post position
- Height above line = beaten lengths — closer means a smaller margin
- Border = track conditions: green (FST/GD/FM), yellow (WF/SL/YLD), red (SY/MY/FRZ/SFT/HVY)
- Connecting Line
- Solid = good conditions; dashed = bad conditions
- Line Symbol
- ▲ Triangle = sprint (7f or less); ● Circle = route (more than 7f)
- Days Between Races
- Small number above each bubble (e.g. 19d) = days since the previous race — helps spot freshness, layoffs, and tight scheduling.
- Shaded Band (Bollinger)
- Highlights volatility — a wider band means more variation in recent performance
- Performance Trend
- Straight line showing the overall performance direction — angled up = improving, angled down = declining
- Dashed Reference Line
- AI Opponent = AI analysis class-level par for the race
AI Model History Guide
- Lines
- Each solid line shows this horse’s model score over its last 10 races: blue = Mod1, green = Mod2, amber = Mod3.
- Dashed Lines
- Dashed lines represent the current race’s field average for each model — a score below the dashed line indicates the horse ranked below average in this model’s assessment.
- Higher is Stronger
- All three model scores are 0–100: a higher number means the model rates this horse more favorably among the field.
Mod1(W): 82 (1/8) Mod2(W): 75 (2/8) Mod3(W): 79 (3/8) Mod1-LS: 55 (6/8) Win Prob: 18.4% Value Score: 1.35 ★
Performance vs. Peers Guide
- Bars (per post)
- Blue = avg career performance • Amber = avg last 3 races • Green = last race (improved vs. avg) • Red = last race (declined vs. avg)
- Trend Line
- Angled line above the bars: rising = improving form • falling = declining form.
- Horizontal Line
- Field average — the mean career performance of all horses in this race.
- Color Circles
- Standard post-position colors below each lane — same as the Total Pace chart.
- Border
- Thicker border = this horse’s post position.
Figure Comparison
- Rating
- The three Pick Pony algorithm ratings (Algo 1, Algo 2, Algo 3) that make up the overall PP AI Rating — higher is a stronger contender rating.
- Speed
- Career average speed, recent 3-race average, and last-race speed figure — spot horses in improving or declining form.
- Pace
- Average Early (E1), Mid (E2), and Stretch (LP) pace figures — reveals pace-setters vs. closers vs. all-the-way types.
- This horse
- The horse whose stats card is open is highlighted with a darker column background.
Winning Profiles
- Axes
- X: Win % from last 10 starts — Y: In-the-money % (top-3 finishes) from last 10 starts.
- Quadrants
- Consistent Winners (top-right): high win & ITM — reliable performers.
Place Threats (top-left): boards often but doesn’t win often — good exacta/trifecta angles.
Streaky (bottom-right): wins occasionally, misses the board often — all-or-nothing.
Developing (bottom-left): still finding form — longshot territory. - Reference Lines
- Dashed lines mark field averages. Dots to the right win more; dots higher board more.
- This horse
- Highlighted with a gold border and larger dot.
AI Model Comparison
- Winner Models (green)
- Mod1(W), Mod2(W), and Mod3(W) trained to predict race winners. Higher score = stronger contender.
- Longshot Models (red)
- Mod1-LS, Mod2-LS, and Mod3-LS trained to find high-value longshots. Higher score = stronger longshot candidate.
- Form Model (blue)
- Mod4 sequence model trained on recent form patterns. Higher score = stronger recent form profile.
- This horse
- Highlighted with a darker column background.
Race Pace Simulation Guide
- Slider
- Drag left→right to advance from gate to finish. Drag all the way back to reset the race.
- Predicted Finish Order
- Factors in contested pace burn, each horse’s effort curve (peaked-early vs. peaked-late), and wide trip cost from outside posts. Updated live when Track Bias changes.
- Pace Scenario
- Lone Speed: single E horse likely rates and holds. Contested: two E horses burn each other — closers benefit. Hot Pace: speed meltdown, deep closers thrive. Soft: no early speed, moderate fractions throughout.
- Track Bias
- Slider below canvas. −2 = strong closer/wet bias; +2 = strong speed/rail bias. Recomputes the predicted finish order.
- Boxed Indicator
- Dashed orange ring = horse is surrounded (rival ahead, rival behind, wall outside). In a real race this horse must find a clear path to run.
- Running Styles
- E/EE = early speed (rushes to rail). P = presser (stalks the pace). S = stalker. SS = slow starter / closer.
| Stat | vs. Current Card | vs. All Horses |
|---|---|---|
| Averages
Career-average metrics across all AI race analysis. Performance and pace averages reflect estimated historical performance; trainer and jockey grades score in-the-money percentages. Grading scale: A = elite • B = above average • C = average • D = below average • F = poor • — = no data |
||
| Pick Pony AI Rating | D | C |
| Pace Trip Longshot | — | — |
| Connections Longshot | — | — |
| Situational Longshot | — | — |
| Speed | F | C |
| Early Pace | C | C |
| Mid Pace | D | C |
| Late Pace | D | C |
| Finish Pos | A | B |
| Dirt Speed | C | B |
| Turf Speed | C | A |
| Distance Speed | B | A |
| Trainer Effectiveness | A | C |
| Jockey Effectiveness | B | B |
| 3rd Party Ratings | C | A |
| Recent
Performance analysis from the horse's recent races, weighted to reflect current form. Sprint and Route FPS (Foot Per Second) measure pace efficiency over the horse's recent sprints and routes respectively. Grading scale: A = elite • B = above average • C = average • D = below average • F = poor • — = no data |
||
| Speed | C | B |
| Early Pace | B | C |
| Mid Pace | B | B |
| Late Pace | C | B |
| Sprint FPS | C | C |
| Route FPS | C | C |
| Trainer Effectiveness | A | C |
| Jockey Effectiveness | B | B |
| 3rd Party Ratings | C | A |
| Predictions
AI-generated projections for the upcoming race, derived from prior AI analysis for speed and pace trends, surface and distance suitability, and current conditions. Grading scale: A = elite • B = above average • C = average • D = below average • F = poor • — = no data |
||
| Speed | F | C |
| Early Pace | B | C |
| Mid Pace | C | B |
| Late Pace | C | C |
Chart Guide (2.0.36)
- Bubbles
- Color = surface: green (turf), brown (dirt), blue (synthetic)
- Top number = finishing position; bottom number in parentheses = starting post position
- Height above line = beaten lengths — closer means a smaller margin
- Border = track conditions: green (FST/GD/FM), yellow (WF/SL/YLD), red (SY/MY/FRZ/SFT/HVY)
- Connecting Line
- Solid = good conditions; dashed = bad conditions
- Line Symbol
- ▲ Triangle = sprint (7f or less); ● Circle = route (more than 7f)
- Days Between Races
- Small number above each bubble (e.g. 19d) = days since the previous race — helps spot freshness, layoffs, and tight scheduling.
- Shaded Band (Bollinger)
- Highlights volatility — a wider band means more variation in recent performance
- Performance Trend
- Straight line showing the overall performance direction — angled up = improving, angled down = declining
- Dashed Reference Line
- AI Opponent = AI analysis class-level par for the race
AI Model History Guide
- Lines
- Each solid line shows this horse’s model score over its last 10 races: blue = Mod1, green = Mod2, amber = Mod3.
- Dashed Lines
- Dashed lines represent the current race’s field average for each model — a score below the dashed line indicates the horse ranked below average in this model’s assessment.
- Higher is Stronger
- All three model scores are 0–100: a higher number means the model rates this horse more favorably among the field.
Mod1(W): 82 (1/8) Mod2(W): 75 (2/8) Mod3(W): 79 (3/8) Mod1-LS: 55 (6/8) Win Prob: 18.4% Value Score: 1.35 ★
Performance vs. Peers Guide
- Bars (per post)
- Blue = avg career performance • Amber = avg last 3 races • Green = last race (improved vs. avg) • Red = last race (declined vs. avg)
- Trend Line
- Angled line above the bars: rising = improving form • falling = declining form.
- Horizontal Line
- Field average — the mean career performance of all horses in this race.
- Color Circles
- Standard post-position colors below each lane — same as the Total Pace chart.
- Border
- Thicker border = this horse’s post position.
Figure Comparison
- Rating
- The three Pick Pony algorithm ratings (Algo 1, Algo 2, Algo 3) that make up the overall PP AI Rating — higher is a stronger contender rating.
- Speed
- Career average speed, recent 3-race average, and last-race speed figure — spot horses in improving or declining form.
- Pace
- Average Early (E1), Mid (E2), and Stretch (LP) pace figures — reveals pace-setters vs. closers vs. all-the-way types.
- This horse
- The horse whose stats card is open is highlighted with a darker column background.
Winning Profiles
- Axes
- X: Win % from last 10 starts — Y: In-the-money % (top-3 finishes) from last 10 starts.
- Quadrants
- Consistent Winners (top-right): high win & ITM — reliable performers.
Place Threats (top-left): boards often but doesn’t win often — good exacta/trifecta angles.
Streaky (bottom-right): wins occasionally, misses the board often — all-or-nothing.
Developing (bottom-left): still finding form — longshot territory. - Reference Lines
- Dashed lines mark field averages. Dots to the right win more; dots higher board more.
- This horse
- Highlighted with a gold border and larger dot.
AI Model Comparison
- Winner Models (green)
- Mod1(W), Mod2(W), and Mod3(W) trained to predict race winners. Higher score = stronger contender.
- Longshot Models (red)
- Mod1-LS, Mod2-LS, and Mod3-LS trained to find high-value longshots. Higher score = stronger longshot candidate.
- Form Model (blue)
- Mod4 sequence model trained on recent form patterns. Higher score = stronger recent form profile.
- This horse
- Highlighted with a darker column background.
Race Pace Simulation Guide
- Slider
- Drag left→right to advance from gate to finish. Drag all the way back to reset the race.
- Predicted Finish Order
- Factors in contested pace burn, each horse’s effort curve (peaked-early vs. peaked-late), and wide trip cost from outside posts. Updated live when Track Bias changes.
- Pace Scenario
- Lone Speed: single E horse likely rates and holds. Contested: two E horses burn each other — closers benefit. Hot Pace: speed meltdown, deep closers thrive. Soft: no early speed, moderate fractions throughout.
- Track Bias
- Slider below canvas. −2 = strong closer/wet bias; +2 = strong speed/rail bias. Recomputes the predicted finish order.
- Boxed Indicator
- Dashed orange ring = horse is surrounded (rival ahead, rival behind, wall outside). In a real race this horse must find a clear path to run.
- Running Styles
- E/EE = early speed (rushes to rail). P = presser (stalks the pace). S = stalker. SS = slow starter / closer.
| Stat | vs. Current Card | vs. All Horses |
|---|---|---|
| Averages
Career-average metrics across all AI race analysis. Performance and pace averages reflect estimated historical performance; trainer and jockey grades score in-the-money percentages. Grading scale: A = elite • B = above average • C = average • D = below average • F = poor • — = no data |
||
| Pick Pony AI Rating | C | C |
| Pace Trip Longshot | — | — |
| Connections Longshot | — | — |
| Situational Longshot | — | — |
| Speed | A | A |
| Early Pace | D | D |
| Mid Pace | D | C |
| Late Pace | A | A |
| Finish Pos | C | D |
| Dirt Speed | A | A |
| Turf Speed | F | B |
| Distance Speed | F | B |
| Trainer Effectiveness | F | D |
| Jockey Effectiveness | D | C |
| 3rd Party Ratings | D | B |
| Recent
Performance analysis from the horse's recent races, weighted to reflect current form. Sprint and Route FPS (Foot Per Second) measure pace efficiency over the horse's recent sprints and routes respectively. Grading scale: A = elite • B = above average • C = average • D = below average • F = poor • — = no data |
||
| Speed | A | A |
| Early Pace | C | C |
| Mid Pace | C | C |
| Late Pace | B | A |
| Sprint FPS | B | C |
| Route FPS | B | B |
| Trainer Effectiveness | F | D |
| Jockey Effectiveness | D | C |
| 3rd Party Ratings | D | B |
| Predictions
AI-generated projections for the upcoming race, derived from prior AI analysis for speed and pace trends, surface and distance suitability, and current conditions. Grading scale: A = elite • B = above average • C = average • D = below average • F = poor • — = no data |
||
| Speed | A | A |
| Early Pace | F | D |
| Mid Pace | F | C |
| Late Pace | C | C |
Chart Guide (2.0.36)
- Bubbles
- Color = surface: green (turf), brown (dirt), blue (synthetic)
- Top number = finishing position; bottom number in parentheses = starting post position
- Height above line = beaten lengths — closer means a smaller margin
- Border = track conditions: green (FST/GD/FM), yellow (WF/SL/YLD), red (SY/MY/FRZ/SFT/HVY)
- Connecting Line
- Solid = good conditions; dashed = bad conditions
- Line Symbol
- ▲ Triangle = sprint (7f or less); ● Circle = route (more than 7f)
- Days Between Races
- Small number above each bubble (e.g. 19d) = days since the previous race — helps spot freshness, layoffs, and tight scheduling.
- Shaded Band (Bollinger)
- Highlights volatility — a wider band means more variation in recent performance
- Performance Trend
- Straight line showing the overall performance direction — angled up = improving, angled down = declining
- Dashed Reference Line
- AI Opponent = AI analysis class-level par for the race
AI Model History Guide
- Lines
- Each solid line shows this horse’s model score over its last 10 races: blue = Mod1, green = Mod2, amber = Mod3.
- Dashed Lines
- Dashed lines represent the current race’s field average for each model — a score below the dashed line indicates the horse ranked below average in this model’s assessment.
- Higher is Stronger
- All three model scores are 0–100: a higher number means the model rates this horse more favorably among the field.
Mod1(W): 82 (1/8) Mod2(W): 75 (2/8) Mod3(W): 79 (3/8) Mod1-LS: 55 (6/8) Win Prob: 18.4% Value Score: 1.35 ★
Performance vs. Peers Guide
- Bars (per post)
- Blue = avg career performance • Amber = avg last 3 races • Green = last race (improved vs. avg) • Red = last race (declined vs. avg)
- Trend Line
- Angled line above the bars: rising = improving form • falling = declining form.
- Horizontal Line
- Field average — the mean career performance of all horses in this race.
- Color Circles
- Standard post-position colors below each lane — same as the Total Pace chart.
- Border
- Thicker border = this horse’s post position.
Figure Comparison
- Rating
- The three Pick Pony algorithm ratings (Algo 1, Algo 2, Algo 3) that make up the overall PP AI Rating — higher is a stronger contender rating.
- Speed
- Career average speed, recent 3-race average, and last-race speed figure — spot horses in improving or declining form.
- Pace
- Average Early (E1), Mid (E2), and Stretch (LP) pace figures — reveals pace-setters vs. closers vs. all-the-way types.
- This horse
- The horse whose stats card is open is highlighted with a darker column background.
Winning Profiles
- Axes
- X: Win % from last 10 starts — Y: In-the-money % (top-3 finishes) from last 10 starts.
- Quadrants
- Consistent Winners (top-right): high win & ITM — reliable performers.
Place Threats (top-left): boards often but doesn’t win often — good exacta/trifecta angles.
Streaky (bottom-right): wins occasionally, misses the board often — all-or-nothing.
Developing (bottom-left): still finding form — longshot territory. - Reference Lines
- Dashed lines mark field averages. Dots to the right win more; dots higher board more.
- This horse
- Highlighted with a gold border and larger dot.
AI Model Comparison
- Winner Models (green)
- Mod1(W), Mod2(W), and Mod3(W) trained to predict race winners. Higher score = stronger contender.
- Longshot Models (red)
- Mod1-LS, Mod2-LS, and Mod3-LS trained to find high-value longshots. Higher score = stronger longshot candidate.
- Form Model (blue)
- Mod4 sequence model trained on recent form patterns. Higher score = stronger recent form profile.
- This horse
- Highlighted with a darker column background.
Race Pace Simulation Guide
- Slider
- Drag left→right to advance from gate to finish. Drag all the way back to reset the race.
- Predicted Finish Order
- Factors in contested pace burn, each horse’s effort curve (peaked-early vs. peaked-late), and wide trip cost from outside posts. Updated live when Track Bias changes.
- Pace Scenario
- Lone Speed: single E horse likely rates and holds. Contested: two E horses burn each other — closers benefit. Hot Pace: speed meltdown, deep closers thrive. Soft: no early speed, moderate fractions throughout.
- Track Bias
- Slider below canvas. −2 = strong closer/wet bias; +2 = strong speed/rail bias. Recomputes the predicted finish order.
- Boxed Indicator
- Dashed orange ring = horse is surrounded (rival ahead, rival behind, wall outside). In a real race this horse must find a clear path to run.
- Running Styles
- E/EE = early speed (rushes to rail). P = presser (stalks the pace). S = stalker. SS = slow starter / closer.
| Stat | vs. Current Card | vs. All Horses |
|---|---|---|
| Averages
Career-average metrics across all AI race analysis. Performance and pace averages reflect estimated historical performance; trainer and jockey grades score in-the-money percentages. Grading scale: A = elite • B = above average • C = average • D = below average • F = poor • — = no data |
||
| Pick Pony AI Rating | B | B |
| Pace Trip Longshot | — | — |
| Connections Longshot | — | — |
| Situational Longshot | — | — |
| Speed | A | C |
| Early Pace | B | A |
| Mid Pace | A | A |
| Late Pace | A | C |
| Finish Pos | C | D |
| Dirt Speed | B | A |
| Turf Speed | A | B |
| Distance Speed | A | A |
| Trainer Effectiveness | A | B |
| Jockey Effectiveness | B | B |
| 3rd Party Ratings | A | C |
| Recent
Performance analysis from the horse's recent races, weighted to reflect current form. Sprint and Route FPS (Foot Per Second) measure pace efficiency over the horse's recent sprints and routes respectively. Grading scale: A = elite • B = above average • C = average • D = below average • F = poor • — = no data |
||
| Speed | F | D |
| Early Pace | D | B |
| Mid Pace | C | B |
| Late Pace | C | D |
| Sprint FPS | B | A |
| Route FPS | B | A |
| Trainer Effectiveness | A | B |
| Jockey Effectiveness | B | B |
| 3rd Party Ratings | A | C |
| Predictions
AI-generated projections for the upcoming race, derived from prior AI analysis for speed and pace trends, surface and distance suitability, and current conditions. Grading scale: A = elite • B = above average • C = average • D = below average • F = poor • — = no data |
||
| Speed | A | C |
| Early Pace | B | B |
| Mid Pace | A | A |
| Late Pace | C | C |
Chart Guide (2.0.36)
- Bubbles
- Color = surface: green (turf), brown (dirt), blue (synthetic)
- Top number = finishing position; bottom number in parentheses = starting post position
- Height above line = beaten lengths — closer means a smaller margin
- Border = track conditions: green (FST/GD/FM), yellow (WF/SL/YLD), red (SY/MY/FRZ/SFT/HVY)
- Connecting Line
- Solid = good conditions; dashed = bad conditions
- Line Symbol
- ▲ Triangle = sprint (7f or less); ● Circle = route (more than 7f)
- Days Between Races
- Small number above each bubble (e.g. 19d) = days since the previous race — helps spot freshness, layoffs, and tight scheduling.
- Shaded Band (Bollinger)
- Highlights volatility — a wider band means more variation in recent performance
- Performance Trend
- Straight line showing the overall performance direction — angled up = improving, angled down = declining
- Dashed Reference Line
- AI Opponent = AI analysis class-level par for the race
AI Model History Guide
- Lines
- Each solid line shows this horse’s model score over its last 10 races: blue = Mod1, green = Mod2, amber = Mod3.
- Dashed Lines
- Dashed lines represent the current race’s field average for each model — a score below the dashed line indicates the horse ranked below average in this model’s assessment.
- Higher is Stronger
- All three model scores are 0–100: a higher number means the model rates this horse more favorably among the field.
Mod1(W): 82 (1/8) Mod2(W): 75 (2/8) Mod3(W): 79 (3/8) Mod1-LS: 55 (6/8) Win Prob: 18.4% Value Score: 1.35 ★
Performance vs. Peers Guide
- Bars (per post)
- Blue = avg career performance • Amber = avg last 3 races • Green = last race (improved vs. avg) • Red = last race (declined vs. avg)
- Trend Line
- Angled line above the bars: rising = improving form • falling = declining form.
- Horizontal Line
- Field average — the mean career performance of all horses in this race.
- Color Circles
- Standard post-position colors below each lane — same as the Total Pace chart.
- Border
- Thicker border = this horse’s post position.
Figure Comparison
- Rating
- The three Pick Pony algorithm ratings (Algo 1, Algo 2, Algo 3) that make up the overall PP AI Rating — higher is a stronger contender rating.
- Speed
- Career average speed, recent 3-race average, and last-race speed figure — spot horses in improving or declining form.
- Pace
- Average Early (E1), Mid (E2), and Stretch (LP) pace figures — reveals pace-setters vs. closers vs. all-the-way types.
- This horse
- The horse whose stats card is open is highlighted with a darker column background.
Winning Profiles
- Axes
- X: Win % from last 10 starts — Y: In-the-money % (top-3 finishes) from last 10 starts.
- Quadrants
- Consistent Winners (top-right): high win & ITM — reliable performers.
Place Threats (top-left): boards often but doesn’t win often — good exacta/trifecta angles.
Streaky (bottom-right): wins occasionally, misses the board often — all-or-nothing.
Developing (bottom-left): still finding form — longshot territory. - Reference Lines
- Dashed lines mark field averages. Dots to the right win more; dots higher board more.
- This horse
- Highlighted with a gold border and larger dot.
AI Model Comparison
- Winner Models (green)
- Mod1(W), Mod2(W), and Mod3(W) trained to predict race winners. Higher score = stronger contender.
- Longshot Models (red)
- Mod1-LS, Mod2-LS, and Mod3-LS trained to find high-value longshots. Higher score = stronger longshot candidate.
- Form Model (blue)
- Mod4 sequence model trained on recent form patterns. Higher score = stronger recent form profile.
- This horse
- Highlighted with a darker column background.
Race Pace Simulation Guide
- Slider
- Drag left→right to advance from gate to finish. Drag all the way back to reset the race.
- Predicted Finish Order
- Factors in contested pace burn, each horse’s effort curve (peaked-early vs. peaked-late), and wide trip cost from outside posts. Updated live when Track Bias changes.
- Pace Scenario
- Lone Speed: single E horse likely rates and holds. Contested: two E horses burn each other — closers benefit. Hot Pace: speed meltdown, deep closers thrive. Soft: no early speed, moderate fractions throughout.
- Track Bias
- Slider below canvas. −2 = strong closer/wet bias; +2 = strong speed/rail bias. Recomputes the predicted finish order.
- Boxed Indicator
- Dashed orange ring = horse is surrounded (rival ahead, rival behind, wall outside). In a real race this horse must find a clear path to run.
- Running Styles
- E/EE = early speed (rushes to rail). P = presser (stalks the pace). S = stalker. SS = slow starter / closer.
| Stat | vs. Current Card | vs. All Horses |
|---|---|---|
| Averages
Career-average metrics across all AI race analysis. Performance and pace averages reflect estimated historical performance; trainer and jockey grades score in-the-money percentages. Grading scale: A = elite • B = above average • C = average • D = below average • F = poor • — = no data |
||
| Pick Pony AI Rating | A | B |
| Pace Trip Longshot | — | — |
| Connections Longshot | — | — |
| Situational Longshot | — | — |
| Speed | F | D |
| Early Pace | F | C |
| Mid Pace | F | C |
| Late Pace | C | C |
| Finish Pos | F | F |
| Dirt Speed | A | A |
| Turf Speed | A | A |
| Distance Speed | A | A |
| Trainer Effectiveness | C | D |
| Jockey Effectiveness | A | B |
| 3rd Party Ratings | B | C |
| Recent
Performance analysis from the horse's recent races, weighted to reflect current form. Sprint and Route FPS (Foot Per Second) measure pace efficiency over the horse's recent sprints and routes respectively. Grading scale: A = elite • B = above average • C = average • D = below average • F = poor • — = no data |
||
| Speed | D | D |
| Early Pace | F | C |
| Mid Pace | F | C |
| Late Pace | C | C |
| Sprint FPS | D | C |
| Route FPS | D | B |
| Trainer Effectiveness | C | D |
| Jockey Effectiveness | A | B |
| 3rd Party Ratings | B | C |
| Predictions
AI-generated projections for the upcoming race, derived from prior AI analysis for speed and pace trends, surface and distance suitability, and current conditions. Grading scale: A = elite • B = above average • C = average • D = below average • F = poor • — = no data |
||
| Speed | F | D |
| Early Pace | F | C |
| Mid Pace | D | C |
| Late Pace | C | C |
Chart Guide (2.0.36)
- Bubbles
- Color = surface: green (turf), brown (dirt), blue (synthetic)
- Top number = finishing position; bottom number in parentheses = starting post position
- Height above line = beaten lengths — closer means a smaller margin
- Border = track conditions: green (FST/GD/FM), yellow (WF/SL/YLD), red (SY/MY/FRZ/SFT/HVY)
- Connecting Line
- Solid = good conditions; dashed = bad conditions
- Line Symbol
- ▲ Triangle = sprint (7f or less); ● Circle = route (more than 7f)
- Days Between Races
- Small number above each bubble (e.g. 19d) = days since the previous race — helps spot freshness, layoffs, and tight scheduling.
- Shaded Band (Bollinger)
- Highlights volatility — a wider band means more variation in recent performance
- Performance Trend
- Straight line showing the overall performance direction — angled up = improving, angled down = declining
- Dashed Reference Line
- AI Opponent = AI analysis class-level par for the race
AI Model History Guide
- Lines
- Each solid line shows this horse’s model score over its last 10 races: blue = Mod1, green = Mod2, amber = Mod3.
- Dashed Lines
- Dashed lines represent the current race’s field average for each model — a score below the dashed line indicates the horse ranked below average in this model’s assessment.
- Higher is Stronger
- All three model scores are 0–100: a higher number means the model rates this horse more favorably among the field.
Mod1(W): 82 (1/8) Mod2(W): 75 (2/8) Mod3(W): 79 (3/8) Mod1-LS: 55 (6/8) Win Prob: 18.4% Value Score: 1.35 ★
Performance vs. Peers Guide
- Bars (per post)
- Blue = avg career performance • Amber = avg last 3 races • Green = last race (improved vs. avg) • Red = last race (declined vs. avg)
- Trend Line
- Angled line above the bars: rising = improving form • falling = declining form.
- Horizontal Line
- Field average — the mean career performance of all horses in this race.
- Color Circles
- Standard post-position colors below each lane — same as the Total Pace chart.
- Border
- Thicker border = this horse’s post position.
Figure Comparison
- Rating
- The three Pick Pony algorithm ratings (Algo 1, Algo 2, Algo 3) that make up the overall PP AI Rating — higher is a stronger contender rating.
- Speed
- Career average speed, recent 3-race average, and last-race speed figure — spot horses in improving or declining form.
- Pace
- Average Early (E1), Mid (E2), and Stretch (LP) pace figures — reveals pace-setters vs. closers vs. all-the-way types.
- This horse
- The horse whose stats card is open is highlighted with a darker column background.
Winning Profiles
- Axes
- X: Win % from last 10 starts — Y: In-the-money % (top-3 finishes) from last 10 starts.
- Quadrants
- Consistent Winners (top-right): high win & ITM — reliable performers.
Place Threats (top-left): boards often but doesn’t win often — good exacta/trifecta angles.
Streaky (bottom-right): wins occasionally, misses the board often — all-or-nothing.
Developing (bottom-left): still finding form — longshot territory. - Reference Lines
- Dashed lines mark field averages. Dots to the right win more; dots higher board more.
- This horse
- Highlighted with a gold border and larger dot.
AI Model Comparison
- Winner Models (green)
- Mod1(W), Mod2(W), and Mod3(W) trained to predict race winners. Higher score = stronger contender.
- Longshot Models (red)
- Mod1-LS, Mod2-LS, and Mod3-LS trained to find high-value longshots. Higher score = stronger longshot candidate.
- Form Model (blue)
- Mod4 sequence model trained on recent form patterns. Higher score = stronger recent form profile.
- This horse
- Highlighted with a darker column background.
Race Pace Simulation Guide
- Slider
- Drag left→right to advance from gate to finish. Drag all the way back to reset the race.
- Predicted Finish Order
- Factors in contested pace burn, each horse’s effort curve (peaked-early vs. peaked-late), and wide trip cost from outside posts. Updated live when Track Bias changes.
- Pace Scenario
- Lone Speed: single E horse likely rates and holds. Contested: two E horses burn each other — closers benefit. Hot Pace: speed meltdown, deep closers thrive. Soft: no early speed, moderate fractions throughout.
- Track Bias
- Slider below canvas. −2 = strong closer/wet bias; +2 = strong speed/rail bias. Recomputes the predicted finish order.
- Boxed Indicator
- Dashed orange ring = horse is surrounded (rival ahead, rival behind, wall outside). In a real race this horse must find a clear path to run.
- Running Styles
- E/EE = early speed (rushes to rail). P = presser (stalks the pace). S = stalker. SS = slow starter / closer.
| Stat | vs. Current Card | vs. All Horses |
|---|---|---|
| Averages
Career-average metrics across all AI race analysis. Performance and pace averages reflect estimated historical performance; trainer and jockey grades score in-the-money percentages. Grading scale: A = elite • B = above average • C = average • D = below average • F = poor • — = no data |
||
| Pick Pony AI Rating | A | A |
| Pace Trip Longshot | — | — |
| Connections Longshot | — | — |
| Situational Longshot | — | — |
| Speed | D | D |
| Early Pace | A | A |
| Mid Pace | A | A |
| Late Pace | D | D |
| Finish Pos | B | D |
| Dirt Speed | F | C |
| Turf Speed | C | C |
| Distance Speed | D | C |
| Trainer Effectiveness | A | B |
| Jockey Effectiveness | A | A |
| 3rd Party Ratings | D | C |
| Recent
Performance analysis from the horse's recent races, weighted to reflect current form. Sprint and Route FPS (Foot Per Second) measure pace efficiency over the horse's recent sprints and routes respectively. Grading scale: A = elite • B = above average • C = average • D = below average • F = poor • — = no data |
||
| Speed | C | C |
| Early Pace | B | B |
| Mid Pace | A | A |
| Late Pace | D | D |
| Sprint FPS | D | B |
| Route FPS | A | A |
| Trainer Effectiveness | A | B |
| Jockey Effectiveness | A | A |
| 3rd Party Ratings | D | C |
| Predictions
AI-generated projections for the upcoming race, derived from prior AI analysis for speed and pace trends, surface and distance suitability, and current conditions. Grading scale: A = elite • B = above average • C = average • D = below average • F = poor • — = no data |
||
| Speed | D | D |
| Early Pace | A | A |
| Mid Pace | A | A |
| Late Pace | C | C |
TL;DR
Toggle
Get more in-depth analysis, expert picks, handicapper reports, AI picks, handicapping tools, in-article data tooltips, NO ADVERTISEMENTS, and other membership perks with a Pick Pony subscription!
Don’t forget Pick Pony’s Expert Picks, AI Picks, and Past Performance Sheets/Racing Forms!
The Pick Pony Handicapper's Report is published daily and provides analysis of all races on the card. A Pick Pony analyst prepares the report, so selections may differ from the Pick Pony Expert Picks, which are based on the consensus of all Pick Pony analysts.
Fair Grounds kicks off Sunday racing with an eight-race card featuring Louisiana-bred claimers, maiden special weights, and a competitive turf allowance race. The track continues its winter meet with competitive fields across all divisions, highlighted by a deep turf allowance optional claimer in the seventh race with twelve runners.
The racing conditions favor tactical speed on the dirt, while the turf course with the rail set at 21 feet provides more balanced opportunities for various running styles. Track superintendent Pedro Zavala and his crew have maintained excellent surface conditions following their successful navigation of winter weather challenges earlier in the meet.
Weather and Track Conditions
The weather forecast calls for mostly sunny skies with cooler temperatures than recent days. Highs are expected in the upper 50s with north winds blowing at 10 to 15 mph, with gusts potentially reaching 30 mph in the morning hours. These conditions should produce a fast dirt surface and firm turf footing, ideal for confident riding and tactical positioning.
The cooler, drier conditions contrast with the warmer pattern that has dominated the region recently. The north winds may favor inside posts slightly on the dirt, as horses breaking from outside posts could face headwinds down the backstretch.
Track Bias and Post Position Analysis
Fair Grounds demonstrates one of the most pronounced inside biases in North American racing, particularly on dirt routes. Statistical analysis reveals posts one through three combine for 53 percent of two-turn dirt victories, with middle posts four through six accounting for 35 percent and outside posts seven and beyond capturing just 12 percent. This disparity stems from the relatively short run to the first turn, forcing outside horses into difficult early decisions.
In dirt sprints, the inside advantage remains significant though less extreme, with posts one through three winning approximately 50 percent of sprint events. Speed horses able to establish position before the turn hold distinct advantages. The track's speed-favoring configuration means wire-to-wire winners and stalkers combine for nearly 80 percent of dirt victories.
On turf, the 21-foot rail position creates fairer post distribution compared to inner rail settings. Inside draws still provide marginal advantages in turf sprints, but turf routes see more balanced results with running style and tactical positioning proving more critical than starting gate location. Closers have performed exceptionally well in turf routes during recent meets, winning 40 percent of races, while stalkers accounted for 38 percent.
Race 1 – Claiming – 6 Furlongs Dirt
Post Time: 12:45 PM
The opener features an eight-horse Louisiana-bred claiming sprint for horses that have never won two races. The $5,000 claiming tag and distance combination typically produces competitive fields where form cycles and trainer intent play crucial roles. Several horses are dropping in class, creating opportunities for savvy handicappers.
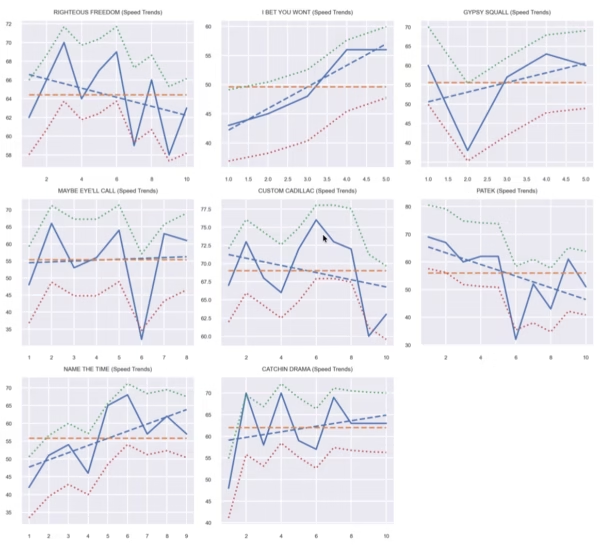
Pace Analysis
The pace structure appears moderately contested with several horses demonstrating tactical speed. Custom Cadillac shows early speed credentials from post five, while Maybe Eye'll Call and Gypsy Squall both possess stalking abilities. The honest pace scenario favors horses with tactical positioning and strong finishing kicks rather than wire-to-wire types.
Key Contenders
Custom Cadillac draws significant support as the morning line favorite at 5-2. Trainer L. Jay Cuccia sends out this six-year-old gelding who possesses tactical speed and the rail-hugging tendencies that play well at Fair Grounds. The middle post position allows tactical flexibility, and jockey Mitchell Murrill's 12 percent win rate provides competent handling.
Maybe Eye'll Call represents trainer Keith Bourgeois, who maintains a solid 20 percent win rate at the current meet. The four-year-old gelding gets Jose Ortiz, the meet's dominant rider with 98 wins last season at 29 percent. The inside post four position keeps this runner close to the favored rail, and the combination of top connections makes this a formidable threat at 3-1.
Gypsy Squall merits serious consideration despite longer odds. Trainer Lee Thomas conditions this four-year-old gelding who won over course and distance two starts back. The winning form provides confidence, and post three keeps him in striking position. Colby Hernandez rides with a 14 percent win rate and 45 percent in-the-money percentage.
Secondary Choices
Righteous Freedom adds depth from the rail for trainer Noel Dane. The six-year-old gelding gets weight relief and shows solid recent form at the track. The rail post provides maximum advantage on this speed-favoring surface. Jamison Mudd handles the mount, though at lower odds this becomes a value play rather than prime selection.
Catchin Drama offers longshot appeal as an eight-year-old gelding receiving significant weight relief. The seasoned campaigner has shown flashes of ability, and trainer Cynthia Morrell may have found the right spot. At 8-1 morning line odds, this represents exotic value rather than win betting material.
Betting Strategy and Wagering Angles
The race lacks overwhelming consensus, creating opportunities in vertical exotics. A trifecta box using the top four contenders (5-4-3-1) provides coverage of the most logical outcomes. The 10-cent superfecta incorporating five or six horses captures the competitive nature while limiting investment.
Exacta part wheels from 5 and 4 to cover 3,1,8 in second position balance risk and reward. The Pick 5 begins here, making this an attractive spreading race rather than single. Use four or five horses to maintain coverage while preserving bankroll for stronger opinions later.
Selections
Win: Custom Cadillac (5)
Place: Maybe Eye'll Call (4)
Show: Gypsy Squall (3)
Race 2 – Claiming – 6 Furlongs Dirt
Post Time: 1:15 PM
This Louisiana-bred claiming sprint features six older horses at the $12,500 level. The higher claiming price suggests slightly better quality than the opener, though the never-won-three-races condition indicates limited upside. Trainer connections and recent form cycles prove critical at this claiming level.
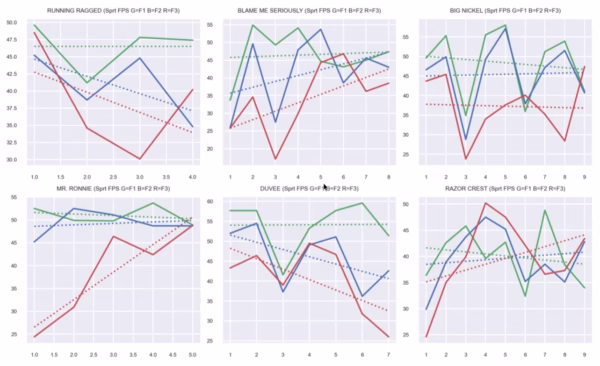
Pace Analysis
Big Nickel and Mr. Ronnie both demonstrate leader/slower-leads credentials, suggesting they will battle for early positioning. The contested early pace sets up horses with strong closing kicks or tactical versatility. The six-furlong distance allows little margin for error, making tactical positioning paramount.
Key Contenders
Razor Crest commands significant handicapping support as the favorite at 5-2. Trainer Sam David Jr. saddles this five-year-old gelding who shows fastest-deep running style, positioning him to benefit from the expected pace battle. Marcelino Pedroza Jr. rides with a 14 percent win rate and 49 percent in-the-money percentage, demonstrating consistency in the irons. The horse won his most recent turf start and drops back to dirt where he has shown ability.
Big Nickel represents a significant angle as a recent winner at the track. Trainer Sturges Ducoing maintains a 22 percent win rate, and this gelding captured a similar race at Fair Grounds last out. CJ McMahon takes the mount with a preference for front-running types. Post three keeps him in the advantageous inside positions that have dominated at the meet.
Mr. Ronnie offers value at 4-1 for the capable Joe Duhon barn. This five-year-old gelding won a one-mile race at Evangeline Downs last out and returns to Fair Grounds where he has competitive form. James Graham's 11 percent win rate provides adequate handling, and the slight class relief positions this one favorably.
Secondary Choices
Duvee enters off a disappointing effort but possesses significant class. The veteran campaigner gets Paco Lopez, who brings a 24 percent win rate despite recent riding crop suspensions limiting his national schedule. The David barn enters two, suggesting they have confidence in at least one runner.
Blame Me Seriously represents the Shane Wilson barn, which maintains a 18 percent win rate with 45 percent in-the-money runners. Isaac Castillo provides competent handling for a trainer who leads the local circuit. This five-year-old horse shows tactical speed and will be positioned forwardly from post two.
Betting Strategy and Wagering Angles
The competitive nature creates exacta value using Razor Crest on top over Big Nickel and Mr. Ronnie. A trifecta box of 6-3-4 captures the three primary contenders while limiting investment. The Pick 4 begins here, making this another spreading race where using three or four horses maintains sequence viability.
Superfecta play should incorporate five horses to capture potential surprise finishers. The claiming level creates uncertainty that rewards broader exotic coverage.
Selections
Win: Razor Crest (6)
Place: Big Nickel (3)
Show: Mr. Ronnie (4)
Race 3 – Claiming – 6 Furlongs Dirt
Post Time: 1:45 PM
The third race presents another Louisiana-bred claiming sprint at the $5,000 level, similar to the opener. Eight geldings compete in this never-won-two condition, with several dropping from higher levels seeking relief. The competitive nature and lack of clear standouts create exotic value opportunities.
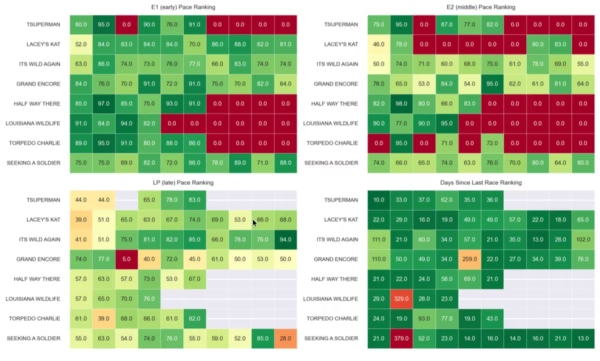
Pace Analysis
Tsuperman shows fastest-leads credentials and should secure early position from the rail. Half Way There and Louisiana Wildlife both possess stalking abilities that position them to track the early pace. The moderate tempo favors horses positioned within striking distance approaching the turn for home.
Key Contenders
Louisiana Wildlife receives overwhelming consensus support at 2-1. Trainer Shane Wilson saddles this five-year-old gelding who possesses strong form credentials and tactical speed. Isaac Castillo's 9 percent win rate understates his effectiveness, particularly with Louisiana-bred stock where he excels. Post six provides excellent tactical positioning, and the stalking running style suits the expected pace.
Half Way There represents the capable Sturges Ducoing barn that scored in the previous race. This four-year-old gelding finished second over course and distance recently, suggesting fitness and readiness. Ben Curtis rides with an 18 percent win rate and brings stakes-winning credentials to claiming races. The rail-adjacent post five maintains inside advantage while avoiding potential trouble on the rail.
Tsuperman adds intrigue from the rail for trainer Rylee Magnon. This four-year-old gelding demonstrates fastest-leads running style and figures to establish early positioning. Devin Magnon handles the mount for the family operation that maintains a 16 percent win rate with 53 percent in-the-money runners. The rail post maximizes the speed bias advantage.
Secondary Choices
Torpedo Charlie offers value at 5-1 for trainer Lee Thomas. This five-year-old gelding won two starts back and receives significant weight relief. Jamison Mudd's aggressive style suits front-running types, and post seven provides a clean break without interference.
Grand Encore represents trainer Sherman Savoie with Emanuel Nieves aboard. This six-year-old gelding shows solid recent form and will be forwardly placed throughout. The 6-1 morning line odds provide value for exotic inclusion.
Betting Strategy and Wagering Angles
The divided opinion creates ideal conditions for trifecta boxes and superfecta wheels. A trifecta box using 6-5-1 captures the three primary contenders while maintaining manageable investment. Superfecta wheels using 6 on top over 5,1,7,4 in the remaining positions balance conviction with coverage.
The Pick 3 begins here, making this an attractive spreading race. Use four horses to maintain sequence viability while preserving bankroll for stronger opinions.
Selections
Win: Louisiana Wildlife (6)
Place: Half Way There (5)
Show: Tsuperman (1)
Race 4 – Claiming – 1 Mile 70 Yards Dirt
Post Time: 2:15 PM
The fourth race stretches to a two-turn mile-plus on dirt, the distance where Fair Grounds' inside bias becomes most pronounced. Seven older horses compete at the $15,000 claiming level in the never-won-three condition. Post position and early speed prove critical handicapping factors.
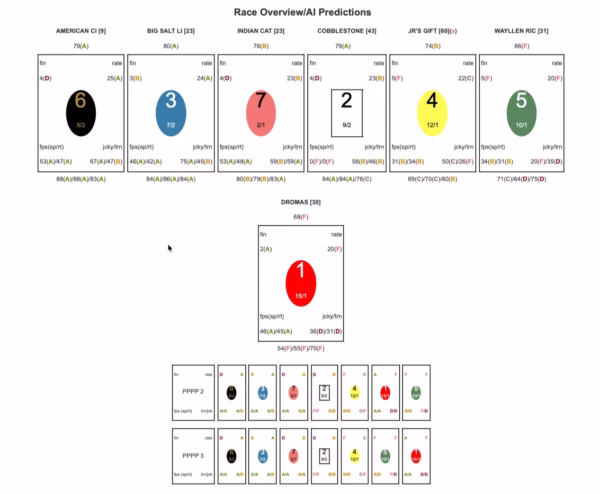
Pace Analysis
Multiple horses demonstrate early tactical speed, suggesting contested early fractions. Indian Cat and American City both show stalking credentials that position them favorably. The two-turn configuration and honest pace favor horses positioned within striking distance entering the far turn.
Key Contenders
Indian Cat receives strong consensus backing at 2-1. Trainer Thomas Amoss enters with excellent Fair Grounds credentials, and this four-year-old gelding shows tactical speed from post seven. Jose Ortiz provides elite handling, though the outside post creates challenges given the pronounced inside bias. The gelding must overcome the tactical disadvantage, though class and connections provide confidence.
American City merits serious consideration from post six for trainer Randy Degeyter Jr. This four-year-old gelding demonstrates tactical ability and draws Marcelino Pedroza Jr., who rides with consistency. The slightly inside post relative to Indian Cat provides positional advantage, though both face challenges from outside draws. The 5-2 morning line odds reflect appropriate respect.
Big Salt Lick adds value at 7-2 despite scratching from previous commitments. Trainer Carlos Santamaria conditions this six-year-old gelding who possesses route experience. Isaac Castillo's familiarity with the circuit provides confidence, and post three positions this one perfectly on the favored inside.
Secondary Choices
Cobblestone Bridge represents the Mike Stidham barn with Paco Lopez aboard. This five-year-old gelding shows class and gets an excellent rider despite recent suspensions. Post two provides ideal positioning, and the veteran campaigner has shown ability at this level.
Wayllen Richard offers intrigue for the powerful Wayne Catalano barn. This four-year-old gelding gets Devin Magnon from post five. The trainer's 19 percent win rate demands respect, and the middle post provides tactical flexibility.
Betting Strategy and Wagering Angles
The outside post positions for the two favorites create value opportunities. Exacta boxes using 7-6-3-2 capture the top contenders while emphasizing inside post advantage. Trifecta wheels using 3 or 2 on top over the field reward horses overcoming the bias.
The two-turn configuration makes this an ideal Pick 3 or Pick 4 spreading race. Use four horses to maintain coverage while acknowledging the post position challenges facing favorites.
Selections
Win: Indian Cat (7)
Place: American City (6)
Show: Big Salt Lick (3)
Race 5 – Claiming – 5 Furlongs Turf
Post Time: 2:45 PM
The fifth race moves to the turf course for a competitive ten-horse claiming sprint. The $15,000 level and never-won-four condition create a wide-open affair where post position and tactical speed prove critical. The rail positioned at 21 feet creates fairer distribution than inner settings.
Pace Analysis
Star's Image shows fast-leads credentials and should establish early position. Bourbon Boss demonstrates tactical speed that positions him to press or stalk the leader. The turf sprint distance creates honest fractions that favor horses with strong finishing kicks positioned within striking distance.
Key Contenders
Star's Image receives significant backing at 3-1. Trainer Larry Rivelli conditions this four-year-old colt who demonstrates fast-leads running style. Jareth Loveberry rides with a 25 percent win rate when aboard this runner, suggesting effective partnership. Post four provides clean positioning without rail concerns, and the tactical speed suits turf sprints where early position matters.
Bourbon Boss merits serious consideration at 4-1 for trainer Joe Sharp, the meet's leading conditioner with 18 wins from 77 starts. This five-year-old horse carries top weight but possesses class and tactical versatility. Paco Lopez brings 24 percent win rate credentials despite recent suspensions. Post six provides tactical flexibility, and the Sharp barn's dominance demands respect.
Upturned Brim adds value at 5-1 for trainer Randy Degeyter Jr. This five-year-old gelding gets Marcelino Pedroza Jr. from post ten. While the outside draw creates challenges, turf sprints distribute success more evenly across posts than dirt races. The gelding possesses tactical speed and finishing ability.
Secondary Choices
Covey offers intrigue from post nine for trainer Ethan West. This six-year-old gelding gets Colby Hernandez and shows tactical ability. The 6-1 morning line odds provide value for horses capable of strong finishes.
Briterdayzahead represents trainer Jose Camejo with Sofia Vives aboard. This six-year-old gelding carries top weight but demonstrates class. Post eight provides clean positioning, and the veteran campaigner has shown turf ability.
Betting Strategy and Wagering Angles
The competitive ten-horse field creates ideal superfecta opportunities. Wheels using 4 or 6 on top over the field reward the top contenders while capturing potential longshots. Trifecta boxes using 4-6-10-9 balance investment with coverage.
The turf sprint creates uncertainty that rewards broader exotic coverage. The Pick 4 continues through this race, making it attractive for spreading rather than singling.
Selections
Win: Star's Image (4)
Place: Bourbon Boss (6)
Show: Upturned Brim (10)
Race 6 – Maiden Special Weight – 1 Mile Dirt
Post Time: 3:15 PM
The sixth race features a six-horse maiden special weight at one mile on dirt. The $54,000 purse attracts quality maiden runners, including several with top connections and breeding. Post position becomes less critical with the smaller field, though inside draws still provide advantages.
Pace Analysis
Suspiciously Named shows fast-leads credentials and should establish early position from post five. The moderate pace scenario favors horses with tactical positioning and strong finishing kicks. The one-mile distance allows developing runners room to settle and finish.
Key Contenders
Rothko commands overwhelming support at even money. Trainer Brad Cox enters with an exceptional 39 percent win rate at the current meet. This four-year-old colt finished second last out at Churchill Downs, suggesting readiness to graduate. Marcelino Pedroza Jr. provides competent handling, and the Cox barn excels with maiden runners. Post four provides ideal positioning.
Crazy Diamond offers value at 5-1 for trainer Lindsay Schultz. This four-year-old colt shows tactical ability and gets Paco Lopez, whose 35 percent win rate demands respect. The runner finished second in his most recent start and demonstrates improvement. Post two maintains inside advantage, and the Lopez-Schultz partnership suggests confidence.
Mingo enters from the powerful Steven Asmussen barn with Isaac Castillo aboard. This five-year-old horse debuted recently with a solid effort. The Asmussen operation maintains a 16 percent win rate with 42 percent in-the-money runners. Post one maximizes the speed bias advantage, and the breeding suggests significant ability.
Secondary Choices
Lahainaluna represents the Joe Sharp barn with Jose Ortiz aboard. This four-year-old colt makes his career debut but possesses outstanding connections. The Sharp-Ortiz partnership dominated the previous meet, and first-time starters merit respect from this combination. Post six provides clean positioning without traffic concerns.
Bestball adds depth for trainer Destin Heath with James Graham riding. This four-year-old colt has raced six times without success but shows breeding that suggests ability. The 20-1 morning line odds make this strictly exotic filler.
Betting Strategy and Wagering Angles
The small field and strong favorite create vertical exotic value using Rothko on top. Exacta wheels from 4 to 2,1,6 capture the most logical scenarios while limiting investment. Trifecta wheels using 4 on top over 2,1,6 with all underneath balance conviction with coverage.
This represents a potential Pick 3 or Pick 4 single, allowing spread in surrounding races. The Cox barn's dominance and Rothko's form make singling attractive for multi-race sequences.
Selections
Win: Rothko (4)
Place: Crazy Diamond (2)
Show: Mingo (1)
Race 7 – Allowance Optional Claiming – 1 Mile Turf
Post Time: 3:45 PM
The seventh race showcases a competitive twelve-horse Louisiana-bred allowance optional claiming event on turf. The one-mile distance and deep field create handicapping challenges, though quality horses emerge from multiple barns. The rail at 21 feet provides balanced post distribution.
Pace Analysis
Multiple horses demonstrate tactical speed, suggesting honest early fractions. Wayside Drive and Brittany's Dream show leads credentials that position them forwardly. The turf route distance and competitive field favor closers and horses with tactical versatility positioned to finish strongly.
Key Contenders
Boss of All Bosses receives significant support at 2-1 for trainer Michael Maker. This four-year-old colt carries higher weight but possesses class advantage as an allowance runner. Jose Ortiz provides elite handling, and post four positions this runner ideally. The colt demonstrates mid-pack-stalker running style that suits turf routes where closers excel.
Pegaso merits serious consideration at 4-1 for trainer Patti Turner. This five-year-old gelding shows fastest-deep running style and has finished second in his last two starts at Fair Grounds. James Graham rides with confidence despite modest statistics, and post five provides tactical positioning. The consistent recent form suggests readiness.
Calicoco adds value at 5-1 for the Shane Wilson barn. This six-year-old gelding demonstrates fast-leader credentials and will be positioned forwardly throughout. Isaac Castillo's familiarity with Louisiana-bred stock provides confidence, and post one maximizes any speed bias. The gelding has shown ability at this level.
Secondary Choices
Fran's Star represents the Shane Wilson barn's second entry with Paco Lopez aboard. This five-year-old gelding possesses class and tactical ability. The Wilson barn's dual entry suggests confidence in their chances, and Lopez's riding ability warrants respect.
Wayside Drive offers longshot appeal at 15-1 for trainer Joe Duhon. This four-year-old gelding gets elite rider Florent Geroux, whose 20 percent win rate at Fair Grounds last season demonstrates effectiveness. Post seven provides clean positioning, and the combination creates value.
Slick and Fast adds intrigue at 12-1 for the Sam David Jr. barn. This six-year-old gelding won his most recent Fair Grounds start and demonstrates slower-leads running style. Marcelino Pedroza Jr. rides, and the claiming option weight allowance benefits this one. Post ten creates challenges but turf routes distribute success more evenly.
Betting Strategy and Wagering Angles
The twelve-horse field creates ideal superfecta opportunities. Boxes using six or seven horses capture competitive scenarios while managing investment. Trifecta wheels using 4 or 5 on top over the field reward the top contenders.
The large field and divided opinion make this attractive for spreading in multi-race sequences. Use five or six horses in Pick 3 or Pick 4 plays to maintain coverage.
Selections
Win: Boss Of All Bosses (4)
Place: Pegaso (5)
Show: Calicoco (1)
Race 8 – Claiming – 6 Furlongs Dirt
Post Time: 4:15 PM
The finale features a ten-horse Louisiana-bred claiming sprint at the $5,000 level. Older geldings compete in the never-won-four condition, creating a competitive affair where form cycles and trainer patterns prove critical. The inside bias resurfaces on dirt, making post position paramount.
Pace Analysis
Multiple horses demonstrate leads credentials, suggesting contested early fractions. Sono and Apriority Rocket both show fast-leads running style, setting up tactical types and closers. The competitive pace scenario favors horses positioned to finish strongly.
Key Contenders
Sono receives significant backing at 7-2 for trainer Keith Bourgeois. This six-year-old gelding demonstrates tactical ability and draws post one, maximizing the pronounced inside advantage. Jareth Loveberry rides with consistency, and the rail post provides optimal positioning for a speed-biased track. Recent form suggests readiness.
Apriority Rocket merits serious consideration at 4-1 for trainer Joe Sharp. This six-year-old gelding possesses tactical speed and gets Jose Ortiz, the meet's dominant rider. Post eight creates challenges given the inside bias, but the Sharp-Ortiz partnership's dominance warrants respect. The gelding shows fast-leads credentials that could overcome the post disadvantage.
Hooray Austin adds value at 5-1. This ten-year-old gelding brings veteran savvy and draws post four, maintaining inside advantage. Marcelino Pedroza Jr. provides competent handling, and the middle post allows tactical flexibility.
Secondary Choices
Drewmazing offers intrigue at 6-1 for trainer Emile Schwandt. This seven-year-old gelding gets CJ McMahon from post six. The runner shows tactical ability and will be positioned forwardly.
Oak Hill Lg represents the Rylee Magnon barn with Devin Magnon aboard. This seven-year-old ridgling gets post two, maintaining excellent inside positioning. The family operation's 16 percent win rate provides confidence.
Betting Strategy and Wagering Angles
The competitive ten-horse field creates superfecta value. Wheels using 1 or 8 on top over the field capture the post position tension between rail advantage and dominant connections. Trifecta boxes using 1-8-4-6 balance investment with coverage.
The finale provides Pick 3 and Pick 4 conclusions, making this attractive for spreading to capture various scenarios. The claiming level creates uncertainty that rewards broader coverage.
Selections
Win: Sono (1)
Place: Apriority Rocket (8)
Show: Hooray Austin (4)
Jockey Notes and Insights
Jose Ortiz continues his dominance of the Fair Grounds jockey colony. The Puerto Rican rider captured the 2024-25 title with 98 wins at a 29 percent clip, the highest total since Florent Geroux matched that figure in 2016-17. Ortiz excels on all surfaces and at all class levels, making his mounts automatic considerations. He rides Maybe Eye'll Call (Race 1), Indian Cat (Race 4), Boss Of All Bosses (Race 7), Apriority Rocket (Race 8), and Lahainaluna (Race 6), providing multiple opportunities throughout the card.
Paco Lopez brings elite credentials despite recent riding crop violations limiting his national schedule. The veteran rider maintains a 35 percent win rate in his Fair Grounds mounts and excels with Louisiana-bred stock. Lopez rides Duvee (Race 2), Bourbon Boss (Race 5), Crazy Diamond (Race 6), and Fran's Star (Race 7). His aggressive style suits front-running types, and his experience navigating claiming races provides distinct advantages.
Isaac Castillo demonstrates consistent effectiveness with Louisiana-bred horses. The rider maintains strong connections with the Shane Wilson and Keith Bourgeois barns, two operations that dominate the local circuit. Castillo rides Blame Me Seriously (Race 2), Louisiana Wildlife (Race 3), Big Salt Lick (Race 4), Calicoco (Race 7), and Mingo (Race 6). His familiarity with claiming horses and Louisiana breeding provides edges at this specialist level.
Marcelino Pedroza Jr. offers steady consistency across all divisions. The Panama native led Indiana Grand in wins and earnings in 2019 and earned his first graded stakes win at Fair Grounds. Pedroza rides Razor Crest (Race 2), American City (Race 4), Upturned Brim (Race 5), Rothko (Race 6), Slick And Fast (Race 7), and Hooray Austin (Race 8), providing multiple opportunities throughout the card.
Colby Hernandez maintains a 14 percent win rate with 45 percent in-the-money percentage. The rider excels in sprints and claiming races where aggressive tactics prove effective. Hernandez rides Gypsy Squall (Race 1), Running Ragged (Race 2), Covey (Race 5), and Sunday Breeze (Race 7), all at competitive odds suggesting value opportunities.
Trainer Notes and Insights
Joe Sharp leads the current Fair Grounds meet with 18 wins from 77 starts, a 23 percent strike rate that demonstrates consistent excellence. The conditioner won the 2024-25 training title with 40 victories at a 26 percent clip, establishing himself as the dominant local force. Sharp saddles Bourbon Boss (Race 5), Apriority Rocket (Race 8), and Lahainaluna (Race 6), providing multiple opportunities throughout the card. His partnership with Jose Ortiz produces exceptional results that warrant automatic consideration.
Brad Cox enters the meet with an outstanding 39 percent win rate from 28 starters. The Hall of Fame trainer finished second in wins last season with 31 victories at a 30 percent clip. Cox excels with maiden runners and quality stock, making his entries automatic considerations regardless of odds. He saddles Rothko (Race 6), the overwhelming favorite in the maiden special weight. Cox's presence elevates any runner's chances significantly.
Shane Wilson maintains consistent volume with 12 wins from 88 starts at a 14 percent rate. The conditioner dominated the 2023-24 meet with 50 victories but experienced a comparative decline last season with just 27 wins. Wilson saddles Blame Me Seriously (Race 2), Louisiana Wildlife (Race 3), Calicoco (Race 7), and Fran's Star (Race 7), with the dual entry in Race 7 suggesting confidence in his turf route specialists. His Louisiana-bred expertise provides distinct advantages in these restricted races.
Steven Asmussen brings national credentials to the local circuit with 7 wins from 33 starts. While the percentage appears modest, Asmussen's quality over quantity approach produces consistent results in stakes and allowance races. He saddles Mingo (Race 6), a first-time starter in the maiden special weight who warrants respect based on breeding and connections alone.
Thomas Amoss conditions Indian Cat (Race 4), bringing decades of Fair Grounds experience to the competitive claiming race. The veteran conditioner understands the nuances of local racing and excels at placing horses where they can succeed. His partnership with Jose Ortiz creates formidable combinations.
Best Wagering Strategies and Value Plays
The Fair Grounds bias toward inside posts and early speed creates systematic advantages for handicappers willing to emphasize these factors. In two-turn dirt routes, horses breaking from posts one through three win 53 percent of races, creating measurable edges for educated bettors. Race 4 exemplifies this dynamic, where the favorites break from outside posts while inside runners offer value.
The Pick 5 beginning in Race 1 presents attractive opportunities given the competitive nature of the early claiming races. Spreading four or five horses in Races 1, 2, and 3 while singling or using two horses in Races 4 and 5 balances coverage with investment. The Pick 4 beginning in Race 2 follows similar logic, with Race 6 providing a potential single with Rothko.
Vertical exotics in claiming races offer superior value to win betting given form cycle uncertainty and class relief angles. Races 1, 3, and 8 all feature competitive fields where trifecta boxes and superfecta wheels capture multiple logical outcomes. The 10-cent superfecta particularly rewards broader coverage in ten-horse fields like Race 8.
Turf races distribute success more evenly across posts and running styles than dirt races, creating opportunities for longshots and tactical types. Race 7's twelve-horse field produces ideal superfecta scenarios where including horses at 10-1 or longer captures value while managing risk.
The maiden special weight in Race 6 provides a potential Pick 3, Pick 4, or Pick 5 single with Rothko. The Brad Cox trainee's overwhelming credentials and favorable form create scenarios where singling allows spreading in surrounding races. Using Rothko as a single while spreading four or five horses in adjacent races optimizes bankroll efficiency.
Cross-race wagers emphasizing the Sharp, Cox, Wilson, and Ortiz connections create systematic advantages. These operations demonstrate consistent excellence that transcends individual race analysis. Constructing Pick 3, Pick 4, and Pick 5 sequences emphasizing these connections while incorporating post position bias produces measurable edges over the betting public.
The Louisiana-bred restrictions throughout the card create information advantages for handicappers familiar with regional breeding and trainer patterns. Trainers Wilson, Bourgeois, and Castille excel with Louisiana-bred stock, and jockey Castillo demonstrates particular effectiveness with these runners. Emphasizing these connections in exotic wagers rewards specialized knowledge.
Rolling exotic wagers beginning with modest investment in early Pick 3s and Pick 4s, then pressing winning tickets into later sequences, optimizes risk-reward dynamics. The competitive nature of claiming races creates volatility that rewards patience and disciplined bankroll management rather than aggressive win betting on short-priced favorites.

Mod1(W): 82 (1/8) Mod2(W): 75 (2/8) Mod3(W): 79 (3/8) Mod1-LS: 55 (6/8) Win Prob: 18.4% Value Score: 1.35 ★