
Chart Guide (2.0.41)
What it shows: This horse’s recent races, one bubble per race, plotted by its AI speed figure against the class par for today’s race (the dashed line).
What to look for: Recent bubbles at or above the dashed line, a trend line angled up, and a narrow shaded band (steady form). Check whether the good runs came on today’s surface and distance.
- Bubbles
- Color = surface: green (turf), brown (dirt), blue (synthetic)
- Top number = finishing position; bottom number in parentheses = starting post position
- Height above line = beaten lengths — closer means a smaller margin
- Border = track conditions: green (FST/GD/FM), yellow (WF/SL/YLD), red (SY/MY/FRZ/SFT/HVY)
- Connecting Line
- Solid = good conditions; dashed = bad conditions
- Line Symbol
- ▲ Triangle = sprint (7f or less); ● Circle = route (more than 7f)
- Days Between Races
- Small number above each bubble (e.g. 19d) = days since the previous race — helps spot freshness, layoffs, and tight scheduling.
- Shaded Band (Bollinger)
- Highlights volatility — a wider band means more variation in recent performance
- Performance Trend
- Straight line showing the overall performance direction — angled up = improving, angled down = declining
- Dashed Reference Line
- AI Opponent = AI analysis class-level par for the race
AI Model History Guide
What it shows: How our AI models rated this horse in each of its recent races, compared with how they rate today’s field (the dashed lines).
What to look for: Lines that are rising and sit above the dashed field averages — the models have liked this horse and still do. Falling lines, or lines below the dashed ones, mean the models are cooling on it.
- Lines
- Each solid line shows this horse’s model score over its last 10 races: blue = Mod1, green = Mod2, amber = Mod3.
- Dashed Lines
- Dashed lines represent the current race’s field average for each model — a score below the dashed line indicates the horse ranked below average in this model’s assessment.
- Higher is Stronger
- All three model scores are 0–100: a higher number means the model rates this horse more favorably among the field.
Performance vs. Peers Guide
What it shows: Each horse’s career, last-3-race and last-race performance side by side, against the field average.
What to look for: Horses above the field average whose last race is green (better than their average) and whose trend line rises — improving form. Red last races and falling lines point to declining form.
- Bars (per post)
- Blue = avg career performance • Amber = avg last 3 races • Green = last race (improved vs. avg) • Red = last race (declined vs. avg)
- Trend Line
- Angled line above the bars: rising = improving form • falling = declining form.
- Horizontal Line
- Field average — the mean career performance of all horses in this race.
- Color Circles
- Standard post-position colors below each lane — same as the Total Pace chart.
- Border
- Thicker border = this horse’s post position.
Figure Comparison
What it shows: This horse’s ratings, speed figures and pace figures next to every other horse in the race.
What to look for: Where this horse (the darker column) leads the field or falls short. Strong ratings plus strong recent speed make a contender; recent speed well above career speed suggests improving form.
- Rating
- The three Pick Pony algorithm ratings (Algo 1, Algo 2, Algo 3) that make up the overall PP AI Rating — higher is a stronger contender rating.
- Speed
- Career average speed, recent 3-race average, and last-race speed figure — spot horses in improving or declining form.
- Pace
- Average Early (E1), Mid (E2), and Stretch (LP) pace figures — reveals pace-setters vs. closers vs. all-the-way types.
- This horse
- The horse whose stats card is open is highlighted with a darker column background.
Winning Profiles
What it shows: Each horse’s win rate and in-the-money rate over its last 10 starts, one dot per horse.
What to look for: Dots in the top-right are consistent winners. Top-left horses often finish in the money but rarely win — better for place and show bets or underneath in exotics. Bottom-left horses rarely finish well.
- Axes
- X: Win % from last 10 starts — Y: In-the-money % (top-3 finishes) from last 10 starts.
- Quadrants
- Consistent Winners (top-right): high win & ITM — reliable performers.
Place Threats (top-left): boards often but doesn’t win often — good exacta/trifecta angles.
Streaky (bottom-right): wins occasionally, misses the board often — all-or-nothing.
Developing (bottom-left): still finding form — longshot territory. - Reference Lines
- Dashed lines mark field averages. Dots to the right win more; dots higher board more.
- This horse
- Highlighted with a gold border and larger dot.
AI Model Comparison
What it shows: All AI model scores for every horse in the race, grouped by what each model is trained to find.
What to look for: The horse leading the green winner models is the models’ likely winner. A horse that stands out in the red longshot models but not the green ones is a longshot the models think is underrated.
- Winner Models (green)
- Mod1(W), Mod2(W), and Mod3(W) trained to predict race winners. Higher score = stronger contender.
- Longshot Models (red)
- Mod1-LS, Mod2-LS, and Mod3-LS trained to find high-value longshots. Higher score = stronger longshot candidate.
- Form Model (blue)
- Mod4 sequence model trained on recent form patterns. Higher score = stronger recent form profile.
- This horse
- Highlighted with a darker column background.
Race Pace Simulation Guide
What it shows: A simulated run of today’s race, based on each horse’s running style, post position and the expected pace.
What to look for: Who gets the lead, who gets boxed in, and who is gaining at the finish. Move the track-bias slider to see how the predicted order changes on a speed-favouring or closer-favouring track.
- Slider
- Drag left→right to advance from gate to finish. Drag all the way back to reset the race.
- Predicted Finish Order
- Factors in contested pace burn, each horse’s effort curve (peaked-early vs. peaked-late), and wide trip cost from outside posts. Updated live when Track Bias changes.
- Pace Scenario
- Lone Speed: single E horse likely rates and holds. Contested: two E horses burn each other — closers benefit. Hot Pace: speed meltdown, deep closers thrive. Soft: no early speed, moderate fractions throughout.
- Track Bias
- Slider below canvas. −2 = strong closer/wet bias; +2 = strong speed/rail bias. Recomputes the predicted finish order.
- Boxed Indicator
- Dashed orange ring = horse is surrounded (rival ahead, rival behind, wall outside). In a real race this horse must find a clear path to run.
- Running Styles
- E/EE = early speed (rushes to rail). P = presser (stalks the pace). S = stalker. SS = slow starter / closer.
| Stat | vs. Current Card | vs. All Horses |
|---|---|---|
| Averages
Career-average metrics across all AI race analysis. Performance and pace averages reflect estimated historical performance; trainer and jockey grades score in-the-money percentages. Grading scale: A = elite • B = above average • C = average • D = below average • F = poor • — = no data |
||
| Pick Pony AI Rating | D | D |
| Pace Trip Longshot | — | — |
| Connections Longshot | — | — |
| Situational Longshot | — | — |
| Speed | F | D |
| Early Pace | A | A |
| Mid Pace | A | A |
| Late Pace | F | D |
| Finish Pos | D | F |
| Dirt Speed | D | F |
| Turf Speed | F | D |
| Distance Speed | D | F |
| Trainer Effectiveness | F | F |
| Jockey Effectiveness | C | D |
| 3rd Party Ratings | C | C |
| Recent
Performance analysis from the horse's recent races, weighted to reflect current form. Sprint and Route FPS (Foot Per Second) measure pace efficiency over the horse's recent sprints and routes respectively. Grading scale: A = elite • B = above average • C = average • D = below average • F = poor • — = no data |
||
| Speed | F | D |
| Early Pace | A | A |
| Mid Pace | A | A |
| Late Pace | F | D |
| Sprint FPS | B | A |
| Route FPS | B | C |
| Trainer Effectiveness | F | F |
| Jockey Effectiveness | C | D |
| 3rd Party Ratings | C | C |
| Predictions
AI-generated projections for the upcoming race, derived from prior AI analysis for speed and pace trends, surface and distance suitability, and current conditions. Grading scale: A = elite • B = above average • C = average • D = below average • F = poor • — = no data |
||
| Speed | B | A |
| Early Pace | A | A |
| Mid Pace | D | F |
| Late Pace | C | C |
Chart Guide (2.0.41)
What it shows: This horse’s recent races, one bubble per race, plotted by its AI speed figure against the class par for today’s race (the dashed line).
What to look for: Recent bubbles at or above the dashed line, a trend line angled up, and a narrow shaded band (steady form). Check whether the good runs came on today’s surface and distance.
- Bubbles
- Color = surface: green (turf), brown (dirt), blue (synthetic)
- Top number = finishing position; bottom number in parentheses = starting post position
- Height above line = beaten lengths — closer means a smaller margin
- Border = track conditions: green (FST/GD/FM), yellow (WF/SL/YLD), red (SY/MY/FRZ/SFT/HVY)
- Connecting Line
- Solid = good conditions; dashed = bad conditions
- Line Symbol
- ▲ Triangle = sprint (7f or less); ● Circle = route (more than 7f)
- Days Between Races
- Small number above each bubble (e.g. 19d) = days since the previous race — helps spot freshness, layoffs, and tight scheduling.
- Shaded Band (Bollinger)
- Highlights volatility — a wider band means more variation in recent performance
- Performance Trend
- Straight line showing the overall performance direction — angled up = improving, angled down = declining
- Dashed Reference Line
- AI Opponent = AI analysis class-level par for the race
AI Model History Guide
What it shows: How our AI models rated this horse in each of its recent races, compared with how they rate today’s field (the dashed lines).
What to look for: Lines that are rising and sit above the dashed field averages — the models have liked this horse and still do. Falling lines, or lines below the dashed ones, mean the models are cooling on it.
- Lines
- Each solid line shows this horse’s model score over its last 10 races: blue = Mod1, green = Mod2, amber = Mod3.
- Dashed Lines
- Dashed lines represent the current race’s field average for each model — a score below the dashed line indicates the horse ranked below average in this model’s assessment.
- Higher is Stronger
- All three model scores are 0–100: a higher number means the model rates this horse more favorably among the field.
Mod1(W): 82 (1/8) Mod2(W): 75 (2/8) Mod3(W): 79 (3/8) Mod1-LS: 55 (6/8) Win Prob: 18.4% Value Score: 1.35 ★
Performance vs. Peers Guide
What it shows: Each horse’s career, last-3-race and last-race performance side by side, against the field average.
What to look for: Horses above the field average whose last race is green (better than their average) and whose trend line rises — improving form. Red last races and falling lines point to declining form.
- Bars (per post)
- Blue = avg career performance • Amber = avg last 3 races • Green = last race (improved vs. avg) • Red = last race (declined vs. avg)
- Trend Line
- Angled line above the bars: rising = improving form • falling = declining form.
- Horizontal Line
- Field average — the mean career performance of all horses in this race.
- Color Circles
- Standard post-position colors below each lane — same as the Total Pace chart.
- Border
- Thicker border = this horse’s post position.
Figure Comparison
What it shows: This horse’s ratings, speed figures and pace figures next to every other horse in the race.
What to look for: Where this horse (the darker column) leads the field or falls short. Strong ratings plus strong recent speed make a contender; recent speed well above career speed suggests improving form.
- Rating
- The three Pick Pony algorithm ratings (Algo 1, Algo 2, Algo 3) that make up the overall PP AI Rating — higher is a stronger contender rating.
- Speed
- Career average speed, recent 3-race average, and last-race speed figure — spot horses in improving or declining form.
- Pace
- Average Early (E1), Mid (E2), and Stretch (LP) pace figures — reveals pace-setters vs. closers vs. all-the-way types.
- This horse
- The horse whose stats card is open is highlighted with a darker column background.
Winning Profiles
What it shows: Each horse’s win rate and in-the-money rate over its last 10 starts, one dot per horse.
What to look for: Dots in the top-right are consistent winners. Top-left horses often finish in the money but rarely win — better for place and show bets or underneath in exotics. Bottom-left horses rarely finish well.
- Axes
- X: Win % from last 10 starts — Y: In-the-money % (top-3 finishes) from last 10 starts.
- Quadrants
- Consistent Winners (top-right): high win & ITM — reliable performers.
Place Threats (top-left): boards often but doesn’t win often — good exacta/trifecta angles.
Streaky (bottom-right): wins occasionally, misses the board often — all-or-nothing.
Developing (bottom-left): still finding form — longshot territory. - Reference Lines
- Dashed lines mark field averages. Dots to the right win more; dots higher board more.
- This horse
- Highlighted with a gold border and larger dot.
AI Model Comparison
What it shows: All AI model scores for every horse in the race, grouped by what each model is trained to find.
What to look for: The horse leading the green winner models is the models’ likely winner. A horse that stands out in the red longshot models but not the green ones is a longshot the models think is underrated.
- Winner Models (green)
- Mod1(W), Mod2(W), and Mod3(W) trained to predict race winners. Higher score = stronger contender.
- Longshot Models (red)
- Mod1-LS, Mod2-LS, and Mod3-LS trained to find high-value longshots. Higher score = stronger longshot candidate.
- Form Model (blue)
- Mod4 sequence model trained on recent form patterns. Higher score = stronger recent form profile.
- This horse
- Highlighted with a darker column background.
Race Pace Simulation Guide
What it shows: A simulated run of today’s race, based on each horse’s running style, post position and the expected pace.
What to look for: Who gets the lead, who gets boxed in, and who is gaining at the finish. Move the track-bias slider to see how the predicted order changes on a speed-favouring or closer-favouring track.
- Slider
- Drag left→right to advance from gate to finish. Drag all the way back to reset the race.
- Predicted Finish Order
- Factors in contested pace burn, each horse’s effort curve (peaked-early vs. peaked-late), and wide trip cost from outside posts. Updated live when Track Bias changes.
- Pace Scenario
- Lone Speed: single E horse likely rates and holds. Contested: two E horses burn each other — closers benefit. Hot Pace: speed meltdown, deep closers thrive. Soft: no early speed, moderate fractions throughout.
- Track Bias
- Slider below canvas. −2 = strong closer/wet bias; +2 = strong speed/rail bias. Recomputes the predicted finish order.
- Boxed Indicator
- Dashed orange ring = horse is surrounded (rival ahead, rival behind, wall outside). In a real race this horse must find a clear path to run.
- Running Styles
- E/EE = early speed (rushes to rail). P = presser (stalks the pace). S = stalker. SS = slow starter / closer.
| Stat | vs. Current Card | vs. All Horses |
|---|---|---|
| Averages
Career-average metrics across all AI race analysis. Performance and pace averages reflect estimated historical performance; trainer and jockey grades score in-the-money percentages. Grading scale: A = elite • B = above average • C = average • D = below average • F = poor • — = no data |
||
| Pick Pony AI Rating | B | C |
| Pace Trip Longshot | — | — |
| Connections Longshot | — | — |
| Situational Longshot | — | — |
| Speed | D | C |
| Early Pace | D | C |
| Mid Pace | C | C |
| Late Pace | B | B |
| Finish Pos | D | F |
| Dirt Speed | B | C |
| Turf Speed | C | B |
| Distance Speed | C | B |
| Trainer Effectiveness | B | B |
| Jockey Effectiveness | A | B |
| 3rd Party Ratings | F | D |
| Recent
Performance analysis from the horse's recent races, weighted to reflect current form. Sprint and Route FPS (Foot Per Second) measure pace efficiency over the horse's recent sprints and routes respectively. Grading scale: A = elite • B = above average • C = average • D = below average • F = poor • — = no data |
||
| Speed | D | C |
| Early Pace | F | C |
| Mid Pace | C | C |
| Late Pace | A | B |
| Sprint FPS | C | D |
| Route FPS | C | D |
| Trainer Effectiveness | B | B |
| Jockey Effectiveness | A | B |
| 3rd Party Ratings | F | D |
| Predictions
AI-generated projections for the upcoming race, derived from prior AI analysis for speed and pace trends, surface and distance suitability, and current conditions. Grading scale: A = elite • B = above average • C = average • D = below average • F = poor • — = no data |
||
| Speed | C | C |
| Early Pace | D | B |
| Mid Pace | C | C |
| Late Pace | C | C |
Chart Guide (2.0.41)
What it shows: This horse’s recent races, one bubble per race, plotted by its AI speed figure against the class par for today’s race (the dashed line).
What to look for: Recent bubbles at or above the dashed line, a trend line angled up, and a narrow shaded band (steady form). Check whether the good runs came on today’s surface and distance.
- Bubbles
- Color = surface: green (turf), brown (dirt), blue (synthetic)
- Top number = finishing position; bottom number in parentheses = starting post position
- Height above line = beaten lengths — closer means a smaller margin
- Border = track conditions: green (FST/GD/FM), yellow (WF/SL/YLD), red (SY/MY/FRZ/SFT/HVY)
- Connecting Line
- Solid = good conditions; dashed = bad conditions
- Line Symbol
- ▲ Triangle = sprint (7f or less); ● Circle = route (more than 7f)
- Days Between Races
- Small number above each bubble (e.g. 19d) = days since the previous race — helps spot freshness, layoffs, and tight scheduling.
- Shaded Band (Bollinger)
- Highlights volatility — a wider band means more variation in recent performance
- Performance Trend
- Straight line showing the overall performance direction — angled up = improving, angled down = declining
- Dashed Reference Line
- AI Opponent = AI analysis class-level par for the race
AI Model History Guide
What it shows: How our AI models rated this horse in each of its recent races, compared with how they rate today’s field (the dashed lines).
What to look for: Lines that are rising and sit above the dashed field averages — the models have liked this horse and still do. Falling lines, or lines below the dashed ones, mean the models are cooling on it.
- Lines
- Each solid line shows this horse’s model score over its last 10 races: blue = Mod1, green = Mod2, amber = Mod3.
- Dashed Lines
- Dashed lines represent the current race’s field average for each model — a score below the dashed line indicates the horse ranked below average in this model’s assessment.
- Higher is Stronger
- All three model scores are 0–100: a higher number means the model rates this horse more favorably among the field.
Mod1(W): 82 (1/8) Mod2(W): 75 (2/8) Mod3(W): 79 (3/8) Mod1-LS: 55 (6/8) Win Prob: 18.4% Value Score: 1.35 ★
Performance vs. Peers Guide
What it shows: Each horse’s career, last-3-race and last-race performance side by side, against the field average.
What to look for: Horses above the field average whose last race is green (better than their average) and whose trend line rises — improving form. Red last races and falling lines point to declining form.
- Bars (per post)
- Blue = avg career performance • Amber = avg last 3 races • Green = last race (improved vs. avg) • Red = last race (declined vs. avg)
- Trend Line
- Angled line above the bars: rising = improving form • falling = declining form.
- Horizontal Line
- Field average — the mean career performance of all horses in this race.
- Color Circles
- Standard post-position colors below each lane — same as the Total Pace chart.
- Border
- Thicker border = this horse’s post position.
Figure Comparison
What it shows: This horse’s ratings, speed figures and pace figures next to every other horse in the race.
What to look for: Where this horse (the darker column) leads the field or falls short. Strong ratings plus strong recent speed make a contender; recent speed well above career speed suggests improving form.
- Rating
- The three Pick Pony algorithm ratings (Algo 1, Algo 2, Algo 3) that make up the overall PP AI Rating — higher is a stronger contender rating.
- Speed
- Career average speed, recent 3-race average, and last-race speed figure — spot horses in improving or declining form.
- Pace
- Average Early (E1), Mid (E2), and Stretch (LP) pace figures — reveals pace-setters vs. closers vs. all-the-way types.
- This horse
- The horse whose stats card is open is highlighted with a darker column background.
Winning Profiles
What it shows: Each horse’s win rate and in-the-money rate over its last 10 starts, one dot per horse.
What to look for: Dots in the top-right are consistent winners. Top-left horses often finish in the money but rarely win — better for place and show bets or underneath in exotics. Bottom-left horses rarely finish well.
- Axes
- X: Win % from last 10 starts — Y: In-the-money % (top-3 finishes) from last 10 starts.
- Quadrants
- Consistent Winners (top-right): high win & ITM — reliable performers.
Place Threats (top-left): boards often but doesn’t win often — good exacta/trifecta angles.
Streaky (bottom-right): wins occasionally, misses the board often — all-or-nothing.
Developing (bottom-left): still finding form — longshot territory. - Reference Lines
- Dashed lines mark field averages. Dots to the right win more; dots higher board more.
- This horse
- Highlighted with a gold border and larger dot.
AI Model Comparison
What it shows: All AI model scores for every horse in the race, grouped by what each model is trained to find.
What to look for: The horse leading the green winner models is the models’ likely winner. A horse that stands out in the red longshot models but not the green ones is a longshot the models think is underrated.
- Winner Models (green)
- Mod1(W), Mod2(W), and Mod3(W) trained to predict race winners. Higher score = stronger contender.
- Longshot Models (red)
- Mod1-LS, Mod2-LS, and Mod3-LS trained to find high-value longshots. Higher score = stronger longshot candidate.
- Form Model (blue)
- Mod4 sequence model trained on recent form patterns. Higher score = stronger recent form profile.
- This horse
- Highlighted with a darker column background.
Race Pace Simulation Guide
What it shows: A simulated run of today’s race, based on each horse’s running style, post position and the expected pace.
What to look for: Who gets the lead, who gets boxed in, and who is gaining at the finish. Move the track-bias slider to see how the predicted order changes on a speed-favouring or closer-favouring track.
- Slider
- Drag left→right to advance from gate to finish. Drag all the way back to reset the race.
- Predicted Finish Order
- Factors in contested pace burn, each horse’s effort curve (peaked-early vs. peaked-late), and wide trip cost from outside posts. Updated live when Track Bias changes.
- Pace Scenario
- Lone Speed: single E horse likely rates and holds. Contested: two E horses burn each other — closers benefit. Hot Pace: speed meltdown, deep closers thrive. Soft: no early speed, moderate fractions throughout.
- Track Bias
- Slider below canvas. −2 = strong closer/wet bias; +2 = strong speed/rail bias. Recomputes the predicted finish order.
- Boxed Indicator
- Dashed orange ring = horse is surrounded (rival ahead, rival behind, wall outside). In a real race this horse must find a clear path to run.
- Running Styles
- E/EE = early speed (rushes to rail). P = presser (stalks the pace). S = stalker. SS = slow starter / closer.
| Stat | vs. Current Card | vs. All Horses |
|---|---|---|
| Averages
Career-average metrics across all AI race analysis. Performance and pace averages reflect estimated historical performance; trainer and jockey grades score in-the-money percentages. Grading scale: A = elite • B = above average • C = average • D = below average • F = poor • — = no data |
||
| Pick Pony AI Rating | D | D |
| Pace Trip Longshot | — | — |
| Connections Longshot | — | — |
| Situational Longshot | — | — |
| Speed | D | F |
| Early Pace | D | D |
| Mid Pace | D | D |
| Late Pace | D | D |
| Finish Pos | C | A |
| Dirt Speed | D | D |
| Turf Speed | D | D |
| Distance Speed | D | C |
| Trainer Effectiveness | F | F |
| Jockey Effectiveness | A | A |
| 3rd Party Ratings | C | D |
| Recent
Performance analysis from the horse's recent races, weighted to reflect current form. Sprint and Route FPS (Foot Per Second) measure pace efficiency over the horse's recent sprints and routes respectively. Grading scale: A = elite • B = above average • C = average • D = below average • F = poor • — = no data |
||
| Speed | C | F |
| Early Pace | C | C |
| Mid Pace | C | D |
| Late Pace | C | D |
| Sprint FPS | D | D |
| Route FPS | B | C |
| Trainer Effectiveness | F | F |
| Jockey Effectiveness | A | A |
| 3rd Party Ratings | C | D |
| Predictions
AI-generated projections for the upcoming race, derived from prior AI analysis for speed and pace trends, surface and distance suitability, and current conditions. Grading scale: A = elite • B = above average • C = average • D = below average • F = poor • — = no data |
||
| Speed | D | F |
| Early Pace | D | C |
| Mid Pace | D | D |
| Late Pace | C | C |
Chart Guide (2.0.41)
What it shows: This horse’s recent races, one bubble per race, plotted by its AI speed figure against the class par for today’s race (the dashed line).
What to look for: Recent bubbles at or above the dashed line, a trend line angled up, and a narrow shaded band (steady form). Check whether the good runs came on today’s surface and distance.
- Bubbles
- Color = surface: green (turf), brown (dirt), blue (synthetic)
- Top number = finishing position; bottom number in parentheses = starting post position
- Height above line = beaten lengths — closer means a smaller margin
- Border = track conditions: green (FST/GD/FM), yellow (WF/SL/YLD), red (SY/MY/FRZ/SFT/HVY)
- Connecting Line
- Solid = good conditions; dashed = bad conditions
- Line Symbol
- ▲ Triangle = sprint (7f or less); ● Circle = route (more than 7f)
- Days Between Races
- Small number above each bubble (e.g. 19d) = days since the previous race — helps spot freshness, layoffs, and tight scheduling.
- Shaded Band (Bollinger)
- Highlights volatility — a wider band means more variation in recent performance
- Performance Trend
- Straight line showing the overall performance direction — angled up = improving, angled down = declining
- Dashed Reference Line
- AI Opponent = AI analysis class-level par for the race
AI Model History Guide
What it shows: How our AI models rated this horse in each of its recent races, compared with how they rate today’s field (the dashed lines).
What to look for: Lines that are rising and sit above the dashed field averages — the models have liked this horse and still do. Falling lines, or lines below the dashed ones, mean the models are cooling on it.
- Lines
- Each solid line shows this horse’s model score over its last 10 races: blue = Mod1, green = Mod2, amber = Mod3.
- Dashed Lines
- Dashed lines represent the current race’s field average for each model — a score below the dashed line indicates the horse ranked below average in this model’s assessment.
- Higher is Stronger
- All three model scores are 0–100: a higher number means the model rates this horse more favorably among the field.
Mod1(W): 82 (1/8) Mod2(W): 75 (2/8) Mod3(W): 79 (3/8) Mod1-LS: 55 (6/8) Win Prob: 18.4% Value Score: 1.35 ★
Performance vs. Peers Guide
What it shows: Each horse’s career, last-3-race and last-race performance side by side, against the field average.
What to look for: Horses above the field average whose last race is green (better than their average) and whose trend line rises — improving form. Red last races and falling lines point to declining form.
- Bars (per post)
- Blue = avg career performance • Amber = avg last 3 races • Green = last race (improved vs. avg) • Red = last race (declined vs. avg)
- Trend Line
- Angled line above the bars: rising = improving form • falling = declining form.
- Horizontal Line
- Field average — the mean career performance of all horses in this race.
- Color Circles
- Standard post-position colors below each lane — same as the Total Pace chart.
- Border
- Thicker border = this horse’s post position.
Figure Comparison
What it shows: This horse’s ratings, speed figures and pace figures next to every other horse in the race.
What to look for: Where this horse (the darker column) leads the field or falls short. Strong ratings plus strong recent speed make a contender; recent speed well above career speed suggests improving form.
- Rating
- The three Pick Pony algorithm ratings (Algo 1, Algo 2, Algo 3) that make up the overall PP AI Rating — higher is a stronger contender rating.
- Speed
- Career average speed, recent 3-race average, and last-race speed figure — spot horses in improving or declining form.
- Pace
- Average Early (E1), Mid (E2), and Stretch (LP) pace figures — reveals pace-setters vs. closers vs. all-the-way types.
- This horse
- The horse whose stats card is open is highlighted with a darker column background.
Winning Profiles
What it shows: Each horse’s win rate and in-the-money rate over its last 10 starts, one dot per horse.
What to look for: Dots in the top-right are consistent winners. Top-left horses often finish in the money but rarely win — better for place and show bets or underneath in exotics. Bottom-left horses rarely finish well.
- Axes
- X: Win % from last 10 starts — Y: In-the-money % (top-3 finishes) from last 10 starts.
- Quadrants
- Consistent Winners (top-right): high win & ITM — reliable performers.
Place Threats (top-left): boards often but doesn’t win often — good exacta/trifecta angles.
Streaky (bottom-right): wins occasionally, misses the board often — all-or-nothing.
Developing (bottom-left): still finding form — longshot territory. - Reference Lines
- Dashed lines mark field averages. Dots to the right win more; dots higher board more.
- This horse
- Highlighted with a gold border and larger dot.
AI Model Comparison
What it shows: All AI model scores for every horse in the race, grouped by what each model is trained to find.
What to look for: The horse leading the green winner models is the models’ likely winner. A horse that stands out in the red longshot models but not the green ones is a longshot the models think is underrated.
- Winner Models (green)
- Mod1(W), Mod2(W), and Mod3(W) trained to predict race winners. Higher score = stronger contender.
- Longshot Models (red)
- Mod1-LS, Mod2-LS, and Mod3-LS trained to find high-value longshots. Higher score = stronger longshot candidate.
- Form Model (blue)
- Mod4 sequence model trained on recent form patterns. Higher score = stronger recent form profile.
- This horse
- Highlighted with a darker column background.
Race Pace Simulation Guide
What it shows: A simulated run of today’s race, based on each horse’s running style, post position and the expected pace.
What to look for: Who gets the lead, who gets boxed in, and who is gaining at the finish. Move the track-bias slider to see how the predicted order changes on a speed-favouring or closer-favouring track.
- Slider
- Drag left→right to advance from gate to finish. Drag all the way back to reset the race.
- Predicted Finish Order
- Factors in contested pace burn, each horse’s effort curve (peaked-early vs. peaked-late), and wide trip cost from outside posts. Updated live when Track Bias changes.
- Pace Scenario
- Lone Speed: single E horse likely rates and holds. Contested: two E horses burn each other — closers benefit. Hot Pace: speed meltdown, deep closers thrive. Soft: no early speed, moderate fractions throughout.
- Track Bias
- Slider below canvas. −2 = strong closer/wet bias; +2 = strong speed/rail bias. Recomputes the predicted finish order.
- Boxed Indicator
- Dashed orange ring = horse is surrounded (rival ahead, rival behind, wall outside). In a real race this horse must find a clear path to run.
- Running Styles
- E/EE = early speed (rushes to rail). P = presser (stalks the pace). S = stalker. SS = slow starter / closer.
| Stat | vs. Current Card | vs. All Horses |
|---|---|---|
| Averages
Career-average metrics across all AI race analysis. Performance and pace averages reflect estimated historical performance; trainer and jockey grades score in-the-money percentages. Grading scale: A = elite • B = above average • C = average • D = below average • F = poor • — = no data |
||
| Pick Pony AI Rating | D | D |
| Pace Trip Longshot | — | — |
| Connections Longshot | — | — |
| Situational Longshot | — | — |
| Speed | A | A |
| Early Pace | A | A |
| Mid Pace | F | F |
| Late Pace | A | B |
| Finish Pos | B | B |
| Dirt Speed | D | F |
| Turf Speed | A | A |
| Distance Speed | A | A |
| Trainer Effectiveness | A | A |
| Jockey Effectiveness | B | C |
| 3rd Party Ratings | A | A |
| Recent
Performance analysis from the horse's recent races, weighted to reflect current form. Sprint and Route FPS (Foot Per Second) measure pace efficiency over the horse's recent sprints and routes respectively. Grading scale: A = elite • B = above average • C = average • D = below average • F = poor • — = no data |
||
| Speed | A | A |
| Early Pace | A | A |
| Mid Pace | F | F |
| Late Pace | A | B |
| Sprint FPS | F | F |
| Route FPS | F | F |
| Trainer Effectiveness | A | A |
| Jockey Effectiveness | B | C |
| 3rd Party Ratings | A | A |
| Predictions
AI-generated projections for the upcoming race, derived from prior AI analysis for speed and pace trends, surface and distance suitability, and current conditions. Grading scale: A = elite • B = above average • C = average • D = below average • F = poor • — = no data |
||
| Speed | A | A |
| Early Pace | B | A |
| Mid Pace | D | F |
| Late Pace | C | C |
Chart Guide (2.0.41)
What it shows: This horse’s recent races, one bubble per race, plotted by its AI speed figure against the class par for today’s race (the dashed line).
What to look for: Recent bubbles at or above the dashed line, a trend line angled up, and a narrow shaded band (steady form). Check whether the good runs came on today’s surface and distance.
- Bubbles
- Color = surface: green (turf), brown (dirt), blue (synthetic)
- Top number = finishing position; bottom number in parentheses = starting post position
- Height above line = beaten lengths — closer means a smaller margin
- Border = track conditions: green (FST/GD/FM), yellow (WF/SL/YLD), red (SY/MY/FRZ/SFT/HVY)
- Connecting Line
- Solid = good conditions; dashed = bad conditions
- Line Symbol
- ▲ Triangle = sprint (7f or less); ● Circle = route (more than 7f)
- Days Between Races
- Small number above each bubble (e.g. 19d) = days since the previous race — helps spot freshness, layoffs, and tight scheduling.
- Shaded Band (Bollinger)
- Highlights volatility — a wider band means more variation in recent performance
- Performance Trend
- Straight line showing the overall performance direction — angled up = improving, angled down = declining
- Dashed Reference Line
- AI Opponent = AI analysis class-level par for the race
AI Model History Guide
What it shows: How our AI models rated this horse in each of its recent races, compared with how they rate today’s field (the dashed lines).
What to look for: Lines that are rising and sit above the dashed field averages — the models have liked this horse and still do. Falling lines, or lines below the dashed ones, mean the models are cooling on it.
- Lines
- Each solid line shows this horse’s model score over its last 10 races: blue = Mod1, green = Mod2, amber = Mod3.
- Dashed Lines
- Dashed lines represent the current race’s field average for each model — a score below the dashed line indicates the horse ranked below average in this model’s assessment.
- Higher is Stronger
- All three model scores are 0–100: a higher number means the model rates this horse more favorably among the field.
Mod1(W): 82 (1/8) Mod2(W): 75 (2/8) Mod3(W): 79 (3/8) Mod1-LS: 55 (6/8) Win Prob: 18.4% Value Score: 1.35 ★
Performance vs. Peers Guide
What it shows: Each horse’s career, last-3-race and last-race performance side by side, against the field average.
What to look for: Horses above the field average whose last race is green (better than their average) and whose trend line rises — improving form. Red last races and falling lines point to declining form.
- Bars (per post)
- Blue = avg career performance • Amber = avg last 3 races • Green = last race (improved vs. avg) • Red = last race (declined vs. avg)
- Trend Line
- Angled line above the bars: rising = improving form • falling = declining form.
- Horizontal Line
- Field average — the mean career performance of all horses in this race.
- Color Circles
- Standard post-position colors below each lane — same as the Total Pace chart.
- Border
- Thicker border = this horse’s post position.
Figure Comparison
What it shows: This horse’s ratings, speed figures and pace figures next to every other horse in the race.
What to look for: Where this horse (the darker column) leads the field or falls short. Strong ratings plus strong recent speed make a contender; recent speed well above career speed suggests improving form.
- Rating
- The three Pick Pony algorithm ratings (Algo 1, Algo 2, Algo 3) that make up the overall PP AI Rating — higher is a stronger contender rating.
- Speed
- Career average speed, recent 3-race average, and last-race speed figure — spot horses in improving or declining form.
- Pace
- Average Early (E1), Mid (E2), and Stretch (LP) pace figures — reveals pace-setters vs. closers vs. all-the-way types.
- This horse
- The horse whose stats card is open is highlighted with a darker column background.
Winning Profiles
What it shows: Each horse’s win rate and in-the-money rate over its last 10 starts, one dot per horse.
What to look for: Dots in the top-right are consistent winners. Top-left horses often finish in the money but rarely win — better for place and show bets or underneath in exotics. Bottom-left horses rarely finish well.
- Axes
- X: Win % from last 10 starts — Y: In-the-money % (top-3 finishes) from last 10 starts.
- Quadrants
- Consistent Winners (top-right): high win & ITM — reliable performers.
Place Threats (top-left): boards often but doesn’t win often — good exacta/trifecta angles.
Streaky (bottom-right): wins occasionally, misses the board often — all-or-nothing.
Developing (bottom-left): still finding form — longshot territory. - Reference Lines
- Dashed lines mark field averages. Dots to the right win more; dots higher board more.
- This horse
- Highlighted with a gold border and larger dot.
AI Model Comparison
What it shows: All AI model scores for every horse in the race, grouped by what each model is trained to find.
What to look for: The horse leading the green winner models is the models’ likely winner. A horse that stands out in the red longshot models but not the green ones is a longshot the models think is underrated.
- Winner Models (green)
- Mod1(W), Mod2(W), and Mod3(W) trained to predict race winners. Higher score = stronger contender.
- Longshot Models (red)
- Mod1-LS, Mod2-LS, and Mod3-LS trained to find high-value longshots. Higher score = stronger longshot candidate.
- Form Model (blue)
- Mod4 sequence model trained on recent form patterns. Higher score = stronger recent form profile.
- This horse
- Highlighted with a darker column background.
Race Pace Simulation Guide
What it shows: A simulated run of today’s race, based on each horse’s running style, post position and the expected pace.
What to look for: Who gets the lead, who gets boxed in, and who is gaining at the finish. Move the track-bias slider to see how the predicted order changes on a speed-favouring or closer-favouring track.
- Slider
- Drag left→right to advance from gate to finish. Drag all the way back to reset the race.
- Predicted Finish Order
- Factors in contested pace burn, each horse’s effort curve (peaked-early vs. peaked-late), and wide trip cost from outside posts. Updated live when Track Bias changes.
- Pace Scenario
- Lone Speed: single E horse likely rates and holds. Contested: two E horses burn each other — closers benefit. Hot Pace: speed meltdown, deep closers thrive. Soft: no early speed, moderate fractions throughout.
- Track Bias
- Slider below canvas. −2 = strong closer/wet bias; +2 = strong speed/rail bias. Recomputes the predicted finish order.
- Boxed Indicator
- Dashed orange ring = horse is surrounded (rival ahead, rival behind, wall outside). In a real race this horse must find a clear path to run.
- Running Styles
- E/EE = early speed (rushes to rail). P = presser (stalks the pace). S = stalker. SS = slow starter / closer.
| Stat | vs. Current Card | vs. All Horses |
|---|---|---|
| Averages
Career-average metrics across all AI race analysis. Performance and pace averages reflect estimated historical performance; trainer and jockey grades score in-the-money percentages. Grading scale: A = elite • B = above average • C = average • D = below average • F = poor • — = no data |
||
| Pick Pony AI Rating | C | C |
| Pace Trip Longshot | — | — |
| Connections Longshot | — | — |
| Situational Longshot | — | — |
| Speed | B | B |
| Early Pace | F | C |
| Mid Pace | B | B |
| Late Pace | C | B |
| Finish Pos | C | D |
| Dirt Speed | A | B |
| Turf Speed | B | A |
| Distance Speed | D | F |
| Trainer Effectiveness | C | C |
| Jockey Effectiveness | A | B |
| 3rd Party Ratings | B | B |
| Recent
Performance analysis from the horse's recent races, weighted to reflect current form. Sprint and Route FPS (Foot Per Second) measure pace efficiency over the horse's recent sprints and routes respectively. Grading scale: A = elite • B = above average • C = average • D = below average • F = poor • — = no data |
||
| Speed | B | B |
| Early Pace | D | C |
| Mid Pace | B | B |
| Late Pace | C | C |
| Sprint FPS | C | D |
| Route FPS | B | B |
| Trainer Effectiveness | C | C |
| Jockey Effectiveness | A | B |
| 3rd Party Ratings | B | B |
| Predictions
AI-generated projections for the upcoming race, derived from prior AI analysis for speed and pace trends, surface and distance suitability, and current conditions. Grading scale: A = elite • B = above average • C = average • D = below average • F = poor • — = no data |
||
| Speed | C | B |
| Early Pace | F | C |
| Mid Pace | B | B |
| Late Pace | C | C |
Chart Guide (2.0.41)
What it shows: This horse’s recent races, one bubble per race, plotted by its AI speed figure against the class par for today’s race (the dashed line).
What to look for: Recent bubbles at or above the dashed line, a trend line angled up, and a narrow shaded band (steady form). Check whether the good runs came on today’s surface and distance.
- Bubbles
- Color = surface: green (turf), brown (dirt), blue (synthetic)
- Top number = finishing position; bottom number in parentheses = starting post position
- Height above line = beaten lengths — closer means a smaller margin
- Border = track conditions: green (FST/GD/FM), yellow (WF/SL/YLD), red (SY/MY/FRZ/SFT/HVY)
- Connecting Line
- Solid = good conditions; dashed = bad conditions
- Line Symbol
- ▲ Triangle = sprint (7f or less); ● Circle = route (more than 7f)
- Days Between Races
- Small number above each bubble (e.g. 19d) = days since the previous race — helps spot freshness, layoffs, and tight scheduling.
- Shaded Band (Bollinger)
- Highlights volatility — a wider band means more variation in recent performance
- Performance Trend
- Straight line showing the overall performance direction — angled up = improving, angled down = declining
- Dashed Reference Line
- AI Opponent = AI analysis class-level par for the race
AI Model History Guide
What it shows: How our AI models rated this horse in each of its recent races, compared with how they rate today’s field (the dashed lines).
What to look for: Lines that are rising and sit above the dashed field averages — the models have liked this horse and still do. Falling lines, or lines below the dashed ones, mean the models are cooling on it.
- Lines
- Each solid line shows this horse’s model score over its last 10 races: blue = Mod1, green = Mod2, amber = Mod3.
- Dashed Lines
- Dashed lines represent the current race’s field average for each model — a score below the dashed line indicates the horse ranked below average in this model’s assessment.
- Higher is Stronger
- All three model scores are 0–100: a higher number means the model rates this horse more favorably among the field.
Mod1(W): 82 (1/8) Mod2(W): 75 (2/8) Mod3(W): 79 (3/8) Mod1-LS: 55 (6/8) Win Prob: 18.4% Value Score: 1.35 ★
Performance vs. Peers Guide
What it shows: Each horse’s career, last-3-race and last-race performance side by side, against the field average.
What to look for: Horses above the field average whose last race is green (better than their average) and whose trend line rises — improving form. Red last races and falling lines point to declining form.
- Bars (per post)
- Blue = avg career performance • Amber = avg last 3 races • Green = last race (improved vs. avg) • Red = last race (declined vs. avg)
- Trend Line
- Angled line above the bars: rising = improving form • falling = declining form.
- Horizontal Line
- Field average — the mean career performance of all horses in this race.
- Color Circles
- Standard post-position colors below each lane — same as the Total Pace chart.
- Border
- Thicker border = this horse’s post position.
Figure Comparison
What it shows: This horse’s ratings, speed figures and pace figures next to every other horse in the race.
What to look for: Where this horse (the darker column) leads the field or falls short. Strong ratings plus strong recent speed make a contender; recent speed well above career speed suggests improving form.
- Rating
- The three Pick Pony algorithm ratings (Algo 1, Algo 2, Algo 3) that make up the overall PP AI Rating — higher is a stronger contender rating.
- Speed
- Career average speed, recent 3-race average, and last-race speed figure — spot horses in improving or declining form.
- Pace
- Average Early (E1), Mid (E2), and Stretch (LP) pace figures — reveals pace-setters vs. closers vs. all-the-way types.
- This horse
- The horse whose stats card is open is highlighted with a darker column background.
Winning Profiles
What it shows: Each horse’s win rate and in-the-money rate over its last 10 starts, one dot per horse.
What to look for: Dots in the top-right are consistent winners. Top-left horses often finish in the money but rarely win — better for place and show bets or underneath in exotics. Bottom-left horses rarely finish well.
- Axes
- X: Win % from last 10 starts — Y: In-the-money % (top-3 finishes) from last 10 starts.
- Quadrants
- Consistent Winners (top-right): high win & ITM — reliable performers.
Place Threats (top-left): boards often but doesn’t win often — good exacta/trifecta angles.
Streaky (bottom-right): wins occasionally, misses the board often — all-or-nothing.
Developing (bottom-left): still finding form — longshot territory. - Reference Lines
- Dashed lines mark field averages. Dots to the right win more; dots higher board more.
- This horse
- Highlighted with a gold border and larger dot.
AI Model Comparison
What it shows: All AI model scores for every horse in the race, grouped by what each model is trained to find.
What to look for: The horse leading the green winner models is the models’ likely winner. A horse that stands out in the red longshot models but not the green ones is a longshot the models think is underrated.
- Winner Models (green)
- Mod1(W), Mod2(W), and Mod3(W) trained to predict race winners. Higher score = stronger contender.
- Longshot Models (red)
- Mod1-LS, Mod2-LS, and Mod3-LS trained to find high-value longshots. Higher score = stronger longshot candidate.
- Form Model (blue)
- Mod4 sequence model trained on recent form patterns. Higher score = stronger recent form profile.
- This horse
- Highlighted with a darker column background.
Race Pace Simulation Guide
What it shows: A simulated run of today’s race, based on each horse’s running style, post position and the expected pace.
What to look for: Who gets the lead, who gets boxed in, and who is gaining at the finish. Move the track-bias slider to see how the predicted order changes on a speed-favouring or closer-favouring track.
- Slider
- Drag left→right to advance from gate to finish. Drag all the way back to reset the race.
- Predicted Finish Order
- Factors in contested pace burn, each horse’s effort curve (peaked-early vs. peaked-late), and wide trip cost from outside posts. Updated live when Track Bias changes.
- Pace Scenario
- Lone Speed: single E horse likely rates and holds. Contested: two E horses burn each other — closers benefit. Hot Pace: speed meltdown, deep closers thrive. Soft: no early speed, moderate fractions throughout.
- Track Bias
- Slider below canvas. −2 = strong closer/wet bias; +2 = strong speed/rail bias. Recomputes the predicted finish order.
- Boxed Indicator
- Dashed orange ring = horse is surrounded (rival ahead, rival behind, wall outside). In a real race this horse must find a clear path to run.
- Running Styles
- E/EE = early speed (rushes to rail). P = presser (stalks the pace). S = stalker. SS = slow starter / closer.
| Stat | vs. Current Card | vs. All Horses |
|---|---|---|
| Averages
Career-average metrics across all AI race analysis. Performance and pace averages reflect estimated historical performance; trainer and jockey grades score in-the-money percentages. Grading scale: A = elite • B = above average • C = average • D = below average • F = poor • — = no data |
||
| Pick Pony AI Rating | B | B |
| Pace Trip Longshot | — | — |
| Connections Longshot | — | — |
| Situational Longshot | — | — |
| Speed | D | F |
| Early Pace | D | D |
| Mid Pace | F | D |
| Late Pace | A | C |
| Finish Pos | D | F |
| Dirt Speed | D | D |
| Turf Speed | F | D |
| Distance Speed | A | C |
| Trainer Effectiveness | D | D |
| Jockey Effectiveness | A | B |
| 3rd Party Ratings | C | D |
| Recent
Performance analysis from the horse's recent races, weighted to reflect current form. Sprint and Route FPS (Foot Per Second) measure pace efficiency over the horse's recent sprints and routes respectively. Grading scale: A = elite • B = above average • C = average • D = below average • F = poor • — = no data |
||
| Speed | C | D |
| Early Pace | D | D |
| Mid Pace | D | D |
| Late Pace | A | C |
| Sprint FPS | D | D |
| Route FPS | D | D |
| Trainer Effectiveness | D | D |
| Jockey Effectiveness | A | B |
| 3rd Party Ratings | C | D |
| Predictions
AI-generated projections for the upcoming race, derived from prior AI analysis for speed and pace trends, surface and distance suitability, and current conditions. Grading scale: A = elite • B = above average • C = average • D = below average • F = poor • — = no data |
||
| Speed | D | F |
| Early Pace | D | D |
| Mid Pace | D | D |
| Late Pace | C | C |
Chart Guide (2.0.41)
What it shows: This horse’s recent races, one bubble per race, plotted by its AI speed figure against the class par for today’s race (the dashed line).
What to look for: Recent bubbles at or above the dashed line, a trend line angled up, and a narrow shaded band (steady form). Check whether the good runs came on today’s surface and distance.
- Bubbles
- Color = surface: green (turf), brown (dirt), blue (synthetic)
- Top number = finishing position; bottom number in parentheses = starting post position
- Height above line = beaten lengths — closer means a smaller margin
- Border = track conditions: green (FST/GD/FM), yellow (WF/SL/YLD), red (SY/MY/FRZ/SFT/HVY)
- Connecting Line
- Solid = good conditions; dashed = bad conditions
- Line Symbol
- ▲ Triangle = sprint (7f or less); ● Circle = route (more than 7f)
- Days Between Races
- Small number above each bubble (e.g. 19d) = days since the previous race — helps spot freshness, layoffs, and tight scheduling.
- Shaded Band (Bollinger)
- Highlights volatility — a wider band means more variation in recent performance
- Performance Trend
- Straight line showing the overall performance direction — angled up = improving, angled down = declining
- Dashed Reference Line
- AI Opponent = AI analysis class-level par for the race
AI Model History Guide
What it shows: How our AI models rated this horse in each of its recent races, compared with how they rate today’s field (the dashed lines).
What to look for: Lines that are rising and sit above the dashed field averages — the models have liked this horse and still do. Falling lines, or lines below the dashed ones, mean the models are cooling on it.
- Lines
- Each solid line shows this horse’s model score over its last 10 races: blue = Mod1, green = Mod2, amber = Mod3.
- Dashed Lines
- Dashed lines represent the current race’s field average for each model — a score below the dashed line indicates the horse ranked below average in this model’s assessment.
- Higher is Stronger
- All three model scores are 0–100: a higher number means the model rates this horse more favorably among the field.
Mod1(W): 82 (1/8) Mod2(W): 75 (2/8) Mod3(W): 79 (3/8) Mod1-LS: 55 (6/8) Win Prob: 18.4% Value Score: 1.35 ★
Performance vs. Peers Guide
What it shows: Each horse’s career, last-3-race and last-race performance side by side, against the field average.
What to look for: Horses above the field average whose last race is green (better than their average) and whose trend line rises — improving form. Red last races and falling lines point to declining form.
- Bars (per post)
- Blue = avg career performance • Amber = avg last 3 races • Green = last race (improved vs. avg) • Red = last race (declined vs. avg)
- Trend Line
- Angled line above the bars: rising = improving form • falling = declining form.
- Horizontal Line
- Field average — the mean career performance of all horses in this race.
- Color Circles
- Standard post-position colors below each lane — same as the Total Pace chart.
- Border
- Thicker border = this horse’s post position.
Figure Comparison
What it shows: This horse’s ratings, speed figures and pace figures next to every other horse in the race.
What to look for: Where this horse (the darker column) leads the field or falls short. Strong ratings plus strong recent speed make a contender; recent speed well above career speed suggests improving form.
- Rating
- The three Pick Pony algorithm ratings (Algo 1, Algo 2, Algo 3) that make up the overall PP AI Rating — higher is a stronger contender rating.
- Speed
- Career average speed, recent 3-race average, and last-race speed figure — spot horses in improving or declining form.
- Pace
- Average Early (E1), Mid (E2), and Stretch (LP) pace figures — reveals pace-setters vs. closers vs. all-the-way types.
- This horse
- The horse whose stats card is open is highlighted with a darker column background.
Winning Profiles
What it shows: Each horse’s win rate and in-the-money rate over its last 10 starts, one dot per horse.
What to look for: Dots in the top-right are consistent winners. Top-left horses often finish in the money but rarely win — better for place and show bets or underneath in exotics. Bottom-left horses rarely finish well.
- Axes
- X: Win % from last 10 starts — Y: In-the-money % (top-3 finishes) from last 10 starts.
- Quadrants
- Consistent Winners (top-right): high win & ITM — reliable performers.
Place Threats (top-left): boards often but doesn’t win often — good exacta/trifecta angles.
Streaky (bottom-right): wins occasionally, misses the board often — all-or-nothing.
Developing (bottom-left): still finding form — longshot territory. - Reference Lines
- Dashed lines mark field averages. Dots to the right win more; dots higher board more.
- This horse
- Highlighted with a gold border and larger dot.
AI Model Comparison
What it shows: All AI model scores for every horse in the race, grouped by what each model is trained to find.
What to look for: The horse leading the green winner models is the models’ likely winner. A horse that stands out in the red longshot models but not the green ones is a longshot the models think is underrated.
- Winner Models (green)
- Mod1(W), Mod2(W), and Mod3(W) trained to predict race winners. Higher score = stronger contender.
- Longshot Models (red)
- Mod1-LS, Mod2-LS, and Mod3-LS trained to find high-value longshots. Higher score = stronger longshot candidate.
- Form Model (blue)
- Mod4 sequence model trained on recent form patterns. Higher score = stronger recent form profile.
- This horse
- Highlighted with a darker column background.
Race Pace Simulation Guide
What it shows: A simulated run of today’s race, based on each horse’s running style, post position and the expected pace.
What to look for: Who gets the lead, who gets boxed in, and who is gaining at the finish. Move the track-bias slider to see how the predicted order changes on a speed-favouring or closer-favouring track.
- Slider
- Drag left→right to advance from gate to finish. Drag all the way back to reset the race.
- Predicted Finish Order
- Factors in contested pace burn, each horse’s effort curve (peaked-early vs. peaked-late), and wide trip cost from outside posts. Updated live when Track Bias changes.
- Pace Scenario
- Lone Speed: single E horse likely rates and holds. Contested: two E horses burn each other — closers benefit. Hot Pace: speed meltdown, deep closers thrive. Soft: no early speed, moderate fractions throughout.
- Track Bias
- Slider below canvas. −2 = strong closer/wet bias; +2 = strong speed/rail bias. Recomputes the predicted finish order.
- Boxed Indicator
- Dashed orange ring = horse is surrounded (rival ahead, rival behind, wall outside). In a real race this horse must find a clear path to run.
- Running Styles
- E/EE = early speed (rushes to rail). P = presser (stalks the pace). S = stalker. SS = slow starter / closer.
| Stat | vs. Current Card | vs. All Horses |
|---|---|---|
| Averages
Career-average metrics across all AI race analysis. Performance and pace averages reflect estimated historical performance; trainer and jockey grades score in-the-money percentages. Grading scale: A = elite • B = above average • C = average • D = below average • F = poor • — = no data |
||
| Pick Pony AI Rating | D | B |
| Pace Trip Longshot | — | — |
| Connections Longshot | — | — |
| Situational Longshot | — | — |
| Speed | A | C |
| Early Pace | A | C |
| Mid Pace | B | C |
| Late Pace | B | D |
| Finish Pos | A | B |
| Dirt Speed | F | F |
| Turf Speed | F | D |
| Distance Speed | A | B |
| Trainer Effectiveness | B | C |
| Jockey Effectiveness | D | D |
| 3rd Party Ratings | A | B |
| Recent
Performance analysis from the horse's recent races, weighted to reflect current form. Sprint and Route FPS (Foot Per Second) measure pace efficiency over the horse's recent sprints and routes respectively. Grading scale: A = elite • B = above average • C = average • D = below average • F = poor • — = no data |
||
| Speed | A | C |
| Early Pace | A | C |
| Mid Pace | B | C |
| Late Pace | B | C |
| Sprint FPS | F | F |
| Route FPS | F | F |
| Trainer Effectiveness | B | C |
| Jockey Effectiveness | D | D |
| 3rd Party Ratings | A | B |
| Predictions
AI-generated projections for the upcoming race, derived from prior AI analysis for speed and pace trends, surface and distance suitability, and current conditions. Grading scale: A = elite • B = above average • C = average • D = below average • F = poor • — = no data |
||
| Speed | A | C |
| Early Pace | A | B |
| Mid Pace | A | C |
| Late Pace | C | C |
Chart Guide (2.0.41)
What it shows: This horse’s recent races, one bubble per race, plotted by its AI speed figure against the class par for today’s race (the dashed line).
What to look for: Recent bubbles at or above the dashed line, a trend line angled up, and a narrow shaded band (steady form). Check whether the good runs came on today’s surface and distance.
- Bubbles
- Color = surface: green (turf), brown (dirt), blue (synthetic)
- Top number = finishing position; bottom number in parentheses = starting post position
- Height above line = beaten lengths — closer means a smaller margin
- Border = track conditions: green (FST/GD/FM), yellow (WF/SL/YLD), red (SY/MY/FRZ/SFT/HVY)
- Connecting Line
- Solid = good conditions; dashed = bad conditions
- Line Symbol
- ▲ Triangle = sprint (7f or less); ● Circle = route (more than 7f)
- Days Between Races
- Small number above each bubble (e.g. 19d) = days since the previous race — helps spot freshness, layoffs, and tight scheduling.
- Shaded Band (Bollinger)
- Highlights volatility — a wider band means more variation in recent performance
- Performance Trend
- Straight line showing the overall performance direction — angled up = improving, angled down = declining
- Dashed Reference Line
- AI Opponent = AI analysis class-level par for the race
AI Model History Guide
What it shows: How our AI models rated this horse in each of its recent races, compared with how they rate today’s field (the dashed lines).
What to look for: Lines that are rising and sit above the dashed field averages — the models have liked this horse and still do. Falling lines, or lines below the dashed ones, mean the models are cooling on it.
- Lines
- Each solid line shows this horse’s model score over its last 10 races: blue = Mod1, green = Mod2, amber = Mod3.
- Dashed Lines
- Dashed lines represent the current race’s field average for each model — a score below the dashed line indicates the horse ranked below average in this model’s assessment.
- Higher is Stronger
- All three model scores are 0–100: a higher number means the model rates this horse more favorably among the field.
Mod1(W): 82 (1/8) Mod2(W): 75 (2/8) Mod3(W): 79 (3/8) Mod1-LS: 55 (6/8) Win Prob: 18.4% Value Score: 1.35 ★
Performance vs. Peers Guide
What it shows: Each horse’s career, last-3-race and last-race performance side by side, against the field average.
What to look for: Horses above the field average whose last race is green (better than their average) and whose trend line rises — improving form. Red last races and falling lines point to declining form.
- Bars (per post)
- Blue = avg career performance • Amber = avg last 3 races • Green = last race (improved vs. avg) • Red = last race (declined vs. avg)
- Trend Line
- Angled line above the bars: rising = improving form • falling = declining form.
- Horizontal Line
- Field average — the mean career performance of all horses in this race.
- Color Circles
- Standard post-position colors below each lane — same as the Total Pace chart.
- Border
- Thicker border = this horse’s post position.
Figure Comparison
What it shows: This horse’s ratings, speed figures and pace figures next to every other horse in the race.
What to look for: Where this horse (the darker column) leads the field or falls short. Strong ratings plus strong recent speed make a contender; recent speed well above career speed suggests improving form.
- Rating
- The three Pick Pony algorithm ratings (Algo 1, Algo 2, Algo 3) that make up the overall PP AI Rating — higher is a stronger contender rating.
- Speed
- Career average speed, recent 3-race average, and last-race speed figure — spot horses in improving or declining form.
- Pace
- Average Early (E1), Mid (E2), and Stretch (LP) pace figures — reveals pace-setters vs. closers vs. all-the-way types.
- This horse
- The horse whose stats card is open is highlighted with a darker column background.
Winning Profiles
What it shows: Each horse’s win rate and in-the-money rate over its last 10 starts, one dot per horse.
What to look for: Dots in the top-right are consistent winners. Top-left horses often finish in the money but rarely win — better for place and show bets or underneath in exotics. Bottom-left horses rarely finish well.
- Axes
- X: Win % from last 10 starts — Y: In-the-money % (top-3 finishes) from last 10 starts.
- Quadrants
- Consistent Winners (top-right): high win & ITM — reliable performers.
Place Threats (top-left): boards often but doesn’t win often — good exacta/trifecta angles.
Streaky (bottom-right): wins occasionally, misses the board often — all-or-nothing.
Developing (bottom-left): still finding form — longshot territory. - Reference Lines
- Dashed lines mark field averages. Dots to the right win more; dots higher board more.
- This horse
- Highlighted with a gold border and larger dot.
AI Model Comparison
What it shows: All AI model scores for every horse in the race, grouped by what each model is trained to find.
What to look for: The horse leading the green winner models is the models’ likely winner. A horse that stands out in the red longshot models but not the green ones is a longshot the models think is underrated.
- Winner Models (green)
- Mod1(W), Mod2(W), and Mod3(W) trained to predict race winners. Higher score = stronger contender.
- Longshot Models (red)
- Mod1-LS, Mod2-LS, and Mod3-LS trained to find high-value longshots. Higher score = stronger longshot candidate.
- Form Model (blue)
- Mod4 sequence model trained on recent form patterns. Higher score = stronger recent form profile.
- This horse
- Highlighted with a darker column background.
Race Pace Simulation Guide
What it shows: A simulated run of today’s race, based on each horse’s running style, post position and the expected pace.
What to look for: Who gets the lead, who gets boxed in, and who is gaining at the finish. Move the track-bias slider to see how the predicted order changes on a speed-favouring or closer-favouring track.
- Slider
- Drag left→right to advance from gate to finish. Drag all the way back to reset the race.
- Predicted Finish Order
- Factors in contested pace burn, each horse’s effort curve (peaked-early vs. peaked-late), and wide trip cost from outside posts. Updated live when Track Bias changes.
- Pace Scenario
- Lone Speed: single E horse likely rates and holds. Contested: two E horses burn each other — closers benefit. Hot Pace: speed meltdown, deep closers thrive. Soft: no early speed, moderate fractions throughout.
- Track Bias
- Slider below canvas. −2 = strong closer/wet bias; +2 = strong speed/rail bias. Recomputes the predicted finish order.
- Boxed Indicator
- Dashed orange ring = horse is surrounded (rival ahead, rival behind, wall outside). In a real race this horse must find a clear path to run.
- Running Styles
- E/EE = early speed (rushes to rail). P = presser (stalks the pace). S = stalker. SS = slow starter / closer.
| Stat | vs. Current Card | vs. All Horses |
|---|---|---|
| Averages
Career-average metrics across all AI race analysis. Performance and pace averages reflect estimated historical performance; trainer and jockey grades score in-the-money percentages. Grading scale: A = elite • B = above average • C = average • D = below average • F = poor • — = no data |
||
| Pick Pony AI Rating | C | B |
| Pace Trip Longshot | — | — |
| Connections Longshot | — | — |
| Situational Longshot | — | — |
| Speed | B | D |
| Early Pace | C | D |
| Mid Pace | C | D |
| Late Pace | A | B |
| Finish Pos | A | F |
| Dirt Speed | F | F |
| Turf Speed | B | C |
| Distance Speed | D | F |
| Trainer Effectiveness | A | A |
| Jockey Effectiveness | B | B |
| 3rd Party Ratings | A | C |
| Recent
Performance analysis from the horse's recent races, weighted to reflect current form. Sprint and Route FPS (Foot Per Second) measure pace efficiency over the horse's recent sprints and routes respectively. Grading scale: A = elite • B = above average • C = average • D = below average • F = poor • — = no data |
||
| Speed | B | D |
| Early Pace | C | D |
| Mid Pace | C | D |
| Late Pace | A | B |
| Sprint FPS | D | D |
| Route FPS | D | D |
| Trainer Effectiveness | A | A |
| Jockey Effectiveness | B | B |
| 3rd Party Ratings | A | C |
| Predictions
AI-generated projections for the upcoming race, derived from prior AI analysis for speed and pace trends, surface and distance suitability, and current conditions. Grading scale: A = elite • B = above average • C = average • D = below average • F = poor • — = no data |
||
| Speed | B | D |
| Early Pace | C | C |
| Mid Pace | F | F |
| Late Pace | C | C |
Chart Guide (2.0.41)
What it shows: This horse’s recent races, one bubble per race, plotted by its AI speed figure against the class par for today’s race (the dashed line).
What to look for: Recent bubbles at or above the dashed line, a trend line angled up, and a narrow shaded band (steady form). Check whether the good runs came on today’s surface and distance.
- Bubbles
- Color = surface: green (turf), brown (dirt), blue (synthetic)
- Top number = finishing position; bottom number in parentheses = starting post position
- Height above line = beaten lengths — closer means a smaller margin
- Border = track conditions: green (FST/GD/FM), yellow (WF/SL/YLD), red (SY/MY/FRZ/SFT/HVY)
- Connecting Line
- Solid = good conditions; dashed = bad conditions
- Line Symbol
- ▲ Triangle = sprint (7f or less); ● Circle = route (more than 7f)
- Days Between Races
- Small number above each bubble (e.g. 19d) = days since the previous race — helps spot freshness, layoffs, and tight scheduling.
- Shaded Band (Bollinger)
- Highlights volatility — a wider band means more variation in recent performance
- Performance Trend
- Straight line showing the overall performance direction — angled up = improving, angled down = declining
- Dashed Reference Line
- AI Opponent = AI analysis class-level par for the race
AI Model History Guide
What it shows: How our AI models rated this horse in each of its recent races, compared with how they rate today’s field (the dashed lines).
What to look for: Lines that are rising and sit above the dashed field averages — the models have liked this horse and still do. Falling lines, or lines below the dashed ones, mean the models are cooling on it.
- Lines
- Each solid line shows this horse’s model score over its last 10 races: blue = Mod1, green = Mod2, amber = Mod3.
- Dashed Lines
- Dashed lines represent the current race’s field average for each model — a score below the dashed line indicates the horse ranked below average in this model’s assessment.
- Higher is Stronger
- All three model scores are 0–100: a higher number means the model rates this horse more favorably among the field.
Mod1(W): 82 (1/8) Mod2(W): 75 (2/8) Mod3(W): 79 (3/8) Mod1-LS: 55 (6/8) Win Prob: 18.4% Value Score: 1.35 ★
Performance vs. Peers Guide
What it shows: Each horse’s career, last-3-race and last-race performance side by side, against the field average.
What to look for: Horses above the field average whose last race is green (better than their average) and whose trend line rises — improving form. Red last races and falling lines point to declining form.
- Bars (per post)
- Blue = avg career performance • Amber = avg last 3 races • Green = last race (improved vs. avg) • Red = last race (declined vs. avg)
- Trend Line
- Angled line above the bars: rising = improving form • falling = declining form.
- Horizontal Line
- Field average — the mean career performance of all horses in this race.
- Color Circles
- Standard post-position colors below each lane — same as the Total Pace chart.
- Border
- Thicker border = this horse’s post position.
Figure Comparison
What it shows: This horse’s ratings, speed figures and pace figures next to every other horse in the race.
What to look for: Where this horse (the darker column) leads the field or falls short. Strong ratings plus strong recent speed make a contender; recent speed well above career speed suggests improving form.
- Rating
- The three Pick Pony algorithm ratings (Algo 1, Algo 2, Algo 3) that make up the overall PP AI Rating — higher is a stronger contender rating.
- Speed
- Career average speed, recent 3-race average, and last-race speed figure — spot horses in improving or declining form.
- Pace
- Average Early (E1), Mid (E2), and Stretch (LP) pace figures — reveals pace-setters vs. closers vs. all-the-way types.
- This horse
- The horse whose stats card is open is highlighted with a darker column background.
Winning Profiles
What it shows: Each horse’s win rate and in-the-money rate over its last 10 starts, one dot per horse.
What to look for: Dots in the top-right are consistent winners. Top-left horses often finish in the money but rarely win — better for place and show bets or underneath in exotics. Bottom-left horses rarely finish well.
- Axes
- X: Win % from last 10 starts — Y: In-the-money % (top-3 finishes) from last 10 starts.
- Quadrants
- Consistent Winners (top-right): high win & ITM — reliable performers.
Place Threats (top-left): boards often but doesn’t win often — good exacta/trifecta angles.
Streaky (bottom-right): wins occasionally, misses the board often — all-or-nothing.
Developing (bottom-left): still finding form — longshot territory. - Reference Lines
- Dashed lines mark field averages. Dots to the right win more; dots higher board more.
- This horse
- Highlighted with a gold border and larger dot.
AI Model Comparison
What it shows: All AI model scores for every horse in the race, grouped by what each model is trained to find.
What to look for: The horse leading the green winner models is the models’ likely winner. A horse that stands out in the red longshot models but not the green ones is a longshot the models think is underrated.
- Winner Models (green)
- Mod1(W), Mod2(W), and Mod3(W) trained to predict race winners. Higher score = stronger contender.
- Longshot Models (red)
- Mod1-LS, Mod2-LS, and Mod3-LS trained to find high-value longshots. Higher score = stronger longshot candidate.
- Form Model (blue)
- Mod4 sequence model trained on recent form patterns. Higher score = stronger recent form profile.
- This horse
- Highlighted with a darker column background.
Race Pace Simulation Guide
What it shows: A simulated run of today’s race, based on each horse’s running style, post position and the expected pace.
What to look for: Who gets the lead, who gets boxed in, and who is gaining at the finish. Move the track-bias slider to see how the predicted order changes on a speed-favouring or closer-favouring track.
- Slider
- Drag left→right to advance from gate to finish. Drag all the way back to reset the race.
- Predicted Finish Order
- Factors in contested pace burn, each horse’s effort curve (peaked-early vs. peaked-late), and wide trip cost from outside posts. Updated live when Track Bias changes.
- Pace Scenario
- Lone Speed: single E horse likely rates and holds. Contested: two E horses burn each other — closers benefit. Hot Pace: speed meltdown, deep closers thrive. Soft: no early speed, moderate fractions throughout.
- Track Bias
- Slider below canvas. −2 = strong closer/wet bias; +2 = strong speed/rail bias. Recomputes the predicted finish order.
- Boxed Indicator
- Dashed orange ring = horse is surrounded (rival ahead, rival behind, wall outside). In a real race this horse must find a clear path to run.
- Running Styles
- E/EE = early speed (rushes to rail). P = presser (stalks the pace). S = stalker. SS = slow starter / closer.
| Stat | vs. Current Card | vs. All Horses |
|---|---|---|
| Averages
Career-average metrics across all AI race analysis. Performance and pace averages reflect estimated historical performance; trainer and jockey grades score in-the-money percentages. Grading scale: A = elite • B = above average • C = average • D = below average • F = poor • — = no data |
||
| Pick Pony AI Rating | D | C |
| Pace Trip Longshot | — | — |
| Connections Longshot | — | — |
| Situational Longshot | — | — |
| Speed | B | D |
| Early Pace | D | D |
| Mid Pace | D | D |
| Late Pace | C | D |
| Finish Pos | B | F |
| Dirt Speed | C | D |
| Turf Speed | A | B |
| Distance Speed | B | C |
| Trainer Effectiveness | B | B |
| Jockey Effectiveness | A | B |
| 3rd Party Ratings | D | D |
| Recent
Performance analysis from the horse's recent races, weighted to reflect current form. Sprint and Route FPS (Foot Per Second) measure pace efficiency over the horse's recent sprints and routes respectively. Grading scale: A = elite • B = above average • C = average • D = below average • F = poor • — = no data |
||
| Speed | D | F |
| Early Pace | F | D |
| Mid Pace | F | D |
| Late Pace | C | D |
| Sprint FPS | B | C |
| Route FPS | C | D |
| Trainer Effectiveness | B | B |
| Jockey Effectiveness | A | B |
| 3rd Party Ratings | D | D |
| Predictions
AI-generated projections for the upcoming race, derived from prior AI analysis for speed and pace trends, surface and distance suitability, and current conditions. Grading scale: A = elite • B = above average • C = average • D = below average • F = poor • — = no data |
||
| Speed | B | D |
| Early Pace | C | D |
| Mid Pace | C | D |
| Late Pace | C | C |
Chart Guide (2.0.41)
What it shows: This horse’s recent races, one bubble per race, plotted by its AI speed figure against the class par for today’s race (the dashed line).
What to look for: Recent bubbles at or above the dashed line, a trend line angled up, and a narrow shaded band (steady form). Check whether the good runs came on today’s surface and distance.
- Bubbles
- Color = surface: green (turf), brown (dirt), blue (synthetic)
- Top number = finishing position; bottom number in parentheses = starting post position
- Height above line = beaten lengths — closer means a smaller margin
- Border = track conditions: green (FST/GD/FM), yellow (WF/SL/YLD), red (SY/MY/FRZ/SFT/HVY)
- Connecting Line
- Solid = good conditions; dashed = bad conditions
- Line Symbol
- ▲ Triangle = sprint (7f or less); ● Circle = route (more than 7f)
- Days Between Races
- Small number above each bubble (e.g. 19d) = days since the previous race — helps spot freshness, layoffs, and tight scheduling.
- Shaded Band (Bollinger)
- Highlights volatility — a wider band means more variation in recent performance
- Performance Trend
- Straight line showing the overall performance direction — angled up = improving, angled down = declining
- Dashed Reference Line
- AI Opponent = AI analysis class-level par for the race
AI Model History Guide
What it shows: How our AI models rated this horse in each of its recent races, compared with how they rate today’s field (the dashed lines).
What to look for: Lines that are rising and sit above the dashed field averages — the models have liked this horse and still do. Falling lines, or lines below the dashed ones, mean the models are cooling on it.
- Lines
- Each solid line shows this horse’s model score over its last 10 races: blue = Mod1, green = Mod2, amber = Mod3.
- Dashed Lines
- Dashed lines represent the current race’s field average for each model — a score below the dashed line indicates the horse ranked below average in this model’s assessment.
- Higher is Stronger
- All three model scores are 0–100: a higher number means the model rates this horse more favorably among the field.
Mod1(W): 82 (1/8) Mod2(W): 75 (2/8) Mod3(W): 79 (3/8) Mod1-LS: 55 (6/8) Win Prob: 18.4% Value Score: 1.35 ★
Performance vs. Peers Guide
What it shows: Each horse’s career, last-3-race and last-race performance side by side, against the field average.
What to look for: Horses above the field average whose last race is green (better than their average) and whose trend line rises — improving form. Red last races and falling lines point to declining form.
- Bars (per post)
- Blue = avg career performance • Amber = avg last 3 races • Green = last race (improved vs. avg) • Red = last race (declined vs. avg)
- Trend Line
- Angled line above the bars: rising = improving form • falling = declining form.
- Horizontal Line
- Field average — the mean career performance of all horses in this race.
- Color Circles
- Standard post-position colors below each lane — same as the Total Pace chart.
- Border
- Thicker border = this horse’s post position.
Figure Comparison
What it shows: This horse’s ratings, speed figures and pace figures next to every other horse in the race.
What to look for: Where this horse (the darker column) leads the field or falls short. Strong ratings plus strong recent speed make a contender; recent speed well above career speed suggests improving form.
- Rating
- The three Pick Pony algorithm ratings (Algo 1, Algo 2, Algo 3) that make up the overall PP AI Rating — higher is a stronger contender rating.
- Speed
- Career average speed, recent 3-race average, and last-race speed figure — spot horses in improving or declining form.
- Pace
- Average Early (E1), Mid (E2), and Stretch (LP) pace figures — reveals pace-setters vs. closers vs. all-the-way types.
- This horse
- The horse whose stats card is open is highlighted with a darker column background.
Winning Profiles
What it shows: Each horse’s win rate and in-the-money rate over its last 10 starts, one dot per horse.
What to look for: Dots in the top-right are consistent winners. Top-left horses often finish in the money but rarely win — better for place and show bets or underneath in exotics. Bottom-left horses rarely finish well.
- Axes
- X: Win % from last 10 starts — Y: In-the-money % (top-3 finishes) from last 10 starts.
- Quadrants
- Consistent Winners (top-right): high win & ITM — reliable performers.
Place Threats (top-left): boards often but doesn’t win often — good exacta/trifecta angles.
Streaky (bottom-right): wins occasionally, misses the board often — all-or-nothing.
Developing (bottom-left): still finding form — longshot territory. - Reference Lines
- Dashed lines mark field averages. Dots to the right win more; dots higher board more.
- This horse
- Highlighted with a gold border and larger dot.
AI Model Comparison
What it shows: All AI model scores for every horse in the race, grouped by what each model is trained to find.
What to look for: The horse leading the green winner models is the models’ likely winner. A horse that stands out in the red longshot models but not the green ones is a longshot the models think is underrated.
- Winner Models (green)
- Mod1(W), Mod2(W), and Mod3(W) trained to predict race winners. Higher score = stronger contender.
- Longshot Models (red)
- Mod1-LS, Mod2-LS, and Mod3-LS trained to find high-value longshots. Higher score = stronger longshot candidate.
- Form Model (blue)
- Mod4 sequence model trained on recent form patterns. Higher score = stronger recent form profile.
- This horse
- Highlighted with a darker column background.
Race Pace Simulation Guide
What it shows: A simulated run of today’s race, based on each horse’s running style, post position and the expected pace.
What to look for: Who gets the lead, who gets boxed in, and who is gaining at the finish. Move the track-bias slider to see how the predicted order changes on a speed-favouring or closer-favouring track.
- Slider
- Drag left→right to advance from gate to finish. Drag all the way back to reset the race.
- Predicted Finish Order
- Factors in contested pace burn, each horse’s effort curve (peaked-early vs. peaked-late), and wide trip cost from outside posts. Updated live when Track Bias changes.
- Pace Scenario
- Lone Speed: single E horse likely rates and holds. Contested: two E horses burn each other — closers benefit. Hot Pace: speed meltdown, deep closers thrive. Soft: no early speed, moderate fractions throughout.
- Track Bias
- Slider below canvas. −2 = strong closer/wet bias; +2 = strong speed/rail bias. Recomputes the predicted finish order.
- Boxed Indicator
- Dashed orange ring = horse is surrounded (rival ahead, rival behind, wall outside). In a real race this horse must find a clear path to run.
- Running Styles
- E/EE = early speed (rushes to rail). P = presser (stalks the pace). S = stalker. SS = slow starter / closer.
| Stat | vs. Current Card | vs. All Horses |
|---|---|---|
| Averages
Career-average metrics across all AI race analysis. Performance and pace averages reflect estimated historical performance; trainer and jockey grades score in-the-money percentages. Grading scale: A = elite • B = above average • C = average • D = below average • F = poor • — = no data |
||
| Pick Pony AI Rating | F | D |
| Pace Trip Longshot | — | — |
| Connections Longshot | — | — |
| Situational Longshot | — | — |
| Speed | D | C |
| Early Pace | F | A |
| Mid Pace | D | A |
| Late Pace | D | C |
| Finish Pos | D | B |
| Dirt Speed | F | F |
| Turf Speed | A | B |
| Distance Speed | D | B |
| Trainer Effectiveness | D | D |
| Jockey Effectiveness | B | B |
| 3rd Party Ratings | F | B |
| Recent
Performance analysis from the horse's recent races, weighted to reflect current form. Sprint and Route FPS (Foot Per Second) measure pace efficiency over the horse's recent sprints and routes respectively. Grading scale: A = elite • B = above average • C = average • D = below average • F = poor • — = no data |
||
| Speed | C | C |
| Early Pace | D | A |
| Mid Pace | F | A |
| Late Pace | D | C |
| Sprint FPS | A | A |
| Route FPS | A | A |
| Trainer Effectiveness | D | D |
| Jockey Effectiveness | B | B |
| 3rd Party Ratings | F | B |
| Predictions
AI-generated projections for the upcoming race, derived from prior AI analysis for speed and pace trends, surface and distance suitability, and current conditions. Grading scale: A = elite • B = above average • C = average • D = below average • F = poor • — = no data |
||
| Speed | F | D |
| Early Pace | D | A |
| Mid Pace | C | A |
| Late Pace | C | C |
Chart Guide (2.0.41)
What it shows: This horse’s recent races, one bubble per race, plotted by its AI speed figure against the class par for today’s race (the dashed line).
What to look for: Recent bubbles at or above the dashed line, a trend line angled up, and a narrow shaded band (steady form). Check whether the good runs came on today’s surface and distance.
- Bubbles
- Color = surface: green (turf), brown (dirt), blue (synthetic)
- Top number = finishing position; bottom number in parentheses = starting post position
- Height above line = beaten lengths — closer means a smaller margin
- Border = track conditions: green (FST/GD/FM), yellow (WF/SL/YLD), red (SY/MY/FRZ/SFT/HVY)
- Connecting Line
- Solid = good conditions; dashed = bad conditions
- Line Symbol
- ▲ Triangle = sprint (7f or less); ● Circle = route (more than 7f)
- Days Between Races
- Small number above each bubble (e.g. 19d) = days since the previous race — helps spot freshness, layoffs, and tight scheduling.
- Shaded Band (Bollinger)
- Highlights volatility — a wider band means more variation in recent performance
- Performance Trend
- Straight line showing the overall performance direction — angled up = improving, angled down = declining
- Dashed Reference Line
- AI Opponent = AI analysis class-level par for the race
AI Model History Guide
What it shows: How our AI models rated this horse in each of its recent races, compared with how they rate today’s field (the dashed lines).
What to look for: Lines that are rising and sit above the dashed field averages — the models have liked this horse and still do. Falling lines, or lines below the dashed ones, mean the models are cooling on it.
- Lines
- Each solid line shows this horse’s model score over its last 10 races: blue = Mod1, green = Mod2, amber = Mod3.
- Dashed Lines
- Dashed lines represent the current race’s field average for each model — a score below the dashed line indicates the horse ranked below average in this model’s assessment.
- Higher is Stronger
- All three model scores are 0–100: a higher number means the model rates this horse more favorably among the field.
Mod1(W): 82 (1/8) Mod2(W): 75 (2/8) Mod3(W): 79 (3/8) Mod1-LS: 55 (6/8) Win Prob: 18.4% Value Score: 1.35 ★
Performance vs. Peers Guide
What it shows: Each horse’s career, last-3-race and last-race performance side by side, against the field average.
What to look for: Horses above the field average whose last race is green (better than their average) and whose trend line rises — improving form. Red last races and falling lines point to declining form.
- Bars (per post)
- Blue = avg career performance • Amber = avg last 3 races • Green = last race (improved vs. avg) • Red = last race (declined vs. avg)
- Trend Line
- Angled line above the bars: rising = improving form • falling = declining form.
- Horizontal Line
- Field average — the mean career performance of all horses in this race.
- Color Circles
- Standard post-position colors below each lane — same as the Total Pace chart.
- Border
- Thicker border = this horse’s post position.
Figure Comparison
What it shows: This horse’s ratings, speed figures and pace figures next to every other horse in the race.
What to look for: Where this horse (the darker column) leads the field or falls short. Strong ratings plus strong recent speed make a contender; recent speed well above career speed suggests improving form.
- Rating
- The three Pick Pony algorithm ratings (Algo 1, Algo 2, Algo 3) that make up the overall PP AI Rating — higher is a stronger contender rating.
- Speed
- Career average speed, recent 3-race average, and last-race speed figure — spot horses in improving or declining form.
- Pace
- Average Early (E1), Mid (E2), and Stretch (LP) pace figures — reveals pace-setters vs. closers vs. all-the-way types.
- This horse
- The horse whose stats card is open is highlighted with a darker column background.
Winning Profiles
What it shows: Each horse’s win rate and in-the-money rate over its last 10 starts, one dot per horse.
What to look for: Dots in the top-right are consistent winners. Top-left horses often finish in the money but rarely win — better for place and show bets or underneath in exotics. Bottom-left horses rarely finish well.
- Axes
- X: Win % from last 10 starts — Y: In-the-money % (top-3 finishes) from last 10 starts.
- Quadrants
- Consistent Winners (top-right): high win & ITM — reliable performers.
Place Threats (top-left): boards often but doesn’t win often — good exacta/trifecta angles.
Streaky (bottom-right): wins occasionally, misses the board often — all-or-nothing.
Developing (bottom-left): still finding form — longshot territory. - Reference Lines
- Dashed lines mark field averages. Dots to the right win more; dots higher board more.
- This horse
- Highlighted with a gold border and larger dot.
AI Model Comparison
What it shows: All AI model scores for every horse in the race, grouped by what each model is trained to find.
What to look for: The horse leading the green winner models is the models’ likely winner. A horse that stands out in the red longshot models but not the green ones is a longshot the models think is underrated.
- Winner Models (green)
- Mod1(W), Mod2(W), and Mod3(W) trained to predict race winners. Higher score = stronger contender.
- Longshot Models (red)
- Mod1-LS, Mod2-LS, and Mod3-LS trained to find high-value longshots. Higher score = stronger longshot candidate.
- Form Model (blue)
- Mod4 sequence model trained on recent form patterns. Higher score = stronger recent form profile.
- This horse
- Highlighted with a darker column background.
Race Pace Simulation Guide
What it shows: A simulated run of today’s race, based on each horse’s running style, post position and the expected pace.
What to look for: Who gets the lead, who gets boxed in, and who is gaining at the finish. Move the track-bias slider to see how the predicted order changes on a speed-favouring or closer-favouring track.
- Slider
- Drag left→right to advance from gate to finish. Drag all the way back to reset the race.
- Predicted Finish Order
- Factors in contested pace burn, each horse’s effort curve (peaked-early vs. peaked-late), and wide trip cost from outside posts. Updated live when Track Bias changes.
- Pace Scenario
- Lone Speed: single E horse likely rates and holds. Contested: two E horses burn each other — closers benefit. Hot Pace: speed meltdown, deep closers thrive. Soft: no early speed, moderate fractions throughout.
- Track Bias
- Slider below canvas. −2 = strong closer/wet bias; +2 = strong speed/rail bias. Recomputes the predicted finish order.
- Boxed Indicator
- Dashed orange ring = horse is surrounded (rival ahead, rival behind, wall outside). In a real race this horse must find a clear path to run.
- Running Styles
- E/EE = early speed (rushes to rail). P = presser (stalks the pace). S = stalker. SS = slow starter / closer.
| Stat | vs. Current Card | vs. All Horses |
|---|---|---|
| Averages
Career-average metrics across all AI race analysis. Performance and pace averages reflect estimated historical performance; trainer and jockey grades score in-the-money percentages. Grading scale: A = elite • B = above average • C = average • D = below average • F = poor • — = no data |
||
| Pick Pony AI Rating | D | D |
| Pace Trip Longshot | — | — |
| Connections Longshot | — | — |
| Situational Longshot | — | — |
| Speed | C | C |
| Early Pace | D | A |
| Mid Pace | F | A |
| Late Pace | A | C |
| Finish Pos | F | C |
| Dirt Speed | B | C |
| Turf Speed | C | D |
| Distance Speed | D | B |
| Trainer Effectiveness | A | A |
| Jockey Effectiveness | C | C |
| 3rd Party Ratings | C | B |
| Recent
Performance analysis from the horse's recent races, weighted to reflect current form. Sprint and Route FPS (Foot Per Second) measure pace efficiency over the horse's recent sprints and routes respectively. Grading scale: A = elite • B = above average • C = average • D = below average • F = poor • — = no data |
||
| Speed | A | B |
| Early Pace | A | A |
| Mid Pace | A | A |
| Late Pace | A | B |
| Sprint FPS | D | A |
| Route FPS | C | A |
| Trainer Effectiveness | A | A |
| Jockey Effectiveness | C | C |
| 3rd Party Ratings | C | B |
| Predictions
AI-generated projections for the upcoming race, derived from prior AI analysis for speed and pace trends, surface and distance suitability, and current conditions. Grading scale: A = elite • B = above average • C = average • D = below average • F = poor • — = no data |
||
| Speed | C | C |
| Early Pace | C | A |
| Mid Pace | D | A |
| Late Pace | C | C |
Chart Guide (2.0.41)
What it shows: This horse’s recent races, one bubble per race, plotted by its AI speed figure against the class par for today’s race (the dashed line).
What to look for: Recent bubbles at or above the dashed line, a trend line angled up, and a narrow shaded band (steady form). Check whether the good runs came on today’s surface and distance.
- Bubbles
- Color = surface: green (turf), brown (dirt), blue (synthetic)
- Top number = finishing position; bottom number in parentheses = starting post position
- Height above line = beaten lengths — closer means a smaller margin
- Border = track conditions: green (FST/GD/FM), yellow (WF/SL/YLD), red (SY/MY/FRZ/SFT/HVY)
- Connecting Line
- Solid = good conditions; dashed = bad conditions
- Line Symbol
- ▲ Triangle = sprint (7f or less); ● Circle = route (more than 7f)
- Days Between Races
- Small number above each bubble (e.g. 19d) = days since the previous race — helps spot freshness, layoffs, and tight scheduling.
- Shaded Band (Bollinger)
- Highlights volatility — a wider band means more variation in recent performance
- Performance Trend
- Straight line showing the overall performance direction — angled up = improving, angled down = declining
- Dashed Reference Line
- AI Opponent = AI analysis class-level par for the race
AI Model History Guide
What it shows: How our AI models rated this horse in each of its recent races, compared with how they rate today’s field (the dashed lines).
What to look for: Lines that are rising and sit above the dashed field averages — the models have liked this horse and still do. Falling lines, or lines below the dashed ones, mean the models are cooling on it.
- Lines
- Each solid line shows this horse’s model score over its last 10 races: blue = Mod1, green = Mod2, amber = Mod3.
- Dashed Lines
- Dashed lines represent the current race’s field average for each model — a score below the dashed line indicates the horse ranked below average in this model’s assessment.
- Higher is Stronger
- All three model scores are 0–100: a higher number means the model rates this horse more favorably among the field.
Mod1(W): 82 (1/8) Mod2(W): 75 (2/8) Mod3(W): 79 (3/8) Mod1-LS: 55 (6/8) Win Prob: 18.4% Value Score: 1.35 ★
Performance vs. Peers Guide
What it shows: Each horse’s career, last-3-race and last-race performance side by side, against the field average.
What to look for: Horses above the field average whose last race is green (better than their average) and whose trend line rises — improving form. Red last races and falling lines point to declining form.
- Bars (per post)
- Blue = avg career performance • Amber = avg last 3 races • Green = last race (improved vs. avg) • Red = last race (declined vs. avg)
- Trend Line
- Angled line above the bars: rising = improving form • falling = declining form.
- Horizontal Line
- Field average — the mean career performance of all horses in this race.
- Color Circles
- Standard post-position colors below each lane — same as the Total Pace chart.
- Border
- Thicker border = this horse’s post position.
Figure Comparison
What it shows: This horse’s ratings, speed figures and pace figures next to every other horse in the race.
What to look for: Where this horse (the darker column) leads the field or falls short. Strong ratings plus strong recent speed make a contender; recent speed well above career speed suggests improving form.
- Rating
- The three Pick Pony algorithm ratings (Algo 1, Algo 2, Algo 3) that make up the overall PP AI Rating — higher is a stronger contender rating.
- Speed
- Career average speed, recent 3-race average, and last-race speed figure — spot horses in improving or declining form.
- Pace
- Average Early (E1), Mid (E2), and Stretch (LP) pace figures — reveals pace-setters vs. closers vs. all-the-way types.
- This horse
- The horse whose stats card is open is highlighted with a darker column background.
Winning Profiles
What it shows: Each horse’s win rate and in-the-money rate over its last 10 starts, one dot per horse.
What to look for: Dots in the top-right are consistent winners. Top-left horses often finish in the money but rarely win — better for place and show bets or underneath in exotics. Bottom-left horses rarely finish well.
- Axes
- X: Win % from last 10 starts — Y: In-the-money % (top-3 finishes) from last 10 starts.
- Quadrants
- Consistent Winners (top-right): high win & ITM — reliable performers.
Place Threats (top-left): boards often but doesn’t win often — good exacta/trifecta angles.
Streaky (bottom-right): wins occasionally, misses the board often — all-or-nothing.
Developing (bottom-left): still finding form — longshot territory. - Reference Lines
- Dashed lines mark field averages. Dots to the right win more; dots higher board more.
- This horse
- Highlighted with a gold border and larger dot.
AI Model Comparison
What it shows: All AI model scores for every horse in the race, grouped by what each model is trained to find.
What to look for: The horse leading the green winner models is the models’ likely winner. A horse that stands out in the red longshot models but not the green ones is a longshot the models think is underrated.
- Winner Models (green)
- Mod1(W), Mod2(W), and Mod3(W) trained to predict race winners. Higher score = stronger contender.
- Longshot Models (red)
- Mod1-LS, Mod2-LS, and Mod3-LS trained to find high-value longshots. Higher score = stronger longshot candidate.
- Form Model (blue)
- Mod4 sequence model trained on recent form patterns. Higher score = stronger recent form profile.
- This horse
- Highlighted with a darker column background.
Race Pace Simulation Guide
What it shows: A simulated run of today’s race, based on each horse’s running style, post position and the expected pace.
What to look for: Who gets the lead, who gets boxed in, and who is gaining at the finish. Move the track-bias slider to see how the predicted order changes on a speed-favouring or closer-favouring track.
- Slider
- Drag left→right to advance from gate to finish. Drag all the way back to reset the race.
- Predicted Finish Order
- Factors in contested pace burn, each horse’s effort curve (peaked-early vs. peaked-late), and wide trip cost from outside posts. Updated live when Track Bias changes.
- Pace Scenario
- Lone Speed: single E horse likely rates and holds. Contested: two E horses burn each other — closers benefit. Hot Pace: speed meltdown, deep closers thrive. Soft: no early speed, moderate fractions throughout.
- Track Bias
- Slider below canvas. −2 = strong closer/wet bias; +2 = strong speed/rail bias. Recomputes the predicted finish order.
- Boxed Indicator
- Dashed orange ring = horse is surrounded (rival ahead, rival behind, wall outside). In a real race this horse must find a clear path to run.
- Running Styles
- E/EE = early speed (rushes to rail). P = presser (stalks the pace). S = stalker. SS = slow starter / closer.
| Stat | vs. Current Card | vs. All Horses |
|---|---|---|
| Averages
Career-average metrics across all AI race analysis. Performance and pace averages reflect estimated historical performance; trainer and jockey grades score in-the-money percentages. Grading scale: A = elite • B = above average • C = average • D = below average • F = poor • — = no data |
||
| Pick Pony AI Rating | C | D |
| Pace Trip Longshot | — | — |
| Connections Longshot | — | — |
| Situational Longshot | — | — |
| Speed | A | B |
| Early Pace | C | A |
| Mid Pace | C | A |
| Late Pace | A | B |
| Finish Pos | B | B |
| Dirt Speed | D | D |
| Turf Speed | C | D |
| Distance Speed | C | B |
| Trainer Effectiveness | F | D |
| Jockey Effectiveness | D | C |
| 3rd Party Ratings | D | B |
| Recent
Performance analysis from the horse's recent races, weighted to reflect current form. Sprint and Route FPS (Foot Per Second) measure pace efficiency over the horse's recent sprints and routes respectively. Grading scale: A = elite • B = above average • C = average • D = below average • F = poor • — = no data |
||
| Speed | B | B |
| Early Pace | B | A |
| Mid Pace | C | A |
| Late Pace | C | C |
| Sprint FPS | F | B |
| Route FPS | D | B |
| Trainer Effectiveness | F | D |
| Jockey Effectiveness | D | C |
| 3rd Party Ratings | D | B |
| Predictions
AI-generated projections for the upcoming race, derived from prior AI analysis for speed and pace trends, surface and distance suitability, and current conditions. Grading scale: A = elite • B = above average • C = average • D = below average • F = poor • — = no data |
||
| Speed | A | B |
| Early Pace | F | B |
| Mid Pace | B | A |
| Late Pace | C | C |
Chart Guide (2.0.41)
What it shows: This horse’s recent races, one bubble per race, plotted by its AI speed figure against the class par for today’s race (the dashed line).
What to look for: Recent bubbles at or above the dashed line, a trend line angled up, and a narrow shaded band (steady form). Check whether the good runs came on today’s surface and distance.
- Bubbles
- Color = surface: green (turf), brown (dirt), blue (synthetic)
- Top number = finishing position; bottom number in parentheses = starting post position
- Height above line = beaten lengths — closer means a smaller margin
- Border = track conditions: green (FST/GD/FM), yellow (WF/SL/YLD), red (SY/MY/FRZ/SFT/HVY)
- Connecting Line
- Solid = good conditions; dashed = bad conditions
- Line Symbol
- ▲ Triangle = sprint (7f or less); ● Circle = route (more than 7f)
- Days Between Races
- Small number above each bubble (e.g. 19d) = days since the previous race — helps spot freshness, layoffs, and tight scheduling.
- Shaded Band (Bollinger)
- Highlights volatility — a wider band means more variation in recent performance
- Performance Trend
- Straight line showing the overall performance direction — angled up = improving, angled down = declining
- Dashed Reference Line
- AI Opponent = AI analysis class-level par for the race
AI Model History Guide
What it shows: How our AI models rated this horse in each of its recent races, compared with how they rate today’s field (the dashed lines).
What to look for: Lines that are rising and sit above the dashed field averages — the models have liked this horse and still do. Falling lines, or lines below the dashed ones, mean the models are cooling on it.
- Lines
- Each solid line shows this horse’s model score over its last 10 races: blue = Mod1, green = Mod2, amber = Mod3.
- Dashed Lines
- Dashed lines represent the current race’s field average for each model — a score below the dashed line indicates the horse ranked below average in this model’s assessment.
- Higher is Stronger
- All three model scores are 0–100: a higher number means the model rates this horse more favorably among the field.
Mod1(W): 82 (1/8) Mod2(W): 75 (2/8) Mod3(W): 79 (3/8) Mod1-LS: 55 (6/8) Win Prob: 18.4% Value Score: 1.35 ★
Performance vs. Peers Guide
What it shows: Each horse’s career, last-3-race and last-race performance side by side, against the field average.
What to look for: Horses above the field average whose last race is green (better than their average) and whose trend line rises — improving form. Red last races and falling lines point to declining form.
- Bars (per post)
- Blue = avg career performance • Amber = avg last 3 races • Green = last race (improved vs. avg) • Red = last race (declined vs. avg)
- Trend Line
- Angled line above the bars: rising = improving form • falling = declining form.
- Horizontal Line
- Field average — the mean career performance of all horses in this race.
- Color Circles
- Standard post-position colors below each lane — same as the Total Pace chart.
- Border
- Thicker border = this horse’s post position.
Figure Comparison
What it shows: This horse’s ratings, speed figures and pace figures next to every other horse in the race.
What to look for: Where this horse (the darker column) leads the field or falls short. Strong ratings plus strong recent speed make a contender; recent speed well above career speed suggests improving form.
- Rating
- The three Pick Pony algorithm ratings (Algo 1, Algo 2, Algo 3) that make up the overall PP AI Rating — higher is a stronger contender rating.
- Speed
- Career average speed, recent 3-race average, and last-race speed figure — spot horses in improving or declining form.
- Pace
- Average Early (E1), Mid (E2), and Stretch (LP) pace figures — reveals pace-setters vs. closers vs. all-the-way types.
- This horse
- The horse whose stats card is open is highlighted with a darker column background.
Winning Profiles
What it shows: Each horse’s win rate and in-the-money rate over its last 10 starts, one dot per horse.
What to look for: Dots in the top-right are consistent winners. Top-left horses often finish in the money but rarely win — better for place and show bets or underneath in exotics. Bottom-left horses rarely finish well.
- Axes
- X: Win % from last 10 starts — Y: In-the-money % (top-3 finishes) from last 10 starts.
- Quadrants
- Consistent Winners (top-right): high win & ITM — reliable performers.
Place Threats (top-left): boards often but doesn’t win often — good exacta/trifecta angles.
Streaky (bottom-right): wins occasionally, misses the board often — all-or-nothing.
Developing (bottom-left): still finding form — longshot territory. - Reference Lines
- Dashed lines mark field averages. Dots to the right win more; dots higher board more.
- This horse
- Highlighted with a gold border and larger dot.
AI Model Comparison
What it shows: All AI model scores for every horse in the race, grouped by what each model is trained to find.
What to look for: The horse leading the green winner models is the models’ likely winner. A horse that stands out in the red longshot models but not the green ones is a longshot the models think is underrated.
- Winner Models (green)
- Mod1(W), Mod2(W), and Mod3(W) trained to predict race winners. Higher score = stronger contender.
- Longshot Models (red)
- Mod1-LS, Mod2-LS, and Mod3-LS trained to find high-value longshots. Higher score = stronger longshot candidate.
- Form Model (blue)
- Mod4 sequence model trained on recent form patterns. Higher score = stronger recent form profile.
- This horse
- Highlighted with a darker column background.
Race Pace Simulation Guide
What it shows: A simulated run of today’s race, based on each horse’s running style, post position and the expected pace.
What to look for: Who gets the lead, who gets boxed in, and who is gaining at the finish. Move the track-bias slider to see how the predicted order changes on a speed-favouring or closer-favouring track.
- Slider
- Drag left→right to advance from gate to finish. Drag all the way back to reset the race.
- Predicted Finish Order
- Factors in contested pace burn, each horse’s effort curve (peaked-early vs. peaked-late), and wide trip cost from outside posts. Updated live when Track Bias changes.
- Pace Scenario
- Lone Speed: single E horse likely rates and holds. Contested: two E horses burn each other — closers benefit. Hot Pace: speed meltdown, deep closers thrive. Soft: no early speed, moderate fractions throughout.
- Track Bias
- Slider below canvas. −2 = strong closer/wet bias; +2 = strong speed/rail bias. Recomputes the predicted finish order.
- Boxed Indicator
- Dashed orange ring = horse is surrounded (rival ahead, rival behind, wall outside). In a real race this horse must find a clear path to run.
- Running Styles
- E/EE = early speed (rushes to rail). P = presser (stalks the pace). S = stalker. SS = slow starter / closer.
| Stat | vs. Current Card | vs. All Horses |
|---|---|---|
| Averages
Career-average metrics across all AI race analysis. Performance and pace averages reflect estimated historical performance; trainer and jockey grades score in-the-money percentages. Grading scale: A = elite • B = above average • C = average • D = below average • F = poor • — = no data |
||
| Pick Pony AI Rating | A | B |
| Pace Trip Longshot | — | — |
| Connections Longshot | — | — |
| Situational Longshot | — | — |
| Speed | A | B |
| Early Pace | B | A |
| Mid Pace | A | A |
| Late Pace | C | C |
| Finish Pos | A | B |
| Dirt Speed | A | A |
| Turf Speed | C | D |
| Distance Speed | A | A |
| Trainer Effectiveness | A | A |
| Jockey Effectiveness | A | A |
| 3rd Party Ratings | A | A |
| Recent
Performance analysis from the horse's recent races, weighted to reflect current form. Sprint and Route FPS (Foot Per Second) measure pace efficiency over the horse's recent sprints and routes respectively. Grading scale: A = elite • B = above average • C = average • D = below average • F = poor • — = no data |
||
| Speed | A | A |
| Early Pace | C | A |
| Mid Pace | B | A |
| Late Pace | A | A |
| Sprint FPS | C | A |
| Route FPS | B | A |
| Trainer Effectiveness | A | A |
| Jockey Effectiveness | A | A |
| 3rd Party Ratings | A | A |
| Predictions
AI-generated projections for the upcoming race, derived from prior AI analysis for speed and pace trends, surface and distance suitability, and current conditions. Grading scale: A = elite • B = above average • C = average • D = below average • F = poor • — = no data |
||
| Speed | A | B |
| Early Pace | A | A |
| Mid Pace | A | A |
| Late Pace | C | C |
AI Model History Guide
What it shows: How our AI models rated this horse in each of its recent races, compared with how they rate today’s field (the dashed lines).
What to look for: Lines that are rising and sit above the dashed field averages — the models have liked this horse and still do. Falling lines, or lines below the dashed ones, mean the models are cooling on it.
- Lines
- Each solid line shows this horse’s model score over its last 10 races: blue = Mod1, green = Mod2, amber = Mod3.
- Dashed Lines
- Dashed lines represent the current race’s field average for each model — a score below the dashed line indicates the horse ranked below average in this model’s assessment.
- Higher is Stronger
- All three model scores are 0–100: a higher number means the model rates this horse more favorably among the field.
Mod1(W): 82 (1/8) Mod2(W): 75 (2/8) Mod3(W): 79 (3/8) Mod1-LS: 55 (6/8) Win Prob: 18.4% Value Score: 1.35 ★
Performance vs. Peers Guide
What it shows: Each horse’s career, last-3-race and last-race performance side by side, against the field average.
What to look for: Horses above the field average whose last race is green (better than their average) and whose trend line rises — improving form. Red last races and falling lines point to declining form.
- Bars (per post)
- Blue = avg career performance • Amber = avg last 3 races • Green = last race (improved vs. avg) • Red = last race (declined vs. avg)
- Trend Line
- Angled line above the bars: rising = improving form • falling = declining form.
- Horizontal Line
- Field average — the mean career performance of all horses in this race.
- Color Circles
- Standard post-position colors below each lane — same as the Total Pace chart.
- Border
- Thicker border = this horse’s post position.
Figure Comparison
What it shows: This horse’s ratings, speed figures and pace figures next to every other horse in the race.
What to look for: Where this horse (the darker column) leads the field or falls short. Strong ratings plus strong recent speed make a contender; recent speed well above career speed suggests improving form.
- Rating
- The three Pick Pony algorithm ratings (Algo 1, Algo 2, Algo 3) that make up the overall PP AI Rating — higher is a stronger contender rating.
- Speed
- Career average speed, recent 3-race average, and last-race speed figure — spot horses in improving or declining form.
- Pace
- Average Early (E1), Mid (E2), and Stretch (LP) pace figures — reveals pace-setters vs. closers vs. all-the-way types.
- This horse
- The horse whose stats card is open is highlighted with a darker column background.
Winning Profiles
What it shows: Each horse’s win rate and in-the-money rate over its last 10 starts, one dot per horse.
What to look for: Dots in the top-right are consistent winners. Top-left horses often finish in the money but rarely win — better for place and show bets or underneath in exotics. Bottom-left horses rarely finish well.
- Axes
- X: Win % from last 10 starts — Y: In-the-money % (top-3 finishes) from last 10 starts.
- Quadrants
- Consistent Winners (top-right): high win & ITM — reliable performers.
Place Threats (top-left): boards often but doesn’t win often — good exacta/trifecta angles.
Streaky (bottom-right): wins occasionally, misses the board often — all-or-nothing.
Developing (bottom-left): still finding form — longshot territory. - Reference Lines
- Dashed lines mark field averages. Dots to the right win more; dots higher board more.
- This horse
- Highlighted with a gold border and larger dot.
AI Model Comparison
What it shows: All AI model scores for every horse in the race, grouped by what each model is trained to find.
What to look for: The horse leading the green winner models is the models’ likely winner. A horse that stands out in the red longshot models but not the green ones is a longshot the models think is underrated.
- Winner Models (green)
- Mod1(W), Mod2(W), and Mod3(W) trained to predict race winners. Higher score = stronger contender.
- Longshot Models (red)
- Mod1-LS, Mod2-LS, and Mod3-LS trained to find high-value longshots. Higher score = stronger longshot candidate.
- Form Model (blue)
- Mod4 sequence model trained on recent form patterns. Higher score = stronger recent form profile.
- This horse
- Highlighted with a darker column background.
Race Pace Simulation Guide
What it shows: A simulated run of today’s race, based on each horse’s running style, post position and the expected pace.
What to look for: Who gets the lead, who gets boxed in, and who is gaining at the finish. Move the track-bias slider to see how the predicted order changes on a speed-favouring or closer-favouring track.
- Slider
- Drag left→right to advance from gate to finish. Drag all the way back to reset the race.
- Predicted Finish Order
- Factors in contested pace burn, each horse’s effort curve (peaked-early vs. peaked-late), and wide trip cost from outside posts. Updated live when Track Bias changes.
- Pace Scenario
- Lone Speed: single E horse likely rates and holds. Contested: two E horses burn each other — closers benefit. Hot Pace: speed meltdown, deep closers thrive. Soft: no early speed, moderate fractions throughout.
- Track Bias
- Slider below canvas. −2 = strong closer/wet bias; +2 = strong speed/rail bias. Recomputes the predicted finish order.
- Boxed Indicator
- Dashed orange ring = horse is surrounded (rival ahead, rival behind, wall outside). In a real race this horse must find a clear path to run.
- Running Styles
- E/EE = early speed (rushes to rail). P = presser (stalks the pace). S = stalker. SS = slow starter / closer.
| Stat | vs. Current Card | vs. All Horses |
|---|---|---|
| Averages
Career-average metrics across all AI race analysis. Performance and pace averages reflect estimated historical performance; trainer and jockey grades score in-the-money percentages. Grading scale: A = elite • B = above average • C = average • D = below average • F = poor • — = no data |
||
| Pick Pony AI Rating | C | F |
| Pace Trip Longshot | — | — |
| Connections Longshot | — | — |
| Situational Longshot | — | — |
| Speed | C | F |
| Early Pace | C | F |
| Mid Pace | C | F |
| Late Pace | C | F |
| Finish Pos | C | A |
| Dirt Speed | C | F |
| Turf Speed | C | D |
| Distance Speed | C | F |
| Trainer Effectiveness | F | D |
| Jockey Effectiveness | F | F |
| 3rd Party Ratings | C | F |
| Recent
Performance analysis from the horse's recent races, weighted to reflect current form. Sprint and Route FPS (Foot Per Second) measure pace efficiency over the horse's recent sprints and routes respectively. Grading scale: A = elite • B = above average • C = average • D = below average • F = poor • — = no data |
||
| Speed | C | F |
| Early Pace | C | F |
| Mid Pace | C | F |
| Late Pace | C | F |
| Sprint FPS | C | F |
| Route FPS | C | F |
| Trainer Effectiveness | F | D |
| Jockey Effectiveness | F | F |
| 3rd Party Ratings | C | F |
| Predictions
AI-generated projections for the upcoming race, derived from prior AI analysis for speed and pace trends, surface and distance suitability, and current conditions. Grading scale: A = elite • B = above average • C = average • D = below average • F = poor • — = no data |
||
| Speed | C | F |
| Early Pace | C | F |
| Mid Pace | C | F |
| Late Pace | C | C |
AI Model History Guide
What it shows: How our AI models rated this horse in each of its recent races, compared with how they rate today’s field (the dashed lines).
What to look for: Lines that are rising and sit above the dashed field averages — the models have liked this horse and still do. Falling lines, or lines below the dashed ones, mean the models are cooling on it.
- Lines
- Each solid line shows this horse’s model score over its last 10 races: blue = Mod1, green = Mod2, amber = Mod3.
- Dashed Lines
- Dashed lines represent the current race’s field average for each model — a score below the dashed line indicates the horse ranked below average in this model’s assessment.
- Higher is Stronger
- All three model scores are 0–100: a higher number means the model rates this horse more favorably among the field.
Mod1(W): 82 (1/8) Mod2(W): 75 (2/8) Mod3(W): 79 (3/8) Mod1-LS: 55 (6/8) Win Prob: 18.4% Value Score: 1.35 ★
Performance vs. Peers Guide
What it shows: Each horse’s career, last-3-race and last-race performance side by side, against the field average.
What to look for: Horses above the field average whose last race is green (better than their average) and whose trend line rises — improving form. Red last races and falling lines point to declining form.
- Bars (per post)
- Blue = avg career performance • Amber = avg last 3 races • Green = last race (improved vs. avg) • Red = last race (declined vs. avg)
- Trend Line
- Angled line above the bars: rising = improving form • falling = declining form.
- Horizontal Line
- Field average — the mean career performance of all horses in this race.
- Color Circles
- Standard post-position colors below each lane — same as the Total Pace chart.
- Border
- Thicker border = this horse’s post position.
Figure Comparison
What it shows: This horse’s ratings, speed figures and pace figures next to every other horse in the race.
What to look for: Where this horse (the darker column) leads the field or falls short. Strong ratings plus strong recent speed make a contender; recent speed well above career speed suggests improving form.
- Rating
- The three Pick Pony algorithm ratings (Algo 1, Algo 2, Algo 3) that make up the overall PP AI Rating — higher is a stronger contender rating.
- Speed
- Career average speed, recent 3-race average, and last-race speed figure — spot horses in improving or declining form.
- Pace
- Average Early (E1), Mid (E2), and Stretch (LP) pace figures — reveals pace-setters vs. closers vs. all-the-way types.
- This horse
- The horse whose stats card is open is highlighted with a darker column background.
Winning Profiles
What it shows: Each horse’s win rate and in-the-money rate over its last 10 starts, one dot per horse.
What to look for: Dots in the top-right are consistent winners. Top-left horses often finish in the money but rarely win — better for place and show bets or underneath in exotics. Bottom-left horses rarely finish well.
- Axes
- X: Win % from last 10 starts — Y: In-the-money % (top-3 finishes) from last 10 starts.
- Quadrants
- Consistent Winners (top-right): high win & ITM — reliable performers.
Place Threats (top-left): boards often but doesn’t win often — good exacta/trifecta angles.
Streaky (bottom-right): wins occasionally, misses the board often — all-or-nothing.
Developing (bottom-left): still finding form — longshot territory. - Reference Lines
- Dashed lines mark field averages. Dots to the right win more; dots higher board more.
- This horse
- Highlighted with a gold border and larger dot.
AI Model Comparison
What it shows: All AI model scores for every horse in the race, grouped by what each model is trained to find.
What to look for: The horse leading the green winner models is the models’ likely winner. A horse that stands out in the red longshot models but not the green ones is a longshot the models think is underrated.
- Winner Models (green)
- Mod1(W), Mod2(W), and Mod3(W) trained to predict race winners. Higher score = stronger contender.
- Longshot Models (red)
- Mod1-LS, Mod2-LS, and Mod3-LS trained to find high-value longshots. Higher score = stronger longshot candidate.
- Form Model (blue)
- Mod4 sequence model trained on recent form patterns. Higher score = stronger recent form profile.
- This horse
- Highlighted with a darker column background.
Race Pace Simulation Guide
What it shows: A simulated run of today’s race, based on each horse’s running style, post position and the expected pace.
What to look for: Who gets the lead, who gets boxed in, and who is gaining at the finish. Move the track-bias slider to see how the predicted order changes on a speed-favouring or closer-favouring track.
- Slider
- Drag left→right to advance from gate to finish. Drag all the way back to reset the race.
- Predicted Finish Order
- Factors in contested pace burn, each horse’s effort curve (peaked-early vs. peaked-late), and wide trip cost from outside posts. Updated live when Track Bias changes.
- Pace Scenario
- Lone Speed: single E horse likely rates and holds. Contested: two E horses burn each other — closers benefit. Hot Pace: speed meltdown, deep closers thrive. Soft: no early speed, moderate fractions throughout.
- Track Bias
- Slider below canvas. −2 = strong closer/wet bias; +2 = strong speed/rail bias. Recomputes the predicted finish order.
- Boxed Indicator
- Dashed orange ring = horse is surrounded (rival ahead, rival behind, wall outside). In a real race this horse must find a clear path to run.
- Running Styles
- E/EE = early speed (rushes to rail). P = presser (stalks the pace). S = stalker. SS = slow starter / closer.
| Stat | vs. Current Card | vs. All Horses |
|---|---|---|
| Averages
Career-average metrics across all AI race analysis. Performance and pace averages reflect estimated historical performance; trainer and jockey grades score in-the-money percentages. Grading scale: A = elite • B = above average • C = average • D = below average • F = poor • — = no data |
||
| Pick Pony AI Rating | C | F |
| Pace Trip Longshot | — | — |
| Connections Longshot | — | — |
| Situational Longshot | — | — |
| Speed | C | F |
| Early Pace | C | F |
| Mid Pace | C | F |
| Late Pace | C | F |
| Finish Pos | C | A |
| Dirt Speed | C | F |
| Turf Speed | C | D |
| Distance Speed | C | F |
| Trainer Effectiveness | C | C |
| Jockey Effectiveness | D | F |
| 3rd Party Ratings | C | F |
| Recent
Performance analysis from the horse's recent races, weighted to reflect current form. Sprint and Route FPS (Foot Per Second) measure pace efficiency over the horse's recent sprints and routes respectively. Grading scale: A = elite • B = above average • C = average • D = below average • F = poor • — = no data |
||
| Speed | C | F |
| Early Pace | C | F |
| Mid Pace | C | F |
| Late Pace | C | F |
| Sprint FPS | C | F |
| Route FPS | C | F |
| Trainer Effectiveness | C | C |
| Jockey Effectiveness | D | F |
| 3rd Party Ratings | C | F |
| Predictions
AI-generated projections for the upcoming race, derived from prior AI analysis for speed and pace trends, surface and distance suitability, and current conditions. Grading scale: A = elite • B = above average • C = average • D = below average • F = poor • — = no data |
||
| Speed | C | F |
| Early Pace | C | F |
| Mid Pace | C | F |
| Late Pace | C | C |
AI Model History Guide
What it shows: How our AI models rated this horse in each of its recent races, compared with how they rate today’s field (the dashed lines).
What to look for: Lines that are rising and sit above the dashed field averages — the models have liked this horse and still do. Falling lines, or lines below the dashed ones, mean the models are cooling on it.
- Lines
- Each solid line shows this horse’s model score over its last 10 races: blue = Mod1, green = Mod2, amber = Mod3.
- Dashed Lines
- Dashed lines represent the current race’s field average for each model — a score below the dashed line indicates the horse ranked below average in this model’s assessment.
- Higher is Stronger
- All three model scores are 0–100: a higher number means the model rates this horse more favorably among the field.
Mod1(W): 82 (1/8) Mod2(W): 75 (2/8) Mod3(W): 79 (3/8) Mod1-LS: 55 (6/8) Win Prob: 18.4% Value Score: 1.35 ★
Performance vs. Peers Guide
What it shows: Each horse’s career, last-3-race and last-race performance side by side, against the field average.
What to look for: Horses above the field average whose last race is green (better than their average) and whose trend line rises — improving form. Red last races and falling lines point to declining form.
- Bars (per post)
- Blue = avg career performance • Amber = avg last 3 races • Green = last race (improved vs. avg) • Red = last race (declined vs. avg)
- Trend Line
- Angled line above the bars: rising = improving form • falling = declining form.
- Horizontal Line
- Field average — the mean career performance of all horses in this race.
- Color Circles
- Standard post-position colors below each lane — same as the Total Pace chart.
- Border
- Thicker border = this horse’s post position.
Figure Comparison
What it shows: This horse’s ratings, speed figures and pace figures next to every other horse in the race.
What to look for: Where this horse (the darker column) leads the field or falls short. Strong ratings plus strong recent speed make a contender; recent speed well above career speed suggests improving form.
- Rating
- The three Pick Pony algorithm ratings (Algo 1, Algo 2, Algo 3) that make up the overall PP AI Rating — higher is a stronger contender rating.
- Speed
- Career average speed, recent 3-race average, and last-race speed figure — spot horses in improving or declining form.
- Pace
- Average Early (E1), Mid (E2), and Stretch (LP) pace figures — reveals pace-setters vs. closers vs. all-the-way types.
- This horse
- The horse whose stats card is open is highlighted with a darker column background.
Winning Profiles
What it shows: Each horse’s win rate and in-the-money rate over its last 10 starts, one dot per horse.
What to look for: Dots in the top-right are consistent winners. Top-left horses often finish in the money but rarely win — better for place and show bets or underneath in exotics. Bottom-left horses rarely finish well.
- Axes
- X: Win % from last 10 starts — Y: In-the-money % (top-3 finishes) from last 10 starts.
- Quadrants
- Consistent Winners (top-right): high win & ITM — reliable performers.
Place Threats (top-left): boards often but doesn’t win often — good exacta/trifecta angles.
Streaky (bottom-right): wins occasionally, misses the board often — all-or-nothing.
Developing (bottom-left): still finding form — longshot territory. - Reference Lines
- Dashed lines mark field averages. Dots to the right win more; dots higher board more.
- This horse
- Highlighted with a gold border and larger dot.
AI Model Comparison
What it shows: All AI model scores for every horse in the race, grouped by what each model is trained to find.
What to look for: The horse leading the green winner models is the models’ likely winner. A horse that stands out in the red longshot models but not the green ones is a longshot the models think is underrated.
- Winner Models (green)
- Mod1(W), Mod2(W), and Mod3(W) trained to predict race winners. Higher score = stronger contender.
- Longshot Models (red)
- Mod1-LS, Mod2-LS, and Mod3-LS trained to find high-value longshots. Higher score = stronger longshot candidate.
- Form Model (blue)
- Mod4 sequence model trained on recent form patterns. Higher score = stronger recent form profile.
- This horse
- Highlighted with a darker column background.
Race Pace Simulation Guide
What it shows: A simulated run of today’s race, based on each horse’s running style, post position and the expected pace.
What to look for: Who gets the lead, who gets boxed in, and who is gaining at the finish. Move the track-bias slider to see how the predicted order changes on a speed-favouring or closer-favouring track.
- Slider
- Drag left→right to advance from gate to finish. Drag all the way back to reset the race.
- Predicted Finish Order
- Factors in contested pace burn, each horse’s effort curve (peaked-early vs. peaked-late), and wide trip cost from outside posts. Updated live when Track Bias changes.
- Pace Scenario
- Lone Speed: single E horse likely rates and holds. Contested: two E horses burn each other — closers benefit. Hot Pace: speed meltdown, deep closers thrive. Soft: no early speed, moderate fractions throughout.
- Track Bias
- Slider below canvas. −2 = strong closer/wet bias; +2 = strong speed/rail bias. Recomputes the predicted finish order.
- Boxed Indicator
- Dashed orange ring = horse is surrounded (rival ahead, rival behind, wall outside). In a real race this horse must find a clear path to run.
- Running Styles
- E/EE = early speed (rushes to rail). P = presser (stalks the pace). S = stalker. SS = slow starter / closer.
| Stat | vs. Current Card | vs. All Horses |
|---|---|---|
| Averages
Career-average metrics across all AI race analysis. Performance and pace averages reflect estimated historical performance; trainer and jockey grades score in-the-money percentages. Grading scale: A = elite • B = above average • C = average • D = below average • F = poor • — = no data |
||
| Pick Pony AI Rating | C | F |
| Pace Trip Longshot | — | — |
| Connections Longshot | — | — |
| Situational Longshot | — | — |
| Speed | C | F |
| Early Pace | C | F |
| Mid Pace | C | F |
| Late Pace | C | F |
| Finish Pos | C | A |
| Dirt Speed | C | F |
| Turf Speed | C | D |
| Distance Speed | C | F |
| Trainer Effectiveness | A | A |
| Jockey Effectiveness | B | B |
| 3rd Party Ratings | C | F |
| Recent
Performance analysis from the horse's recent races, weighted to reflect current form. Sprint and Route FPS (Foot Per Second) measure pace efficiency over the horse's recent sprints and routes respectively. Grading scale: A = elite • B = above average • C = average • D = below average • F = poor • — = no data |
||
| Speed | C | F |
| Early Pace | C | F |
| Mid Pace | C | F |
| Late Pace | C | F |
| Sprint FPS | C | F |
| Route FPS | C | F |
| Trainer Effectiveness | A | A |
| Jockey Effectiveness | B | B |
| 3rd Party Ratings | C | F |
| Predictions
AI-generated projections for the upcoming race, derived from prior AI analysis for speed and pace trends, surface and distance suitability, and current conditions. Grading scale: A = elite • B = above average • C = average • D = below average • F = poor • — = no data |
||
| Speed | C | F |
| Early Pace | C | F |
| Mid Pace | C | F |
| Late Pace | C | C |
AI Model History Guide
What it shows: How our AI models rated this horse in each of its recent races, compared with how they rate today’s field (the dashed lines).
What to look for: Lines that are rising and sit above the dashed field averages — the models have liked this horse and still do. Falling lines, or lines below the dashed ones, mean the models are cooling on it.
- Lines
- Each solid line shows this horse’s model score over its last 10 races: blue = Mod1, green = Mod2, amber = Mod3.
- Dashed Lines
- Dashed lines represent the current race’s field average for each model — a score below the dashed line indicates the horse ranked below average in this model’s assessment.
- Higher is Stronger
- All three model scores are 0–100: a higher number means the model rates this horse more favorably among the field.
Mod1(W): 82 (1/8) Mod2(W): 75 (2/8) Mod3(W): 79 (3/8) Mod1-LS: 55 (6/8) Win Prob: 18.4% Value Score: 1.35 ★
Performance vs. Peers Guide
What it shows: Each horse’s career, last-3-race and last-race performance side by side, against the field average.
What to look for: Horses above the field average whose last race is green (better than their average) and whose trend line rises — improving form. Red last races and falling lines point to declining form.
- Bars (per post)
- Blue = avg career performance • Amber = avg last 3 races • Green = last race (improved vs. avg) • Red = last race (declined vs. avg)
- Trend Line
- Angled line above the bars: rising = improving form • falling = declining form.
- Horizontal Line
- Field average — the mean career performance of all horses in this race.
- Color Circles
- Standard post-position colors below each lane — same as the Total Pace chart.
- Border
- Thicker border = this horse’s post position.
Figure Comparison
What it shows: This horse’s ratings, speed figures and pace figures next to every other horse in the race.
What to look for: Where this horse (the darker column) leads the field or falls short. Strong ratings plus strong recent speed make a contender; recent speed well above career speed suggests improving form.
- Rating
- The three Pick Pony algorithm ratings (Algo 1, Algo 2, Algo 3) that make up the overall PP AI Rating — higher is a stronger contender rating.
- Speed
- Career average speed, recent 3-race average, and last-race speed figure — spot horses in improving or declining form.
- Pace
- Average Early (E1), Mid (E2), and Stretch (LP) pace figures — reveals pace-setters vs. closers vs. all-the-way types.
- This horse
- The horse whose stats card is open is highlighted with a darker column background.
Winning Profiles
What it shows: Each horse’s win rate and in-the-money rate over its last 10 starts, one dot per horse.
What to look for: Dots in the top-right are consistent winners. Top-left horses often finish in the money but rarely win — better for place and show bets or underneath in exotics. Bottom-left horses rarely finish well.
- Axes
- X: Win % from last 10 starts — Y: In-the-money % (top-3 finishes) from last 10 starts.
- Quadrants
- Consistent Winners (top-right): high win & ITM — reliable performers.
Place Threats (top-left): boards often but doesn’t win often — good exacta/trifecta angles.
Streaky (bottom-right): wins occasionally, misses the board often — all-or-nothing.
Developing (bottom-left): still finding form — longshot territory. - Reference Lines
- Dashed lines mark field averages. Dots to the right win more; dots higher board more.
- This horse
- Highlighted with a gold border and larger dot.
AI Model Comparison
What it shows: All AI model scores for every horse in the race, grouped by what each model is trained to find.
What to look for: The horse leading the green winner models is the models’ likely winner. A horse that stands out in the red longshot models but not the green ones is a longshot the models think is underrated.
- Winner Models (green)
- Mod1(W), Mod2(W), and Mod3(W) trained to predict race winners. Higher score = stronger contender.
- Longshot Models (red)
- Mod1-LS, Mod2-LS, and Mod3-LS trained to find high-value longshots. Higher score = stronger longshot candidate.
- Form Model (blue)
- Mod4 sequence model trained on recent form patterns. Higher score = stronger recent form profile.
- This horse
- Highlighted with a darker column background.
Race Pace Simulation Guide
What it shows: A simulated run of today’s race, based on each horse’s running style, post position and the expected pace.
What to look for: Who gets the lead, who gets boxed in, and who is gaining at the finish. Move the track-bias slider to see how the predicted order changes on a speed-favouring or closer-favouring track.
- Slider
- Drag left→right to advance from gate to finish. Drag all the way back to reset the race.
- Predicted Finish Order
- Factors in contested pace burn, each horse’s effort curve (peaked-early vs. peaked-late), and wide trip cost from outside posts. Updated live when Track Bias changes.
- Pace Scenario
- Lone Speed: single E horse likely rates and holds. Contested: two E horses burn each other — closers benefit. Hot Pace: speed meltdown, deep closers thrive. Soft: no early speed, moderate fractions throughout.
- Track Bias
- Slider below canvas. −2 = strong closer/wet bias; +2 = strong speed/rail bias. Recomputes the predicted finish order.
- Boxed Indicator
- Dashed orange ring = horse is surrounded (rival ahead, rival behind, wall outside). In a real race this horse must find a clear path to run.
- Running Styles
- E/EE = early speed (rushes to rail). P = presser (stalks the pace). S = stalker. SS = slow starter / closer.
| Stat | vs. Current Card | vs. All Horses |
|---|---|---|
| Averages
Career-average metrics across all AI race analysis. Performance and pace averages reflect estimated historical performance; trainer and jockey grades score in-the-money percentages. Grading scale: A = elite • B = above average • C = average • D = below average • F = poor • — = no data |
||
| Pick Pony AI Rating | C | F |
| Pace Trip Longshot | — | — |
| Connections Longshot | — | — |
| Situational Longshot | — | — |
| Speed | C | F |
| Early Pace | C | F |
| Mid Pace | C | F |
| Late Pace | C | F |
| Finish Pos | C | A |
| Dirt Speed | C | F |
| Turf Speed | C | D |
| Distance Speed | C | F |
| Trainer Effectiveness | B | B |
| Jockey Effectiveness | A | B |
| 3rd Party Ratings | C | F |
| Recent
Performance analysis from the horse's recent races, weighted to reflect current form. Sprint and Route FPS (Foot Per Second) measure pace efficiency over the horse's recent sprints and routes respectively. Grading scale: A = elite • B = above average • C = average • D = below average • F = poor • — = no data |
||
| Speed | C | F |
| Early Pace | C | F |
| Mid Pace | C | F |
| Late Pace | C | F |
| Sprint FPS | C | F |
| Route FPS | C | F |
| Trainer Effectiveness | B | B |
| Jockey Effectiveness | A | B |
| 3rd Party Ratings | C | F |
| Predictions
AI-generated projections for the upcoming race, derived from prior AI analysis for speed and pace trends, surface and distance suitability, and current conditions. Grading scale: A = elite • B = above average • C = average • D = below average • F = poor • — = no data |
||
| Speed | C | F |
| Early Pace | C | F |
| Mid Pace | C | F |
| Late Pace | C | C |
AI Model History Guide
What it shows: How our AI models rated this horse in each of its recent races, compared with how they rate today’s field (the dashed lines).
What to look for: Lines that are rising and sit above the dashed field averages — the models have liked this horse and still do. Falling lines, or lines below the dashed ones, mean the models are cooling on it.
- Lines
- Each solid line shows this horse’s model score over its last 10 races: blue = Mod1, green = Mod2, amber = Mod3.
- Dashed Lines
- Dashed lines represent the current race’s field average for each model — a score below the dashed line indicates the horse ranked below average in this model’s assessment.
- Higher is Stronger
- All three model scores are 0–100: a higher number means the model rates this horse more favorably among the field.
Mod1(W): 82 (1/8) Mod2(W): 75 (2/8) Mod3(W): 79 (3/8) Mod1-LS: 55 (6/8) Win Prob: 18.4% Value Score: 1.35 ★
Performance vs. Peers Guide
What it shows: Each horse’s career, last-3-race and last-race performance side by side, against the field average.
What to look for: Horses above the field average whose last race is green (better than their average) and whose trend line rises — improving form. Red last races and falling lines point to declining form.
- Bars (per post)
- Blue = avg career performance • Amber = avg last 3 races • Green = last race (improved vs. avg) • Red = last race (declined vs. avg)
- Trend Line
- Angled line above the bars: rising = improving form • falling = declining form.
- Horizontal Line
- Field average — the mean career performance of all horses in this race.
- Color Circles
- Standard post-position colors below each lane — same as the Total Pace chart.
- Border
- Thicker border = this horse’s post position.
Figure Comparison
What it shows: This horse’s ratings, speed figures and pace figures next to every other horse in the race.
What to look for: Where this horse (the darker column) leads the field or falls short. Strong ratings plus strong recent speed make a contender; recent speed well above career speed suggests improving form.
- Rating
- The three Pick Pony algorithm ratings (Algo 1, Algo 2, Algo 3) that make up the overall PP AI Rating — higher is a stronger contender rating.
- Speed
- Career average speed, recent 3-race average, and last-race speed figure — spot horses in improving or declining form.
- Pace
- Average Early (E1), Mid (E2), and Stretch (LP) pace figures — reveals pace-setters vs. closers vs. all-the-way types.
- This horse
- The horse whose stats card is open is highlighted with a darker column background.
Winning Profiles
What it shows: Each horse’s win rate and in-the-money rate over its last 10 starts, one dot per horse.
What to look for: Dots in the top-right are consistent winners. Top-left horses often finish in the money but rarely win — better for place and show bets or underneath in exotics. Bottom-left horses rarely finish well.
- Axes
- X: Win % from last 10 starts — Y: In-the-money % (top-3 finishes) from last 10 starts.
- Quadrants
- Consistent Winners (top-right): high win & ITM — reliable performers.
Place Threats (top-left): boards often but doesn’t win often — good exacta/trifecta angles.
Streaky (bottom-right): wins occasionally, misses the board often — all-or-nothing.
Developing (bottom-left): still finding form — longshot territory. - Reference Lines
- Dashed lines mark field averages. Dots to the right win more; dots higher board more.
- This horse
- Highlighted with a gold border and larger dot.
AI Model Comparison
What it shows: All AI model scores for every horse in the race, grouped by what each model is trained to find.
What to look for: The horse leading the green winner models is the models’ likely winner. A horse that stands out in the red longshot models but not the green ones is a longshot the models think is underrated.
- Winner Models (green)
- Mod1(W), Mod2(W), and Mod3(W) trained to predict race winners. Higher score = stronger contender.
- Longshot Models (red)
- Mod1-LS, Mod2-LS, and Mod3-LS trained to find high-value longshots. Higher score = stronger longshot candidate.
- Form Model (blue)
- Mod4 sequence model trained on recent form patterns. Higher score = stronger recent form profile.
- This horse
- Highlighted with a darker column background.
Race Pace Simulation Guide
What it shows: A simulated run of today’s race, based on each horse’s running style, post position and the expected pace.
What to look for: Who gets the lead, who gets boxed in, and who is gaining at the finish. Move the track-bias slider to see how the predicted order changes on a speed-favouring or closer-favouring track.
- Slider
- Drag left→right to advance from gate to finish. Drag all the way back to reset the race.
- Predicted Finish Order
- Factors in contested pace burn, each horse’s effort curve (peaked-early vs. peaked-late), and wide trip cost from outside posts. Updated live when Track Bias changes.
- Pace Scenario
- Lone Speed: single E horse likely rates and holds. Contested: two E horses burn each other — closers benefit. Hot Pace: speed meltdown, deep closers thrive. Soft: no early speed, moderate fractions throughout.
- Track Bias
- Slider below canvas. −2 = strong closer/wet bias; +2 = strong speed/rail bias. Recomputes the predicted finish order.
- Boxed Indicator
- Dashed orange ring = horse is surrounded (rival ahead, rival behind, wall outside). In a real race this horse must find a clear path to run.
- Running Styles
- E/EE = early speed (rushes to rail). P = presser (stalks the pace). S = stalker. SS = slow starter / closer.
| Stat | vs. Current Card | vs. All Horses |
|---|---|---|
| Averages
Career-average metrics across all AI race analysis. Performance and pace averages reflect estimated historical performance; trainer and jockey grades score in-the-money percentages. Grading scale: A = elite • B = above average • C = average • D = below average • F = poor • — = no data |
||
| Pick Pony AI Rating | C | F |
| Pace Trip Longshot | — | — |
| Connections Longshot | — | — |
| Situational Longshot | — | — |
| Speed | C | F |
| Early Pace | C | F |
| Mid Pace | C | F |
| Late Pace | C | F |
| Finish Pos | C | A |
| Dirt Speed | C | F |
| Turf Speed | C | D |
| Distance Speed | C | F |
| Trainer Effectiveness | C | B |
| Jockey Effectiveness | C | C |
| 3rd Party Ratings | C | F |
| Recent
Performance analysis from the horse's recent races, weighted to reflect current form. Sprint and Route FPS (Foot Per Second) measure pace efficiency over the horse's recent sprints and routes respectively. Grading scale: A = elite • B = above average • C = average • D = below average • F = poor • — = no data |
||
| Speed | C | F |
| Early Pace | C | F |
| Mid Pace | C | F |
| Late Pace | C | F |
| Sprint FPS | C | F |
| Route FPS | C | F |
| Trainer Effectiveness | C | B |
| Jockey Effectiveness | C | C |
| 3rd Party Ratings | C | F |
| Predictions
AI-generated projections for the upcoming race, derived from prior AI analysis for speed and pace trends, surface and distance suitability, and current conditions. Grading scale: A = elite • B = above average • C = average • D = below average • F = poor • — = no data |
||
| Speed | C | F |
| Early Pace | C | F |
| Mid Pace | C | F |
| Late Pace | C | C |
Chart Guide (2.0.41)
What it shows: This horse’s recent races, one bubble per race, plotted by its AI speed figure against the class par for today’s race (the dashed line).
What to look for: Recent bubbles at or above the dashed line, a trend line angled up, and a narrow shaded band (steady form). Check whether the good runs came on today’s surface and distance.
- Bubbles
- Color = surface: green (turf), brown (dirt), blue (synthetic)
- Top number = finishing position; bottom number in parentheses = starting post position
- Height above line = beaten lengths — closer means a smaller margin
- Border = track conditions: green (FST/GD/FM), yellow (WF/SL/YLD), red (SY/MY/FRZ/SFT/HVY)
- Connecting Line
- Solid = good conditions; dashed = bad conditions
- Line Symbol
- ▲ Triangle = sprint (7f or less); ● Circle = route (more than 7f)
- Days Between Races
- Small number above each bubble (e.g. 19d) = days since the previous race — helps spot freshness, layoffs, and tight scheduling.
- Shaded Band (Bollinger)
- Highlights volatility — a wider band means more variation in recent performance
- Performance Trend
- Straight line showing the overall performance direction — angled up = improving, angled down = declining
- Dashed Reference Line
- AI Opponent = AI analysis class-level par for the race
AI Model History Guide
What it shows: How our AI models rated this horse in each of its recent races, compared with how they rate today’s field (the dashed lines).
What to look for: Lines that are rising and sit above the dashed field averages — the models have liked this horse and still do. Falling lines, or lines below the dashed ones, mean the models are cooling on it.
- Lines
- Each solid line shows this horse’s model score over its last 10 races: blue = Mod1, green = Mod2, amber = Mod3.
- Dashed Lines
- Dashed lines represent the current race’s field average for each model — a score below the dashed line indicates the horse ranked below average in this model’s assessment.
- Higher is Stronger
- All three model scores are 0–100: a higher number means the model rates this horse more favorably among the field.
Mod1(W): 82 (1/8) Mod2(W): 75 (2/8) Mod3(W): 79 (3/8) Mod1-LS: 55 (6/8) Win Prob: 18.4% Value Score: 1.35 ★
Performance vs. Peers Guide
What it shows: Each horse’s career, last-3-race and last-race performance side by side, against the field average.
What to look for: Horses above the field average whose last race is green (better than their average) and whose trend line rises — improving form. Red last races and falling lines point to declining form.
- Bars (per post)
- Blue = avg career performance • Amber = avg last 3 races • Green = last race (improved vs. avg) • Red = last race (declined vs. avg)
- Trend Line
- Angled line above the bars: rising = improving form • falling = declining form.
- Horizontal Line
- Field average — the mean career performance of all horses in this race.
- Color Circles
- Standard post-position colors below each lane — same as the Total Pace chart.
- Border
- Thicker border = this horse’s post position.
Figure Comparison
What it shows: This horse’s ratings, speed figures and pace figures next to every other horse in the race.
What to look for: Where this horse (the darker column) leads the field or falls short. Strong ratings plus strong recent speed make a contender; recent speed well above career speed suggests improving form.
- Rating
- The three Pick Pony algorithm ratings (Algo 1, Algo 2, Algo 3) that make up the overall PP AI Rating — higher is a stronger contender rating.
- Speed
- Career average speed, recent 3-race average, and last-race speed figure — spot horses in improving or declining form.
- Pace
- Average Early (E1), Mid (E2), and Stretch (LP) pace figures — reveals pace-setters vs. closers vs. all-the-way types.
- This horse
- The horse whose stats card is open is highlighted with a darker column background.
Winning Profiles
What it shows: Each horse’s win rate and in-the-money rate over its last 10 starts, one dot per horse.
What to look for: Dots in the top-right are consistent winners. Top-left horses often finish in the money but rarely win — better for place and show bets or underneath in exotics. Bottom-left horses rarely finish well.
- Axes
- X: Win % from last 10 starts — Y: In-the-money % (top-3 finishes) from last 10 starts.
- Quadrants
- Consistent Winners (top-right): high win & ITM — reliable performers.
Place Threats (top-left): boards often but doesn’t win often — good exacta/trifecta angles.
Streaky (bottom-right): wins occasionally, misses the board often — all-or-nothing.
Developing (bottom-left): still finding form — longshot territory. - Reference Lines
- Dashed lines mark field averages. Dots to the right win more; dots higher board more.
- This horse
- Highlighted with a gold border and larger dot.
AI Model Comparison
What it shows: All AI model scores for every horse in the race, grouped by what each model is trained to find.
What to look for: The horse leading the green winner models is the models’ likely winner. A horse that stands out in the red longshot models but not the green ones is a longshot the models think is underrated.
- Winner Models (green)
- Mod1(W), Mod2(W), and Mod3(W) trained to predict race winners. Higher score = stronger contender.
- Longshot Models (red)
- Mod1-LS, Mod2-LS, and Mod3-LS trained to find high-value longshots. Higher score = stronger longshot candidate.
- Form Model (blue)
- Mod4 sequence model trained on recent form patterns. Higher score = stronger recent form profile.
- This horse
- Highlighted with a darker column background.
Race Pace Simulation Guide
What it shows: A simulated run of today’s race, based on each horse’s running style, post position and the expected pace.
What to look for: Who gets the lead, who gets boxed in, and who is gaining at the finish. Move the track-bias slider to see how the predicted order changes on a speed-favouring or closer-favouring track.
- Slider
- Drag left→right to advance from gate to finish. Drag all the way back to reset the race.
- Predicted Finish Order
- Factors in contested pace burn, each horse’s effort curve (peaked-early vs. peaked-late), and wide trip cost from outside posts. Updated live when Track Bias changes.
- Pace Scenario
- Lone Speed: single E horse likely rates and holds. Contested: two E horses burn each other — closers benefit. Hot Pace: speed meltdown, deep closers thrive. Soft: no early speed, moderate fractions throughout.
- Track Bias
- Slider below canvas. −2 = strong closer/wet bias; +2 = strong speed/rail bias. Recomputes the predicted finish order.
- Boxed Indicator
- Dashed orange ring = horse is surrounded (rival ahead, rival behind, wall outside). In a real race this horse must find a clear path to run.
- Running Styles
- E/EE = early speed (rushes to rail). P = presser (stalks the pace). S = stalker. SS = slow starter / closer.
| Stat | vs. Current Card | vs. All Horses |
|---|---|---|
| Averages
Career-average metrics across all AI race analysis. Performance and pace averages reflect estimated historical performance; trainer and jockey grades score in-the-money percentages. Grading scale: A = elite • B = above average • C = average • D = below average • F = poor • — = no data |
||
| Pick Pony AI Rating | A | C |
| Pace Trip Longshot | — | — |
| Connections Longshot | — | — |
| Situational Longshot | — | — |
| Speed | A | B |
| Early Pace | A | C |
| Mid Pace | A | C |
| Late Pace | A | B |
| Finish Pos | B | C |
| Dirt Speed | A | B |
| Turf Speed | C | C |
| Distance Speed | B | B |
| Trainer Effectiveness | B | C |
| Jockey Effectiveness | A | A |
| 3rd Party Ratings | A | B |
| Recent
Performance analysis from the horse's recent races, weighted to reflect current form. Sprint and Route FPS (Foot Per Second) measure pace efficiency over the horse's recent sprints and routes respectively. Grading scale: A = elite • B = above average • C = average • D = below average • F = poor • — = no data |
||
| Speed | A | B |
| Early Pace | A | C |
| Mid Pace | A | C |
| Late Pace | B | B |
| Sprint FPS | D | D |
| Route FPS | D | D |
| Trainer Effectiveness | B | C |
| Jockey Effectiveness | A | A |
| 3rd Party Ratings | A | B |
| Predictions
AI-generated projections for the upcoming race, derived from prior AI analysis for speed and pace trends, surface and distance suitability, and current conditions. Grading scale: A = elite • B = above average • C = average • D = below average • F = poor • — = no data |
||
| Speed | B | C |
| Early Pace | A | C |
| Mid Pace | A | C |
| Late Pace | C | C |
Chart Guide (2.0.41)
What it shows: This horse’s recent races, one bubble per race, plotted by its AI speed figure against the class par for today’s race (the dashed line).
What to look for: Recent bubbles at or above the dashed line, a trend line angled up, and a narrow shaded band (steady form). Check whether the good runs came on today’s surface and distance.
- Bubbles
- Color = surface: green (turf), brown (dirt), blue (synthetic)
- Top number = finishing position; bottom number in parentheses = starting post position
- Height above line = beaten lengths — closer means a smaller margin
- Border = track conditions: green (FST/GD/FM), yellow (WF/SL/YLD), red (SY/MY/FRZ/SFT/HVY)
- Connecting Line
- Solid = good conditions; dashed = bad conditions
- Line Symbol
- ▲ Triangle = sprint (7f or less); ● Circle = route (more than 7f)
- Days Between Races
- Small number above each bubble (e.g. 19d) = days since the previous race — helps spot freshness, layoffs, and tight scheduling.
- Shaded Band (Bollinger)
- Highlights volatility — a wider band means more variation in recent performance
- Performance Trend
- Straight line showing the overall performance direction — angled up = improving, angled down = declining
- Dashed Reference Line
- AI Opponent = AI analysis class-level par for the race
AI Model History Guide
What it shows: How our AI models rated this horse in each of its recent races, compared with how they rate today’s field (the dashed lines).
What to look for: Lines that are rising and sit above the dashed field averages — the models have liked this horse and still do. Falling lines, or lines below the dashed ones, mean the models are cooling on it.
- Lines
- Each solid line shows this horse’s model score over its last 10 races: blue = Mod1, green = Mod2, amber = Mod3.
- Dashed Lines
- Dashed lines represent the current race’s field average for each model — a score below the dashed line indicates the horse ranked below average in this model’s assessment.
- Higher is Stronger
- All three model scores are 0–100: a higher number means the model rates this horse more favorably among the field.
Mod1(W): 82 (1/8) Mod2(W): 75 (2/8) Mod3(W): 79 (3/8) Mod1-LS: 55 (6/8) Win Prob: 18.4% Value Score: 1.35 ★
Performance vs. Peers Guide
What it shows: Each horse’s career, last-3-race and last-race performance side by side, against the field average.
What to look for: Horses above the field average whose last race is green (better than their average) and whose trend line rises — improving form. Red last races and falling lines point to declining form.
- Bars (per post)
- Blue = avg career performance • Amber = avg last 3 races • Green = last race (improved vs. avg) • Red = last race (declined vs. avg)
- Trend Line
- Angled line above the bars: rising = improving form • falling = declining form.
- Horizontal Line
- Field average — the mean career performance of all horses in this race.
- Color Circles
- Standard post-position colors below each lane — same as the Total Pace chart.
- Border
- Thicker border = this horse’s post position.
Figure Comparison
What it shows: This horse’s ratings, speed figures and pace figures next to every other horse in the race.
What to look for: Where this horse (the darker column) leads the field or falls short. Strong ratings plus strong recent speed make a contender; recent speed well above career speed suggests improving form.
- Rating
- The three Pick Pony algorithm ratings (Algo 1, Algo 2, Algo 3) that make up the overall PP AI Rating — higher is a stronger contender rating.
- Speed
- Career average speed, recent 3-race average, and last-race speed figure — spot horses in improving or declining form.
- Pace
- Average Early (E1), Mid (E2), and Stretch (LP) pace figures — reveals pace-setters vs. closers vs. all-the-way types.
- This horse
- The horse whose stats card is open is highlighted with a darker column background.
Winning Profiles
What it shows: Each horse’s win rate and in-the-money rate over its last 10 starts, one dot per horse.
What to look for: Dots in the top-right are consistent winners. Top-left horses often finish in the money but rarely win — better for place and show bets or underneath in exotics. Bottom-left horses rarely finish well.
- Axes
- X: Win % from last 10 starts — Y: In-the-money % (top-3 finishes) from last 10 starts.
- Quadrants
- Consistent Winners (top-right): high win & ITM — reliable performers.
Place Threats (top-left): boards often but doesn’t win often — good exacta/trifecta angles.
Streaky (bottom-right): wins occasionally, misses the board often — all-or-nothing.
Developing (bottom-left): still finding form — longshot territory. - Reference Lines
- Dashed lines mark field averages. Dots to the right win more; dots higher board more.
- This horse
- Highlighted with a gold border and larger dot.
AI Model Comparison
What it shows: All AI model scores for every horse in the race, grouped by what each model is trained to find.
What to look for: The horse leading the green winner models is the models’ likely winner. A horse that stands out in the red longshot models but not the green ones is a longshot the models think is underrated.
- Winner Models (green)
- Mod1(W), Mod2(W), and Mod3(W) trained to predict race winners. Higher score = stronger contender.
- Longshot Models (red)
- Mod1-LS, Mod2-LS, and Mod3-LS trained to find high-value longshots. Higher score = stronger longshot candidate.
- Form Model (blue)
- Mod4 sequence model trained on recent form patterns. Higher score = stronger recent form profile.
- This horse
- Highlighted with a darker column background.
Race Pace Simulation Guide
What it shows: A simulated run of today’s race, based on each horse’s running style, post position and the expected pace.
What to look for: Who gets the lead, who gets boxed in, and who is gaining at the finish. Move the track-bias slider to see how the predicted order changes on a speed-favouring or closer-favouring track.
- Slider
- Drag left→right to advance from gate to finish. Drag all the way back to reset the race.
- Predicted Finish Order
- Factors in contested pace burn, each horse’s effort curve (peaked-early vs. peaked-late), and wide trip cost from outside posts. Updated live when Track Bias changes.
- Pace Scenario
- Lone Speed: single E horse likely rates and holds. Contested: two E horses burn each other — closers benefit. Hot Pace: speed meltdown, deep closers thrive. Soft: no early speed, moderate fractions throughout.
- Track Bias
- Slider below canvas. −2 = strong closer/wet bias; +2 = strong speed/rail bias. Recomputes the predicted finish order.
- Boxed Indicator
- Dashed orange ring = horse is surrounded (rival ahead, rival behind, wall outside). In a real race this horse must find a clear path to run.
- Running Styles
- E/EE = early speed (rushes to rail). P = presser (stalks the pace). S = stalker. SS = slow starter / closer.
| Stat | vs. Current Card | vs. All Horses |
|---|---|---|
| Averages
Career-average metrics across all AI race analysis. Performance and pace averages reflect estimated historical performance; trainer and jockey grades score in-the-money percentages. Grading scale: A = elite • B = above average • C = average • D = below average • F = poor • — = no data |
||
| Pick Pony AI Rating | C | D |
| Pace Trip Longshot | — | — |
| Connections Longshot | — | — |
| Situational Longshot | — | — |
| Speed | C | C |
| Early Pace | D | D |
| Mid Pace | D | D |
| Late Pace | C | B |
| Finish Pos | A | B |
| Dirt Speed | B | C |
| Turf Speed | B | B |
| Distance Speed | B | B |
| Trainer Effectiveness | D | D |
| Jockey Effectiveness | A | B |
| 3rd Party Ratings | A | C |
| Recent
Performance analysis from the horse's recent races, weighted to reflect current form. Sprint and Route FPS (Foot Per Second) measure pace efficiency over the horse's recent sprints and routes respectively. Grading scale: A = elite • B = above average • C = average • D = below average • F = poor • — = no data |
||
| Speed | A | B |
| Early Pace | F | D |
| Mid Pace | D | D |
| Late Pace | A | B |
| Sprint FPS | F | F |
| Route FPS | F | F |
| Trainer Effectiveness | D | D |
| Jockey Effectiveness | A | B |
| 3rd Party Ratings | A | C |
| Predictions
AI-generated projections for the upcoming race, derived from prior AI analysis for speed and pace trends, surface and distance suitability, and current conditions. Grading scale: A = elite • B = above average • C = average • D = below average • F = poor • — = no data |
||
| Speed | F | D |
| Early Pace | D | D |
| Mid Pace | F | D |
| Late Pace | C | C |
Chart Guide (2.0.41)
What it shows: This horse’s recent races, one bubble per race, plotted by its AI speed figure against the class par for today’s race (the dashed line).
What to look for: Recent bubbles at or above the dashed line, a trend line angled up, and a narrow shaded band (steady form). Check whether the good runs came on today’s surface and distance.
- Bubbles
- Color = surface: green (turf), brown (dirt), blue (synthetic)
- Top number = finishing position; bottom number in parentheses = starting post position
- Height above line = beaten lengths — closer means a smaller margin
- Border = track conditions: green (FST/GD/FM), yellow (WF/SL/YLD), red (SY/MY/FRZ/SFT/HVY)
- Connecting Line
- Solid = good conditions; dashed = bad conditions
- Line Symbol
- ▲ Triangle = sprint (7f or less); ● Circle = route (more than 7f)
- Days Between Races
- Small number above each bubble (e.g. 19d) = days since the previous race — helps spot freshness, layoffs, and tight scheduling.
- Shaded Band (Bollinger)
- Highlights volatility — a wider band means more variation in recent performance
- Performance Trend
- Straight line showing the overall performance direction — angled up = improving, angled down = declining
- Dashed Reference Line
- AI Opponent = AI analysis class-level par for the race
AI Model History Guide
What it shows: How our AI models rated this horse in each of its recent races, compared with how they rate today’s field (the dashed lines).
What to look for: Lines that are rising and sit above the dashed field averages — the models have liked this horse and still do. Falling lines, or lines below the dashed ones, mean the models are cooling on it.
- Lines
- Each solid line shows this horse’s model score over its last 10 races: blue = Mod1, green = Mod2, amber = Mod3.
- Dashed Lines
- Dashed lines represent the current race’s field average for each model — a score below the dashed line indicates the horse ranked below average in this model’s assessment.
- Higher is Stronger
- All three model scores are 0–100: a higher number means the model rates this horse more favorably among the field.
Mod1(W): 82 (1/8) Mod2(W): 75 (2/8) Mod3(W): 79 (3/8) Mod1-LS: 55 (6/8) Win Prob: 18.4% Value Score: 1.35 ★
Performance vs. Peers Guide
What it shows: Each horse’s career, last-3-race and last-race performance side by side, against the field average.
What to look for: Horses above the field average whose last race is green (better than their average) and whose trend line rises — improving form. Red last races and falling lines point to declining form.
- Bars (per post)
- Blue = avg career performance • Amber = avg last 3 races • Green = last race (improved vs. avg) • Red = last race (declined vs. avg)
- Trend Line
- Angled line above the bars: rising = improving form • falling = declining form.
- Horizontal Line
- Field average — the mean career performance of all horses in this race.
- Color Circles
- Standard post-position colors below each lane — same as the Total Pace chart.
- Border
- Thicker border = this horse’s post position.
Figure Comparison
What it shows: This horse’s ratings, speed figures and pace figures next to every other horse in the race.
What to look for: Where this horse (the darker column) leads the field or falls short. Strong ratings plus strong recent speed make a contender; recent speed well above career speed suggests improving form.
- Rating
- The three Pick Pony algorithm ratings (Algo 1, Algo 2, Algo 3) that make up the overall PP AI Rating — higher is a stronger contender rating.
- Speed
- Career average speed, recent 3-race average, and last-race speed figure — spot horses in improving or declining form.
- Pace
- Average Early (E1), Mid (E2), and Stretch (LP) pace figures — reveals pace-setters vs. closers vs. all-the-way types.
- This horse
- The horse whose stats card is open is highlighted with a darker column background.
Winning Profiles
What it shows: Each horse’s win rate and in-the-money rate over its last 10 starts, one dot per horse.
What to look for: Dots in the top-right are consistent winners. Top-left horses often finish in the money but rarely win — better for place and show bets or underneath in exotics. Bottom-left horses rarely finish well.
- Axes
- X: Win % from last 10 starts — Y: In-the-money % (top-3 finishes) from last 10 starts.
- Quadrants
- Consistent Winners (top-right): high win & ITM — reliable performers.
Place Threats (top-left): boards often but doesn’t win often — good exacta/trifecta angles.
Streaky (bottom-right): wins occasionally, misses the board often — all-or-nothing.
Developing (bottom-left): still finding form — longshot territory. - Reference Lines
- Dashed lines mark field averages. Dots to the right win more; dots higher board more.
- This horse
- Highlighted with a gold border and larger dot.
AI Model Comparison
What it shows: All AI model scores for every horse in the race, grouped by what each model is trained to find.
What to look for: The horse leading the green winner models is the models’ likely winner. A horse that stands out in the red longshot models but not the green ones is a longshot the models think is underrated.
- Winner Models (green)
- Mod1(W), Mod2(W), and Mod3(W) trained to predict race winners. Higher score = stronger contender.
- Longshot Models (red)
- Mod1-LS, Mod2-LS, and Mod3-LS trained to find high-value longshots. Higher score = stronger longshot candidate.
- Form Model (blue)
- Mod4 sequence model trained on recent form patterns. Higher score = stronger recent form profile.
- This horse
- Highlighted with a darker column background.
Race Pace Simulation Guide
What it shows: A simulated run of today’s race, based on each horse’s running style, post position and the expected pace.
What to look for: Who gets the lead, who gets boxed in, and who is gaining at the finish. Move the track-bias slider to see how the predicted order changes on a speed-favouring or closer-favouring track.
- Slider
- Drag left→right to advance from gate to finish. Drag all the way back to reset the race.
- Predicted Finish Order
- Factors in contested pace burn, each horse’s effort curve (peaked-early vs. peaked-late), and wide trip cost from outside posts. Updated live when Track Bias changes.
- Pace Scenario
- Lone Speed: single E horse likely rates and holds. Contested: two E horses burn each other — closers benefit. Hot Pace: speed meltdown, deep closers thrive. Soft: no early speed, moderate fractions throughout.
- Track Bias
- Slider below canvas. −2 = strong closer/wet bias; +2 = strong speed/rail bias. Recomputes the predicted finish order.
- Boxed Indicator
- Dashed orange ring = horse is surrounded (rival ahead, rival behind, wall outside). In a real race this horse must find a clear path to run.
- Running Styles
- E/EE = early speed (rushes to rail). P = presser (stalks the pace). S = stalker. SS = slow starter / closer.
| Stat | vs. Current Card | vs. All Horses |
|---|---|---|
| Averages
Career-average metrics across all AI race analysis. Performance and pace averages reflect estimated historical performance; trainer and jockey grades score in-the-money percentages. Grading scale: A = elite • B = above average • C = average • D = below average • F = poor • — = no data |
||
| Pick Pony AI Rating | A | B |
| Pace Trip Longshot | — | — |
| Connections Longshot | — | — |
| Situational Longshot | — | — |
| Speed | C | D |
| Early Pace | A | C |
| Mid Pace | A | C |
| Late Pace | D | C |
| Finish Pos | B | D |
| Dirt Speed | B | B |
| Turf Speed | C | D |
| Distance Speed | B | C |
| Trainer Effectiveness | B | B |
| Jockey Effectiveness | D | D |
| 3rd Party Ratings | A | B |
| Recent
Performance analysis from the horse's recent races, weighted to reflect current form. Sprint and Route FPS (Foot Per Second) measure pace efficiency over the horse's recent sprints and routes respectively. Grading scale: A = elite • B = above average • C = average • D = below average • F = poor • — = no data |
||
| Speed | B | C |
| Early Pace | B | C |
| Mid Pace | B | C |
| Late Pace | B | B |
| Sprint FPS | A | A |
| Route FPS | C | A |
| Trainer Effectiveness | B | B |
| Jockey Effectiveness | D | D |
| 3rd Party Ratings | A | B |
| Predictions
AI-generated projections for the upcoming race, derived from prior AI analysis for speed and pace trends, surface and distance suitability, and current conditions. Grading scale: A = elite • B = above average • C = average • D = below average • F = poor • — = no data |
||
| Speed | C | D |
| Early Pace | A | C |
| Mid Pace | B | C |
| Late Pace | C | C |
Chart Guide (2.0.41)
What it shows: This horse’s recent races, one bubble per race, plotted by its AI speed figure against the class par for today’s race (the dashed line).
What to look for: Recent bubbles at or above the dashed line, a trend line angled up, and a narrow shaded band (steady form). Check whether the good runs came on today’s surface and distance.
- Bubbles
- Color = surface: green (turf), brown (dirt), blue (synthetic)
- Top number = finishing position; bottom number in parentheses = starting post position
- Height above line = beaten lengths — closer means a smaller margin
- Border = track conditions: green (FST/GD/FM), yellow (WF/SL/YLD), red (SY/MY/FRZ/SFT/HVY)
- Connecting Line
- Solid = good conditions; dashed = bad conditions
- Line Symbol
- ▲ Triangle = sprint (7f or less); ● Circle = route (more than 7f)
- Days Between Races
- Small number above each bubble (e.g. 19d) = days since the previous race — helps spot freshness, layoffs, and tight scheduling.
- Shaded Band (Bollinger)
- Highlights volatility — a wider band means more variation in recent performance
- Performance Trend
- Straight line showing the overall performance direction — angled up = improving, angled down = declining
- Dashed Reference Line
- AI Opponent = AI analysis class-level par for the race
AI Model History Guide
What it shows: How our AI models rated this horse in each of its recent races, compared with how they rate today’s field (the dashed lines).
What to look for: Lines that are rising and sit above the dashed field averages — the models have liked this horse and still do. Falling lines, or lines below the dashed ones, mean the models are cooling on it.
- Lines
- Each solid line shows this horse’s model score over its last 10 races: blue = Mod1, green = Mod2, amber = Mod3.
- Dashed Lines
- Dashed lines represent the current race’s field average for each model — a score below the dashed line indicates the horse ranked below average in this model’s assessment.
- Higher is Stronger
- All three model scores are 0–100: a higher number means the model rates this horse more favorably among the field.
Mod1(W): 82 (1/8) Mod2(W): 75 (2/8) Mod3(W): 79 (3/8) Mod1-LS: 55 (6/8) Win Prob: 18.4% Value Score: 1.35 ★
Performance vs. Peers Guide
What it shows: Each horse’s career, last-3-race and last-race performance side by side, against the field average.
What to look for: Horses above the field average whose last race is green (better than their average) and whose trend line rises — improving form. Red last races and falling lines point to declining form.
- Bars (per post)
- Blue = avg career performance • Amber = avg last 3 races • Green = last race (improved vs. avg) • Red = last race (declined vs. avg)
- Trend Line
- Angled line above the bars: rising = improving form • falling = declining form.
- Horizontal Line
- Field average — the mean career performance of all horses in this race.
- Color Circles
- Standard post-position colors below each lane — same as the Total Pace chart.
- Border
- Thicker border = this horse’s post position.
Figure Comparison
What it shows: This horse’s ratings, speed figures and pace figures next to every other horse in the race.
What to look for: Where this horse (the darker column) leads the field or falls short. Strong ratings plus strong recent speed make a contender; recent speed well above career speed suggests improving form.
- Rating
- The three Pick Pony algorithm ratings (Algo 1, Algo 2, Algo 3) that make up the overall PP AI Rating — higher is a stronger contender rating.
- Speed
- Career average speed, recent 3-race average, and last-race speed figure — spot horses in improving or declining form.
- Pace
- Average Early (E1), Mid (E2), and Stretch (LP) pace figures — reveals pace-setters vs. closers vs. all-the-way types.
- This horse
- The horse whose stats card is open is highlighted with a darker column background.
Winning Profiles
What it shows: Each horse’s win rate and in-the-money rate over its last 10 starts, one dot per horse.
What to look for: Dots in the top-right are consistent winners. Top-left horses often finish in the money but rarely win — better for place and show bets or underneath in exotics. Bottom-left horses rarely finish well.
- Axes
- X: Win % from last 10 starts — Y: In-the-money % (top-3 finishes) from last 10 starts.
- Quadrants
- Consistent Winners (top-right): high win & ITM — reliable performers.
Place Threats (top-left): boards often but doesn’t win often — good exacta/trifecta angles.
Streaky (bottom-right): wins occasionally, misses the board often — all-or-nothing.
Developing (bottom-left): still finding form — longshot territory. - Reference Lines
- Dashed lines mark field averages. Dots to the right win more; dots higher board more.
- This horse
- Highlighted with a gold border and larger dot.
AI Model Comparison
What it shows: All AI model scores for every horse in the race, grouped by what each model is trained to find.
What to look for: The horse leading the green winner models is the models’ likely winner. A horse that stands out in the red longshot models but not the green ones is a longshot the models think is underrated.
- Winner Models (green)
- Mod1(W), Mod2(W), and Mod3(W) trained to predict race winners. Higher score = stronger contender.
- Longshot Models (red)
- Mod1-LS, Mod2-LS, and Mod3-LS trained to find high-value longshots. Higher score = stronger longshot candidate.
- Form Model (blue)
- Mod4 sequence model trained on recent form patterns. Higher score = stronger recent form profile.
- This horse
- Highlighted with a darker column background.
Race Pace Simulation Guide
What it shows: A simulated run of today’s race, based on each horse’s running style, post position and the expected pace.
What to look for: Who gets the lead, who gets boxed in, and who is gaining at the finish. Move the track-bias slider to see how the predicted order changes on a speed-favouring or closer-favouring track.
- Slider
- Drag left→right to advance from gate to finish. Drag all the way back to reset the race.
- Predicted Finish Order
- Factors in contested pace burn, each horse’s effort curve (peaked-early vs. peaked-late), and wide trip cost from outside posts. Updated live when Track Bias changes.
- Pace Scenario
- Lone Speed: single E horse likely rates and holds. Contested: two E horses burn each other — closers benefit. Hot Pace: speed meltdown, deep closers thrive. Soft: no early speed, moderate fractions throughout.
- Track Bias
- Slider below canvas. −2 = strong closer/wet bias; +2 = strong speed/rail bias. Recomputes the predicted finish order.
- Boxed Indicator
- Dashed orange ring = horse is surrounded (rival ahead, rival behind, wall outside). In a real race this horse must find a clear path to run.
- Running Styles
- E/EE = early speed (rushes to rail). P = presser (stalks the pace). S = stalker. SS = slow starter / closer.
| Stat | vs. Current Card | vs. All Horses |
|---|---|---|
| Averages
Career-average metrics across all AI race analysis. Performance and pace averages reflect estimated historical performance; trainer and jockey grades score in-the-money percentages. Grading scale: A = elite • B = above average • C = average • D = below average • F = poor • — = no data |
||
| Pick Pony AI Rating | A | B |
| Pace Trip Longshot | — | — |
| Connections Longshot | — | — |
| Situational Longshot | — | — |
| Speed | A | A |
| Early Pace | A | D |
| Mid Pace | A | C |
| Late Pace | A | A |
| Finish Pos | C | D |
| Dirt Speed | A | A |
| Turf Speed | A | A |
| Distance Speed | F | F |
| Trainer Effectiveness | A | B |
| Jockey Effectiveness | C | D |
| 3rd Party Ratings | A | B |
| Recent
Performance analysis from the horse's recent races, weighted to reflect current form. Sprint and Route FPS (Foot Per Second) measure pace efficiency over the horse's recent sprints and routes respectively. Grading scale: A = elite • B = above average • C = average • D = below average • F = poor • — = no data |
||
| Speed | A | B |
| Early Pace | C | C |
| Mid Pace | A | C |
| Late Pace | A | A |
| Sprint FPS | C | D |
| Route FPS | C | D |
| Trainer Effectiveness | A | B |
| Jockey Effectiveness | C | D |
| 3rd Party Ratings | A | B |
| Predictions
AI-generated projections for the upcoming race, derived from prior AI analysis for speed and pace trends, surface and distance suitability, and current conditions. Grading scale: A = elite • B = above average • C = average • D = below average • F = poor • — = no data |
||
| Speed | A | A |
| Early Pace | A | C |
| Mid Pace | A | C |
| Late Pace | C | C |
Chart Guide (2.0.41)
What it shows: This horse’s recent races, one bubble per race, plotted by its AI speed figure against the class par for today’s race (the dashed line).
What to look for: Recent bubbles at or above the dashed line, a trend line angled up, and a narrow shaded band (steady form). Check whether the good runs came on today’s surface and distance.
- Bubbles
- Color = surface: green (turf), brown (dirt), blue (synthetic)
- Top number = finishing position; bottom number in parentheses = starting post position
- Height above line = beaten lengths — closer means a smaller margin
- Border = track conditions: green (FST/GD/FM), yellow (WF/SL/YLD), red (SY/MY/FRZ/SFT/HVY)
- Connecting Line
- Solid = good conditions; dashed = bad conditions
- Line Symbol
- ▲ Triangle = sprint (7f or less); ● Circle = route (more than 7f)
- Days Between Races
- Small number above each bubble (e.g. 19d) = days since the previous race — helps spot freshness, layoffs, and tight scheduling.
- Shaded Band (Bollinger)
- Highlights volatility — a wider band means more variation in recent performance
- Performance Trend
- Straight line showing the overall performance direction — angled up = improving, angled down = declining
- Dashed Reference Line
- AI Opponent = AI analysis class-level par for the race
AI Model History Guide
What it shows: How our AI models rated this horse in each of its recent races, compared with how they rate today’s field (the dashed lines).
What to look for: Lines that are rising and sit above the dashed field averages — the models have liked this horse and still do. Falling lines, or lines below the dashed ones, mean the models are cooling on it.
- Lines
- Each solid line shows this horse’s model score over its last 10 races: blue = Mod1, green = Mod2, amber = Mod3.
- Dashed Lines
- Dashed lines represent the current race’s field average for each model — a score below the dashed line indicates the horse ranked below average in this model’s assessment.
- Higher is Stronger
- All three model scores are 0–100: a higher number means the model rates this horse more favorably among the field.
Mod1(W): 82 (1/8) Mod2(W): 75 (2/8) Mod3(W): 79 (3/8) Mod1-LS: 55 (6/8) Win Prob: 18.4% Value Score: 1.35 ★
Performance vs. Peers Guide
What it shows: Each horse’s career, last-3-race and last-race performance side by side, against the field average.
What to look for: Horses above the field average whose last race is green (better than their average) and whose trend line rises — improving form. Red last races and falling lines point to declining form.
- Bars (per post)
- Blue = avg career performance • Amber = avg last 3 races • Green = last race (improved vs. avg) • Red = last race (declined vs. avg)
- Trend Line
- Angled line above the bars: rising = improving form • falling = declining form.
- Horizontal Line
- Field average — the mean career performance of all horses in this race.
- Color Circles
- Standard post-position colors below each lane — same as the Total Pace chart.
- Border
- Thicker border = this horse’s post position.
Figure Comparison
What it shows: This horse’s ratings, speed figures and pace figures next to every other horse in the race.
What to look for: Where this horse (the darker column) leads the field or falls short. Strong ratings plus strong recent speed make a contender; recent speed well above career speed suggests improving form.
- Rating
- The three Pick Pony algorithm ratings (Algo 1, Algo 2, Algo 3) that make up the overall PP AI Rating — higher is a stronger contender rating.
- Speed
- Career average speed, recent 3-race average, and last-race speed figure — spot horses in improving or declining form.
- Pace
- Average Early (E1), Mid (E2), and Stretch (LP) pace figures — reveals pace-setters vs. closers vs. all-the-way types.
- This horse
- The horse whose stats card is open is highlighted with a darker column background.
Winning Profiles
What it shows: Each horse’s win rate and in-the-money rate over its last 10 starts, one dot per horse.
What to look for: Dots in the top-right are consistent winners. Top-left horses often finish in the money but rarely win — better for place and show bets or underneath in exotics. Bottom-left horses rarely finish well.
- Axes
- X: Win % from last 10 starts — Y: In-the-money % (top-3 finishes) from last 10 starts.
- Quadrants
- Consistent Winners (top-right): high win & ITM — reliable performers.
Place Threats (top-left): boards often but doesn’t win often — good exacta/trifecta angles.
Streaky (bottom-right): wins occasionally, misses the board often — all-or-nothing.
Developing (bottom-left): still finding form — longshot territory. - Reference Lines
- Dashed lines mark field averages. Dots to the right win more; dots higher board more.
- This horse
- Highlighted with a gold border and larger dot.
AI Model Comparison
What it shows: All AI model scores for every horse in the race, grouped by what each model is trained to find.
What to look for: The horse leading the green winner models is the models’ likely winner. A horse that stands out in the red longshot models but not the green ones is a longshot the models think is underrated.
- Winner Models (green)
- Mod1(W), Mod2(W), and Mod3(W) trained to predict race winners. Higher score = stronger contender.
- Longshot Models (red)
- Mod1-LS, Mod2-LS, and Mod3-LS trained to find high-value longshots. Higher score = stronger longshot candidate.
- Form Model (blue)
- Mod4 sequence model trained on recent form patterns. Higher score = stronger recent form profile.
- This horse
- Highlighted with a darker column background.
Race Pace Simulation Guide
What it shows: A simulated run of today’s race, based on each horse’s running style, post position and the expected pace.
What to look for: Who gets the lead, who gets boxed in, and who is gaining at the finish. Move the track-bias slider to see how the predicted order changes on a speed-favouring or closer-favouring track.
- Slider
- Drag left→right to advance from gate to finish. Drag all the way back to reset the race.
- Predicted Finish Order
- Factors in contested pace burn, each horse’s effort curve (peaked-early vs. peaked-late), and wide trip cost from outside posts. Updated live when Track Bias changes.
- Pace Scenario
- Lone Speed: single E horse likely rates and holds. Contested: two E horses burn each other — closers benefit. Hot Pace: speed meltdown, deep closers thrive. Soft: no early speed, moderate fractions throughout.
- Track Bias
- Slider below canvas. −2 = strong closer/wet bias; +2 = strong speed/rail bias. Recomputes the predicted finish order.
- Boxed Indicator
- Dashed orange ring = horse is surrounded (rival ahead, rival behind, wall outside). In a real race this horse must find a clear path to run.
- Running Styles
- E/EE = early speed (rushes to rail). P = presser (stalks the pace). S = stalker. SS = slow starter / closer.
| Stat | vs. Current Card | vs. All Horses |
|---|---|---|
| Averages
Career-average metrics across all AI race analysis. Performance and pace averages reflect estimated historical performance; trainer and jockey grades score in-the-money percentages. Grading scale: A = elite • B = above average • C = average • D = below average • F = poor • — = no data |
||
| Pick Pony AI Rating | D | D |
| Pace Trip Longshot | — | — |
| Connections Longshot | — | — |
| Situational Longshot | — | — |
| Speed | D | C |
| Early Pace | C | D |
| Mid Pace | F | D |
| Late Pace | A | B |
| Finish Pos | A | B |
| Dirt Speed | B | B |
| Turf Speed | A | B |
| Distance Speed | C | B |
| Trainer Effectiveness | C | D |
| Jockey Effectiveness | A | B |
| 3rd Party Ratings | F | C |
| Recent
Performance analysis from the horse's recent races, weighted to reflect current form. Sprint and Route FPS (Foot Per Second) measure pace efficiency over the horse's recent sprints and routes respectively. Grading scale: A = elite • B = above average • C = average • D = below average • F = poor • — = no data |
||
| Speed | D | C |
| Early Pace | C | D |
| Mid Pace | F | D |
| Late Pace | C | C |
| Sprint FPS | B | D |
| Route FPS | C | C |
| Trainer Effectiveness | C | D |
| Jockey Effectiveness | A | B |
| 3rd Party Ratings | F | C |
| Predictions
AI-generated projections for the upcoming race, derived from prior AI analysis for speed and pace trends, surface and distance suitability, and current conditions. Grading scale: A = elite • B = above average • C = average • D = below average • F = poor • — = no data |
||
| Speed | A | A |
| Early Pace | C | D |
| Mid Pace | D | D |
| Late Pace | C | C |
Chart Guide (2.0.41)
What it shows: This horse’s recent races, one bubble per race, plotted by its AI speed figure against the class par for today’s race (the dashed line).
What to look for: Recent bubbles at or above the dashed line, a trend line angled up, and a narrow shaded band (steady form). Check whether the good runs came on today’s surface and distance.
- Bubbles
- Color = surface: green (turf), brown (dirt), blue (synthetic)
- Top number = finishing position; bottom number in parentheses = starting post position
- Height above line = beaten lengths — closer means a smaller margin
- Border = track conditions: green (FST/GD/FM), yellow (WF/SL/YLD), red (SY/MY/FRZ/SFT/HVY)
- Connecting Line
- Solid = good conditions; dashed = bad conditions
- Line Symbol
- ▲ Triangle = sprint (7f or less); ● Circle = route (more than 7f)
- Days Between Races
- Small number above each bubble (e.g. 19d) = days since the previous race — helps spot freshness, layoffs, and tight scheduling.
- Shaded Band (Bollinger)
- Highlights volatility — a wider band means more variation in recent performance
- Performance Trend
- Straight line showing the overall performance direction — angled up = improving, angled down = declining
- Dashed Reference Line
- AI Opponent = AI analysis class-level par for the race
AI Model History Guide
What it shows: How our AI models rated this horse in each of its recent races, compared with how they rate today’s field (the dashed lines).
What to look for: Lines that are rising and sit above the dashed field averages — the models have liked this horse and still do. Falling lines, or lines below the dashed ones, mean the models are cooling on it.
- Lines
- Each solid line shows this horse’s model score over its last 10 races: blue = Mod1, green = Mod2, amber = Mod3.
- Dashed Lines
- Dashed lines represent the current race’s field average for each model — a score below the dashed line indicates the horse ranked below average in this model’s assessment.
- Higher is Stronger
- All three model scores are 0–100: a higher number means the model rates this horse more favorably among the field.
Mod1(W): 82 (1/8) Mod2(W): 75 (2/8) Mod3(W): 79 (3/8) Mod1-LS: 55 (6/8) Win Prob: 18.4% Value Score: 1.35 ★
Performance vs. Peers Guide
What it shows: Each horse’s career, last-3-race and last-race performance side by side, against the field average.
What to look for: Horses above the field average whose last race is green (better than their average) and whose trend line rises — improving form. Red last races and falling lines point to declining form.
- Bars (per post)
- Blue = avg career performance • Amber = avg last 3 races • Green = last race (improved vs. avg) • Red = last race (declined vs. avg)
- Trend Line
- Angled line above the bars: rising = improving form • falling = declining form.
- Horizontal Line
- Field average — the mean career performance of all horses in this race.
- Color Circles
- Standard post-position colors below each lane — same as the Total Pace chart.
- Border
- Thicker border = this horse’s post position.
Figure Comparison
What it shows: This horse’s ratings, speed figures and pace figures next to every other horse in the race.
What to look for: Where this horse (the darker column) leads the field or falls short. Strong ratings plus strong recent speed make a contender; recent speed well above career speed suggests improving form.
- Rating
- The three Pick Pony algorithm ratings (Algo 1, Algo 2, Algo 3) that make up the overall PP AI Rating — higher is a stronger contender rating.
- Speed
- Career average speed, recent 3-race average, and last-race speed figure — spot horses in improving or declining form.
- Pace
- Average Early (E1), Mid (E2), and Stretch (LP) pace figures — reveals pace-setters vs. closers vs. all-the-way types.
- This horse
- The horse whose stats card is open is highlighted with a darker column background.
Winning Profiles
What it shows: Each horse’s win rate and in-the-money rate over its last 10 starts, one dot per horse.
What to look for: Dots in the top-right are consistent winners. Top-left horses often finish in the money but rarely win — better for place and show bets or underneath in exotics. Bottom-left horses rarely finish well.
- Axes
- X: Win % from last 10 starts — Y: In-the-money % (top-3 finishes) from last 10 starts.
- Quadrants
- Consistent Winners (top-right): high win & ITM — reliable performers.
Place Threats (top-left): boards often but doesn’t win often — good exacta/trifecta angles.
Streaky (bottom-right): wins occasionally, misses the board often — all-or-nothing.
Developing (bottom-left): still finding form — longshot territory. - Reference Lines
- Dashed lines mark field averages. Dots to the right win more; dots higher board more.
- This horse
- Highlighted with a gold border and larger dot.
AI Model Comparison
What it shows: All AI model scores for every horse in the race, grouped by what each model is trained to find.
What to look for: The horse leading the green winner models is the models’ likely winner. A horse that stands out in the red longshot models but not the green ones is a longshot the models think is underrated.
- Winner Models (green)
- Mod1(W), Mod2(W), and Mod3(W) trained to predict race winners. Higher score = stronger contender.
- Longshot Models (red)
- Mod1-LS, Mod2-LS, and Mod3-LS trained to find high-value longshots. Higher score = stronger longshot candidate.
- Form Model (blue)
- Mod4 sequence model trained on recent form patterns. Higher score = stronger recent form profile.
- This horse
- Highlighted with a darker column background.
Race Pace Simulation Guide
What it shows: A simulated run of today’s race, based on each horse’s running style, post position and the expected pace.
What to look for: Who gets the lead, who gets boxed in, and who is gaining at the finish. Move the track-bias slider to see how the predicted order changes on a speed-favouring or closer-favouring track.
- Slider
- Drag left→right to advance from gate to finish. Drag all the way back to reset the race.
- Predicted Finish Order
- Factors in contested pace burn, each horse’s effort curve (peaked-early vs. peaked-late), and wide trip cost from outside posts. Updated live when Track Bias changes.
- Pace Scenario
- Lone Speed: single E horse likely rates and holds. Contested: two E horses burn each other — closers benefit. Hot Pace: speed meltdown, deep closers thrive. Soft: no early speed, moderate fractions throughout.
- Track Bias
- Slider below canvas. −2 = strong closer/wet bias; +2 = strong speed/rail bias. Recomputes the predicted finish order.
- Boxed Indicator
- Dashed orange ring = horse is surrounded (rival ahead, rival behind, wall outside). In a real race this horse must find a clear path to run.
- Running Styles
- E/EE = early speed (rushes to rail). P = presser (stalks the pace). S = stalker. SS = slow starter / closer.
| Stat | vs. Current Card | vs. All Horses |
|---|---|---|
| Averages
Career-average metrics across all AI race analysis. Performance and pace averages reflect estimated historical performance; trainer and jockey grades score in-the-money percentages. Grading scale: A = elite • B = above average • C = average • D = below average • F = poor • — = no data |
||
| Pick Pony AI Rating | C | C |
| Pace Trip Longshot | — | — |
| Connections Longshot | — | — |
| Situational Longshot | — | — |
| Speed | D | B |
| Early Pace | B | B |
| Mid Pace | B | B |
| Late Pace | D | C |
| Finish Pos | D | C |
| Dirt Speed | A | A |
| Turf Speed | F | A |
| Distance Speed | D | A |
| Trainer Effectiveness | D | B |
| Jockey Effectiveness | B | B |
| 3rd Party Ratings | C | A |
| Recent
Performance analysis from the horse's recent races, weighted to reflect current form. Sprint and Route FPS (Foot Per Second) measure pace efficiency over the horse's recent sprints and routes respectively. Grading scale: A = elite • B = above average • C = average • D = below average • F = poor • — = no data |
||
| Speed | C | A |
| Early Pace | D | C |
| Mid Pace | C | B |
| Late Pace | D | A |
| Sprint FPS | A | A |
| Route FPS | A | A |
| Trainer Effectiveness | D | B |
| Jockey Effectiveness | B | B |
| 3rd Party Ratings | C | A |
| Predictions
AI-generated projections for the upcoming race, derived from prior AI analysis for speed and pace trends, surface and distance suitability, and current conditions. Grading scale: A = elite • B = above average • C = average • D = below average • F = poor • — = no data |
||
| Speed | D | B |
| Early Pace | A | B |
| Mid Pace | B | A |
| Late Pace | C | C |
Chart Guide (2.0.41)
What it shows: This horse’s recent races, one bubble per race, plotted by its AI speed figure against the class par for today’s race (the dashed line).
What to look for: Recent bubbles at or above the dashed line, a trend line angled up, and a narrow shaded band (steady form). Check whether the good runs came on today’s surface and distance.
- Bubbles
- Color = surface: green (turf), brown (dirt), blue (synthetic)
- Top number = finishing position; bottom number in parentheses = starting post position
- Height above line = beaten lengths — closer means a smaller margin
- Border = track conditions: green (FST/GD/FM), yellow (WF/SL/YLD), red (SY/MY/FRZ/SFT/HVY)
- Connecting Line
- Solid = good conditions; dashed = bad conditions
- Line Symbol
- ▲ Triangle = sprint (7f or less); ● Circle = route (more than 7f)
- Days Between Races
- Small number above each bubble (e.g. 19d) = days since the previous race — helps spot freshness, layoffs, and tight scheduling.
- Shaded Band (Bollinger)
- Highlights volatility — a wider band means more variation in recent performance
- Performance Trend
- Straight line showing the overall performance direction — angled up = improving, angled down = declining
- Dashed Reference Line
- AI Opponent = AI analysis class-level par for the race
AI Model History Guide
What it shows: How our AI models rated this horse in each of its recent races, compared with how they rate today’s field (the dashed lines).
What to look for: Lines that are rising and sit above the dashed field averages — the models have liked this horse and still do. Falling lines, or lines below the dashed ones, mean the models are cooling on it.
- Lines
- Each solid line shows this horse’s model score over its last 10 races: blue = Mod1, green = Mod2, amber = Mod3.
- Dashed Lines
- Dashed lines represent the current race’s field average for each model — a score below the dashed line indicates the horse ranked below average in this model’s assessment.
- Higher is Stronger
- All three model scores are 0–100: a higher number means the model rates this horse more favorably among the field.
Mod1(W): 82 (1/8) Mod2(W): 75 (2/8) Mod3(W): 79 (3/8) Mod1-LS: 55 (6/8) Win Prob: 18.4% Value Score: 1.35 ★
Performance vs. Peers Guide
What it shows: Each horse’s career, last-3-race and last-race performance side by side, against the field average.
What to look for: Horses above the field average whose last race is green (better than their average) and whose trend line rises — improving form. Red last races and falling lines point to declining form.
- Bars (per post)
- Blue = avg career performance • Amber = avg last 3 races • Green = last race (improved vs. avg) • Red = last race (declined vs. avg)
- Trend Line
- Angled line above the bars: rising = improving form • falling = declining form.
- Horizontal Line
- Field average — the mean career performance of all horses in this race.
- Color Circles
- Standard post-position colors below each lane — same as the Total Pace chart.
- Border
- Thicker border = this horse’s post position.
Figure Comparison
What it shows: This horse’s ratings, speed figures and pace figures next to every other horse in the race.
What to look for: Where this horse (the darker column) leads the field or falls short. Strong ratings plus strong recent speed make a contender; recent speed well above career speed suggests improving form.
- Rating
- The three Pick Pony algorithm ratings (Algo 1, Algo 2, Algo 3) that make up the overall PP AI Rating — higher is a stronger contender rating.
- Speed
- Career average speed, recent 3-race average, and last-race speed figure — spot horses in improving or declining form.
- Pace
- Average Early (E1), Mid (E2), and Stretch (LP) pace figures — reveals pace-setters vs. closers vs. all-the-way types.
- This horse
- The horse whose stats card is open is highlighted with a darker column background.
Winning Profiles
What it shows: Each horse’s win rate and in-the-money rate over its last 10 starts, one dot per horse.
What to look for: Dots in the top-right are consistent winners. Top-left horses often finish in the money but rarely win — better for place and show bets or underneath in exotics. Bottom-left horses rarely finish well.
- Axes
- X: Win % from last 10 starts — Y: In-the-money % (top-3 finishes) from last 10 starts.
- Quadrants
- Consistent Winners (top-right): high win & ITM — reliable performers.
Place Threats (top-left): boards often but doesn’t win often — good exacta/trifecta angles.
Streaky (bottom-right): wins occasionally, misses the board often — all-or-nothing.
Developing (bottom-left): still finding form — longshot territory. - Reference Lines
- Dashed lines mark field averages. Dots to the right win more; dots higher board more.
- This horse
- Highlighted with a gold border and larger dot.
AI Model Comparison
What it shows: All AI model scores for every horse in the race, grouped by what each model is trained to find.
What to look for: The horse leading the green winner models is the models’ likely winner. A horse that stands out in the red longshot models but not the green ones is a longshot the models think is underrated.
- Winner Models (green)
- Mod1(W), Mod2(W), and Mod3(W) trained to predict race winners. Higher score = stronger contender.
- Longshot Models (red)
- Mod1-LS, Mod2-LS, and Mod3-LS trained to find high-value longshots. Higher score = stronger longshot candidate.
- Form Model (blue)
- Mod4 sequence model trained on recent form patterns. Higher score = stronger recent form profile.
- This horse
- Highlighted with a darker column background.
Race Pace Simulation Guide
What it shows: A simulated run of today’s race, based on each horse’s running style, post position and the expected pace.
What to look for: Who gets the lead, who gets boxed in, and who is gaining at the finish. Move the track-bias slider to see how the predicted order changes on a speed-favouring or closer-favouring track.
- Slider
- Drag left→right to advance from gate to finish. Drag all the way back to reset the race.
- Predicted Finish Order
- Factors in contested pace burn, each horse’s effort curve (peaked-early vs. peaked-late), and wide trip cost from outside posts. Updated live when Track Bias changes.
- Pace Scenario
- Lone Speed: single E horse likely rates and holds. Contested: two E horses burn each other — closers benefit. Hot Pace: speed meltdown, deep closers thrive. Soft: no early speed, moderate fractions throughout.
- Track Bias
- Slider below canvas. −2 = strong closer/wet bias; +2 = strong speed/rail bias. Recomputes the predicted finish order.
- Boxed Indicator
- Dashed orange ring = horse is surrounded (rival ahead, rival behind, wall outside). In a real race this horse must find a clear path to run.
- Running Styles
- E/EE = early speed (rushes to rail). P = presser (stalks the pace). S = stalker. SS = slow starter / closer.
| Stat | vs. Current Card | vs. All Horses |
|---|---|---|
| Averages
Career-average metrics across all AI race analysis. Performance and pace averages reflect estimated historical performance; trainer and jockey grades score in-the-money percentages. Grading scale: A = elite • B = above average • C = average • D = below average • F = poor • — = no data |
||
| Pick Pony AI Rating | A | B |
| Pace Trip Longshot | — | — |
| Connections Longshot | — | — |
| Situational Longshot | — | — |
| Speed | A | A |
| Early Pace | A | A |
| Mid Pace | A | A |
| Late Pace | B | A |
| Finish Pos | B | B |
| Dirt Speed | B | C |
| Turf Speed | A | A |
| Distance Speed | B | A |
| Trainer Effectiveness | A | B |
| Jockey Effectiveness | A | B |
| 3rd Party Ratings | A | A |
| Recent
Performance analysis from the horse's recent races, weighted to reflect current form. Sprint and Route FPS (Foot Per Second) measure pace efficiency over the horse's recent sprints and routes respectively. Grading scale: A = elite • B = above average • C = average • D = below average • F = poor • — = no data |
||
| Speed | A | A |
| Early Pace | A | A |
| Mid Pace | A | A |
| Late Pace | A | A |
| Sprint FPS | A | B |
| Route FPS | B | B |
| Trainer Effectiveness | A | B |
| Jockey Effectiveness | A | B |
| 3rd Party Ratings | A | A |
| Predictions
AI-generated projections for the upcoming race, derived from prior AI analysis for speed and pace trends, surface and distance suitability, and current conditions. Grading scale: A = elite • B = above average • C = average • D = below average • F = poor • — = no data |
||
| Speed | A | A |
| Early Pace | A | A |
| Mid Pace | A | A |
| Late Pace | C | C |
Chart Guide (2.0.41)
What it shows: This horse’s recent races, one bubble per race, plotted by its AI speed figure against the class par for today’s race (the dashed line).
What to look for: Recent bubbles at or above the dashed line, a trend line angled up, and a narrow shaded band (steady form). Check whether the good runs came on today’s surface and distance.
- Bubbles
- Color = surface: green (turf), brown (dirt), blue (synthetic)
- Top number = finishing position; bottom number in parentheses = starting post position
- Height above line = beaten lengths — closer means a smaller margin
- Border = track conditions: green (FST/GD/FM), yellow (WF/SL/YLD), red (SY/MY/FRZ/SFT/HVY)
- Connecting Line
- Solid = good conditions; dashed = bad conditions
- Line Symbol
- ▲ Triangle = sprint (7f or less); ● Circle = route (more than 7f)
- Days Between Races
- Small number above each bubble (e.g. 19d) = days since the previous race — helps spot freshness, layoffs, and tight scheduling.
- Shaded Band (Bollinger)
- Highlights volatility — a wider band means more variation in recent performance
- Performance Trend
- Straight line showing the overall performance direction — angled up = improving, angled down = declining
- Dashed Reference Line
- AI Opponent = AI analysis class-level par for the race
AI Model History Guide
What it shows: How our AI models rated this horse in each of its recent races, compared with how they rate today’s field (the dashed lines).
What to look for: Lines that are rising and sit above the dashed field averages — the models have liked this horse and still do. Falling lines, or lines below the dashed ones, mean the models are cooling on it.
- Lines
- Each solid line shows this horse’s model score over its last 10 races: blue = Mod1, green = Mod2, amber = Mod3.
- Dashed Lines
- Dashed lines represent the current race’s field average for each model — a score below the dashed line indicates the horse ranked below average in this model’s assessment.
- Higher is Stronger
- All three model scores are 0–100: a higher number means the model rates this horse more favorably among the field.
Mod1(W): 82 (1/8) Mod2(W): 75 (2/8) Mod3(W): 79 (3/8) Mod1-LS: 55 (6/8) Win Prob: 18.4% Value Score: 1.35 ★
Performance vs. Peers Guide
What it shows: Each horse’s career, last-3-race and last-race performance side by side, against the field average.
What to look for: Horses above the field average whose last race is green (better than their average) and whose trend line rises — improving form. Red last races and falling lines point to declining form.
- Bars (per post)
- Blue = avg career performance • Amber = avg last 3 races • Green = last race (improved vs. avg) • Red = last race (declined vs. avg)
- Trend Line
- Angled line above the bars: rising = improving form • falling = declining form.
- Horizontal Line
- Field average — the mean career performance of all horses in this race.
- Color Circles
- Standard post-position colors below each lane — same as the Total Pace chart.
- Border
- Thicker border = this horse’s post position.
Figure Comparison
What it shows: This horse’s ratings, speed figures and pace figures next to every other horse in the race.
What to look for: Where this horse (the darker column) leads the field or falls short. Strong ratings plus strong recent speed make a contender; recent speed well above career speed suggests improving form.
- Rating
- The three Pick Pony algorithm ratings (Algo 1, Algo 2, Algo 3) that make up the overall PP AI Rating — higher is a stronger contender rating.
- Speed
- Career average speed, recent 3-race average, and last-race speed figure — spot horses in improving or declining form.
- Pace
- Average Early (E1), Mid (E2), and Stretch (LP) pace figures — reveals pace-setters vs. closers vs. all-the-way types.
- This horse
- The horse whose stats card is open is highlighted with a darker column background.
Winning Profiles
What it shows: Each horse’s win rate and in-the-money rate over its last 10 starts, one dot per horse.
What to look for: Dots in the top-right are consistent winners. Top-left horses often finish in the money but rarely win — better for place and show bets or underneath in exotics. Bottom-left horses rarely finish well.
- Axes
- X: Win % from last 10 starts — Y: In-the-money % (top-3 finishes) from last 10 starts.
- Quadrants
- Consistent Winners (top-right): high win & ITM — reliable performers.
Place Threats (top-left): boards often but doesn’t win often — good exacta/trifecta angles.
Streaky (bottom-right): wins occasionally, misses the board often — all-or-nothing.
Developing (bottom-left): still finding form — longshot territory. - Reference Lines
- Dashed lines mark field averages. Dots to the right win more; dots higher board more.
- This horse
- Highlighted with a gold border and larger dot.
AI Model Comparison
What it shows: All AI model scores for every horse in the race, grouped by what each model is trained to find.
What to look for: The horse leading the green winner models is the models’ likely winner. A horse that stands out in the red longshot models but not the green ones is a longshot the models think is underrated.
- Winner Models (green)
- Mod1(W), Mod2(W), and Mod3(W) trained to predict race winners. Higher score = stronger contender.
- Longshot Models (red)
- Mod1-LS, Mod2-LS, and Mod3-LS trained to find high-value longshots. Higher score = stronger longshot candidate.
- Form Model (blue)
- Mod4 sequence model trained on recent form patterns. Higher score = stronger recent form profile.
- This horse
- Highlighted with a darker column background.
Race Pace Simulation Guide
What it shows: A simulated run of today’s race, based on each horse’s running style, post position and the expected pace.
What to look for: Who gets the lead, who gets boxed in, and who is gaining at the finish. Move the track-bias slider to see how the predicted order changes on a speed-favouring or closer-favouring track.
- Slider
- Drag left→right to advance from gate to finish. Drag all the way back to reset the race.
- Predicted Finish Order
- Factors in contested pace burn, each horse’s effort curve (peaked-early vs. peaked-late), and wide trip cost from outside posts. Updated live when Track Bias changes.
- Pace Scenario
- Lone Speed: single E horse likely rates and holds. Contested: two E horses burn each other — closers benefit. Hot Pace: speed meltdown, deep closers thrive. Soft: no early speed, moderate fractions throughout.
- Track Bias
- Slider below canvas. −2 = strong closer/wet bias; +2 = strong speed/rail bias. Recomputes the predicted finish order.
- Boxed Indicator
- Dashed orange ring = horse is surrounded (rival ahead, rival behind, wall outside). In a real race this horse must find a clear path to run.
- Running Styles
- E/EE = early speed (rushes to rail). P = presser (stalks the pace). S = stalker. SS = slow starter / closer.
| Stat | vs. Current Card | vs. All Horses |
|---|---|---|
| Averages
Career-average metrics across all AI race analysis. Performance and pace averages reflect estimated historical performance; trainer and jockey grades score in-the-money percentages. Grading scale: A = elite • B = above average • C = average • D = below average • F = poor • — = no data |
||
| Pick Pony AI Rating | A | A |
| Pace Trip Longshot | — | — |
| Connections Longshot | — | — |
| Situational Longshot | — | — |
| Speed | A | A |
| Early Pace | C | C |
| Mid Pace | B | B |
| Late Pace | B | A |
| Finish Pos | A | B |
| Dirt Speed | B | C |
| Turf Speed | A | A |
| Distance Speed | A | A |
| Trainer Effectiveness | B | B |
| Jockey Effectiveness | C | C |
| 3rd Party Ratings | A | A |
| Recent
Performance analysis from the horse's recent races, weighted to reflect current form. Sprint and Route FPS (Foot Per Second) measure pace efficiency over the horse's recent sprints and routes respectively. Grading scale: A = elite • B = above average • C = average • D = below average • F = poor • — = no data |
||
| Speed | B | A |
| Early Pace | B | C |
| Mid Pace | B | A |
| Late Pace | B | A |
| Sprint FPS | B | B |
| Route FPS | A | B |
| Trainer Effectiveness | B | B |
| Jockey Effectiveness | C | C |
| 3rd Party Ratings | A | A |
| Predictions
AI-generated projections for the upcoming race, derived from prior AI analysis for speed and pace trends, surface and distance suitability, and current conditions. Grading scale: A = elite • B = above average • C = average • D = below average • F = poor • — = no data |
||
| Speed | A | A |
| Early Pace | C | C |
| Mid Pace | B | B |
| Late Pace | C | C |
Chart Guide (2.0.41)
What it shows: This horse’s recent races, one bubble per race, plotted by its AI speed figure against the class par for today’s race (the dashed line).
What to look for: Recent bubbles at or above the dashed line, a trend line angled up, and a narrow shaded band (steady form). Check whether the good runs came on today’s surface and distance.
- Bubbles
- Color = surface: green (turf), brown (dirt), blue (synthetic)
- Top number = finishing position; bottom number in parentheses = starting post position
- Height above line = beaten lengths — closer means a smaller margin
- Border = track conditions: green (FST/GD/FM), yellow (WF/SL/YLD), red (SY/MY/FRZ/SFT/HVY)
- Connecting Line
- Solid = good conditions; dashed = bad conditions
- Line Symbol
- ▲ Triangle = sprint (7f or less); ● Circle = route (more than 7f)
- Days Between Races
- Small number above each bubble (e.g. 19d) = days since the previous race — helps spot freshness, layoffs, and tight scheduling.
- Shaded Band (Bollinger)
- Highlights volatility — a wider band means more variation in recent performance
- Performance Trend
- Straight line showing the overall performance direction — angled up = improving, angled down = declining
- Dashed Reference Line
- AI Opponent = AI analysis class-level par for the race
AI Model History Guide
What it shows: How our AI models rated this horse in each of its recent races, compared with how they rate today’s field (the dashed lines).
What to look for: Lines that are rising and sit above the dashed field averages — the models have liked this horse and still do. Falling lines, or lines below the dashed ones, mean the models are cooling on it.
- Lines
- Each solid line shows this horse’s model score over its last 10 races: blue = Mod1, green = Mod2, amber = Mod3.
- Dashed Lines
- Dashed lines represent the current race’s field average for each model — a score below the dashed line indicates the horse ranked below average in this model’s assessment.
- Higher is Stronger
- All three model scores are 0–100: a higher number means the model rates this horse more favorably among the field.
Mod1(W): 82 (1/8) Mod2(W): 75 (2/8) Mod3(W): 79 (3/8) Mod1-LS: 55 (6/8) Win Prob: 18.4% Value Score: 1.35 ★
Performance vs. Peers Guide
What it shows: Each horse’s career, last-3-race and last-race performance side by side, against the field average.
What to look for: Horses above the field average whose last race is green (better than their average) and whose trend line rises — improving form. Red last races and falling lines point to declining form.
- Bars (per post)
- Blue = avg career performance • Amber = avg last 3 races • Green = last race (improved vs. avg) • Red = last race (declined vs. avg)
- Trend Line
- Angled line above the bars: rising = improving form • falling = declining form.
- Horizontal Line
- Field average — the mean career performance of all horses in this race.
- Color Circles
- Standard post-position colors below each lane — same as the Total Pace chart.
- Border
- Thicker border = this horse’s post position.
Figure Comparison
What it shows: This horse’s ratings, speed figures and pace figures next to every other horse in the race.
What to look for: Where this horse (the darker column) leads the field or falls short. Strong ratings plus strong recent speed make a contender; recent speed well above career speed suggests improving form.
- Rating
- The three Pick Pony algorithm ratings (Algo 1, Algo 2, Algo 3) that make up the overall PP AI Rating — higher is a stronger contender rating.
- Speed
- Career average speed, recent 3-race average, and last-race speed figure — spot horses in improving or declining form.
- Pace
- Average Early (E1), Mid (E2), and Stretch (LP) pace figures — reveals pace-setters vs. closers vs. all-the-way types.
- This horse
- The horse whose stats card is open is highlighted with a darker column background.
Winning Profiles
What it shows: Each horse’s win rate and in-the-money rate over its last 10 starts, one dot per horse.
What to look for: Dots in the top-right are consistent winners. Top-left horses often finish in the money but rarely win — better for place and show bets or underneath in exotics. Bottom-left horses rarely finish well.
- Axes
- X: Win % from last 10 starts — Y: In-the-money % (top-3 finishes) from last 10 starts.
- Quadrants
- Consistent Winners (top-right): high win & ITM — reliable performers.
Place Threats (top-left): boards often but doesn’t win often — good exacta/trifecta angles.
Streaky (bottom-right): wins occasionally, misses the board often — all-or-nothing.
Developing (bottom-left): still finding form — longshot territory. - Reference Lines
- Dashed lines mark field averages. Dots to the right win more; dots higher board more.
- This horse
- Highlighted with a gold border and larger dot.
AI Model Comparison
What it shows: All AI model scores for every horse in the race, grouped by what each model is trained to find.
What to look for: The horse leading the green winner models is the models’ likely winner. A horse that stands out in the red longshot models but not the green ones is a longshot the models think is underrated.
- Winner Models (green)
- Mod1(W), Mod2(W), and Mod3(W) trained to predict race winners. Higher score = stronger contender.
- Longshot Models (red)
- Mod1-LS, Mod2-LS, and Mod3-LS trained to find high-value longshots. Higher score = stronger longshot candidate.
- Form Model (blue)
- Mod4 sequence model trained on recent form patterns. Higher score = stronger recent form profile.
- This horse
- Highlighted with a darker column background.
Race Pace Simulation Guide
What it shows: A simulated run of today’s race, based on each horse’s running style, post position and the expected pace.
What to look for: Who gets the lead, who gets boxed in, and who is gaining at the finish. Move the track-bias slider to see how the predicted order changes on a speed-favouring or closer-favouring track.
- Slider
- Drag left→right to advance from gate to finish. Drag all the way back to reset the race.
- Predicted Finish Order
- Factors in contested pace burn, each horse’s effort curve (peaked-early vs. peaked-late), and wide trip cost from outside posts. Updated live when Track Bias changes.
- Pace Scenario
- Lone Speed: single E horse likely rates and holds. Contested: two E horses burn each other — closers benefit. Hot Pace: speed meltdown, deep closers thrive. Soft: no early speed, moderate fractions throughout.
- Track Bias
- Slider below canvas. −2 = strong closer/wet bias; +2 = strong speed/rail bias. Recomputes the predicted finish order.
- Boxed Indicator
- Dashed orange ring = horse is surrounded (rival ahead, rival behind, wall outside). In a real race this horse must find a clear path to run.
- Running Styles
- E/EE = early speed (rushes to rail). P = presser (stalks the pace). S = stalker. SS = slow starter / closer.
| Stat | vs. Current Card | vs. All Horses |
|---|---|---|
| Averages
Career-average metrics across all AI race analysis. Performance and pace averages reflect estimated historical performance; trainer and jockey grades score in-the-money percentages. Grading scale: A = elite • B = above average • C = average • D = below average • F = poor • — = no data |
||
| Pick Pony AI Rating | F | D |
| Pace Trip Longshot | — | — |
| Connections Longshot | — | — |
| Situational Longshot | — | — |
| Speed | B | A |
| Early Pace | F | D |
| Mid Pace | F | C |
| Late Pace | A | A |
| Finish Pos | B | B |
| Dirt Speed | A | A |
| Turf Speed | B | A |
| Distance Speed | B | A |
| Trainer Effectiveness | C | B |
| Jockey Effectiveness | D | C |
| 3rd Party Ratings | F | C |
| Recent
Performance analysis from the horse's recent races, weighted to reflect current form. Sprint and Route FPS (Foot Per Second) measure pace efficiency over the horse's recent sprints and routes respectively. Grading scale: A = elite • B = above average • C = average • D = below average • F = poor • — = no data |
||
| Speed | C | A |
| Early Pace | F | D |
| Mid Pace | F | C |
| Late Pace | A | A |
| Sprint FPS | D | C |
| Route FPS | D | C |
| Trainer Effectiveness | C | B |
| Jockey Effectiveness | D | C |
| 3rd Party Ratings | F | C |
| Predictions
AI-generated projections for the upcoming race, derived from prior AI analysis for speed and pace trends, surface and distance suitability, and current conditions. Grading scale: A = elite • B = above average • C = average • D = below average • F = poor • — = no data |
||
| Speed | B | A |
| Early Pace | F | D |
| Mid Pace | F | B |
| Late Pace | C | C |
Chart Guide (2.0.41)
What it shows: This horse’s recent races, one bubble per race, plotted by its AI speed figure against the class par for today’s race (the dashed line).
What to look for: Recent bubbles at or above the dashed line, a trend line angled up, and a narrow shaded band (steady form). Check whether the good runs came on today’s surface and distance.
- Bubbles
- Color = surface: green (turf), brown (dirt), blue (synthetic)
- Top number = finishing position; bottom number in parentheses = starting post position
- Height above line = beaten lengths — closer means a smaller margin
- Border = track conditions: green (FST/GD/FM), yellow (WF/SL/YLD), red (SY/MY/FRZ/SFT/HVY)
- Connecting Line
- Solid = good conditions; dashed = bad conditions
- Line Symbol
- ▲ Triangle = sprint (7f or less); ● Circle = route (more than 7f)
- Days Between Races
- Small number above each bubble (e.g. 19d) = days since the previous race — helps spot freshness, layoffs, and tight scheduling.
- Shaded Band (Bollinger)
- Highlights volatility — a wider band means more variation in recent performance
- Performance Trend
- Straight line showing the overall performance direction — angled up = improving, angled down = declining
- Dashed Reference Line
- AI Opponent = AI analysis class-level par for the race
AI Model History Guide
What it shows: How our AI models rated this horse in each of its recent races, compared with how they rate today’s field (the dashed lines).
What to look for: Lines that are rising and sit above the dashed field averages — the models have liked this horse and still do. Falling lines, or lines below the dashed ones, mean the models are cooling on it.
- Lines
- Each solid line shows this horse’s model score over its last 10 races: blue = Mod1, green = Mod2, amber = Mod3.
- Dashed Lines
- Dashed lines represent the current race’s field average for each model — a score below the dashed line indicates the horse ranked below average in this model’s assessment.
- Higher is Stronger
- All three model scores are 0–100: a higher number means the model rates this horse more favorably among the field.
Mod1(W): 82 (1/8) Mod2(W): 75 (2/8) Mod3(W): 79 (3/8) Mod1-LS: 55 (6/8) Win Prob: 18.4% Value Score: 1.35 ★
Performance vs. Peers Guide
What it shows: Each horse’s career, last-3-race and last-race performance side by side, against the field average.
What to look for: Horses above the field average whose last race is green (better than their average) and whose trend line rises — improving form. Red last races and falling lines point to declining form.
- Bars (per post)
- Blue = avg career performance • Amber = avg last 3 races • Green = last race (improved vs. avg) • Red = last race (declined vs. avg)
- Trend Line
- Angled line above the bars: rising = improving form • falling = declining form.
- Horizontal Line
- Field average — the mean career performance of all horses in this race.
- Color Circles
- Standard post-position colors below each lane — same as the Total Pace chart.
- Border
- Thicker border = this horse’s post position.
Figure Comparison
What it shows: This horse’s ratings, speed figures and pace figures next to every other horse in the race.
What to look for: Where this horse (the darker column) leads the field or falls short. Strong ratings plus strong recent speed make a contender; recent speed well above career speed suggests improving form.
- Rating
- The three Pick Pony algorithm ratings (Algo 1, Algo 2, Algo 3) that make up the overall PP AI Rating — higher is a stronger contender rating.
- Speed
- Career average speed, recent 3-race average, and last-race speed figure — spot horses in improving or declining form.
- Pace
- Average Early (E1), Mid (E2), and Stretch (LP) pace figures — reveals pace-setters vs. closers vs. all-the-way types.
- This horse
- The horse whose stats card is open is highlighted with a darker column background.
Winning Profiles
What it shows: Each horse’s win rate and in-the-money rate over its last 10 starts, one dot per horse.
What to look for: Dots in the top-right are consistent winners. Top-left horses often finish in the money but rarely win — better for place and show bets or underneath in exotics. Bottom-left horses rarely finish well.
- Axes
- X: Win % from last 10 starts — Y: In-the-money % (top-3 finishes) from last 10 starts.
- Quadrants
- Consistent Winners (top-right): high win & ITM — reliable performers.
Place Threats (top-left): boards often but doesn’t win often — good exacta/trifecta angles.
Streaky (bottom-right): wins occasionally, misses the board often — all-or-nothing.
Developing (bottom-left): still finding form — longshot territory. - Reference Lines
- Dashed lines mark field averages. Dots to the right win more; dots higher board more.
- This horse
- Highlighted with a gold border and larger dot.
AI Model Comparison
What it shows: All AI model scores for every horse in the race, grouped by what each model is trained to find.
What to look for: The horse leading the green winner models is the models’ likely winner. A horse that stands out in the red longshot models but not the green ones is a longshot the models think is underrated.
- Winner Models (green)
- Mod1(W), Mod2(W), and Mod3(W) trained to predict race winners. Higher score = stronger contender.
- Longshot Models (red)
- Mod1-LS, Mod2-LS, and Mod3-LS trained to find high-value longshots. Higher score = stronger longshot candidate.
- Form Model (blue)
- Mod4 sequence model trained on recent form patterns. Higher score = stronger recent form profile.
- This horse
- Highlighted with a darker column background.
Race Pace Simulation Guide
What it shows: A simulated run of today’s race, based on each horse’s running style, post position and the expected pace.
What to look for: Who gets the lead, who gets boxed in, and who is gaining at the finish. Move the track-bias slider to see how the predicted order changes on a speed-favouring or closer-favouring track.
- Slider
- Drag left→right to advance from gate to finish. Drag all the way back to reset the race.
- Predicted Finish Order
- Factors in contested pace burn, each horse’s effort curve (peaked-early vs. peaked-late), and wide trip cost from outside posts. Updated live when Track Bias changes.
- Pace Scenario
- Lone Speed: single E horse likely rates and holds. Contested: two E horses burn each other — closers benefit. Hot Pace: speed meltdown, deep closers thrive. Soft: no early speed, moderate fractions throughout.
- Track Bias
- Slider below canvas. −2 = strong closer/wet bias; +2 = strong speed/rail bias. Recomputes the predicted finish order.
- Boxed Indicator
- Dashed orange ring = horse is surrounded (rival ahead, rival behind, wall outside). In a real race this horse must find a clear path to run.
- Running Styles
- E/EE = early speed (rushes to rail). P = presser (stalks the pace). S = stalker. SS = slow starter / closer.
| Stat | vs. Current Card | vs. All Horses |
|---|---|---|
| Averages
Career-average metrics across all AI race analysis. Performance and pace averages reflect estimated historical performance; trainer and jockey grades score in-the-money percentages. Grading scale: A = elite • B = above average • C = average • D = below average • F = poor • — = no data |
||
| Pick Pony AI Rating | A | B |
| Pace Trip Longshot | — | — |
| Connections Longshot | — | — |
| Situational Longshot | — | — |
| Speed | A | A |
| Early Pace | C | B |
| Mid Pace | A | A |
| Late Pace | A | A |
| Finish Pos | A | B |
| Dirt Speed | B | A |
| Turf Speed | A | A |
| Distance Speed | D | A |
| Trainer Effectiveness | B | B |
| Jockey Effectiveness | C | D |
| 3rd Party Ratings | B | A |
| Recent
Performance analysis from the horse's recent races, weighted to reflect current form. Sprint and Route FPS (Foot Per Second) measure pace efficiency over the horse's recent sprints and routes respectively. Grading scale: A = elite • B = above average • C = average • D = below average • F = poor • — = no data |
||
| Speed | A | A |
| Early Pace | F | C |
| Mid Pace | A | A |
| Late Pace | A | A |
| Sprint FPS | F | C |
| Route FPS | D | B |
| Trainer Effectiveness | B | B |
| Jockey Effectiveness | C | D |
| 3rd Party Ratings | B | A |
| Predictions
AI-generated projections for the upcoming race, derived from prior AI analysis for speed and pace trends, surface and distance suitability, and current conditions. Grading scale: A = elite • B = above average • C = average • D = below average • F = poor • — = no data |
||
| Speed | A | A |
| Early Pace | F | B |
| Mid Pace | A | A |
| Late Pace | C | C |
Chart Guide (2.0.41)
What it shows: This horse’s recent races, one bubble per race, plotted by its AI speed figure against the class par for today’s race (the dashed line).
What to look for: Recent bubbles at or above the dashed line, a trend line angled up, and a narrow shaded band (steady form). Check whether the good runs came on today’s surface and distance.
- Bubbles
- Color = surface: green (turf), brown (dirt), blue (synthetic)
- Top number = finishing position; bottom number in parentheses = starting post position
- Height above line = beaten lengths — closer means a smaller margin
- Border = track conditions: green (FST/GD/FM), yellow (WF/SL/YLD), red (SY/MY/FRZ/SFT/HVY)
- Connecting Line
- Solid = good conditions; dashed = bad conditions
- Line Symbol
- ▲ Triangle = sprint (7f or less); ● Circle = route (more than 7f)
- Days Between Races
- Small number above each bubble (e.g. 19d) = days since the previous race — helps spot freshness, layoffs, and tight scheduling.
- Shaded Band (Bollinger)
- Highlights volatility — a wider band means more variation in recent performance
- Performance Trend
- Straight line showing the overall performance direction — angled up = improving, angled down = declining
- Dashed Reference Line
- AI Opponent = AI analysis class-level par for the race
AI Model History Guide
What it shows: How our AI models rated this horse in each of its recent races, compared with how they rate today’s field (the dashed lines).
What to look for: Lines that are rising and sit above the dashed field averages — the models have liked this horse and still do. Falling lines, or lines below the dashed ones, mean the models are cooling on it.
- Lines
- Each solid line shows this horse’s model score over its last 10 races: blue = Mod1, green = Mod2, amber = Mod3.
- Dashed Lines
- Dashed lines represent the current race’s field average for each model — a score below the dashed line indicates the horse ranked below average in this model’s assessment.
- Higher is Stronger
- All three model scores are 0–100: a higher number means the model rates this horse more favorably among the field.
Mod1(W): 82 (1/8) Mod2(W): 75 (2/8) Mod3(W): 79 (3/8) Mod1-LS: 55 (6/8) Win Prob: 18.4% Value Score: 1.35 ★
Performance vs. Peers Guide
What it shows: Each horse’s career, last-3-race and last-race performance side by side, against the field average.
What to look for: Horses above the field average whose last race is green (better than their average) and whose trend line rises — improving form. Red last races and falling lines point to declining form.
- Bars (per post)
- Blue = avg career performance • Amber = avg last 3 races • Green = last race (improved vs. avg) • Red = last race (declined vs. avg)
- Trend Line
- Angled line above the bars: rising = improving form • falling = declining form.
- Horizontal Line
- Field average — the mean career performance of all horses in this race.
- Color Circles
- Standard post-position colors below each lane — same as the Total Pace chart.
- Border
- Thicker border = this horse’s post position.
Figure Comparison
What it shows: This horse’s ratings, speed figures and pace figures next to every other horse in the race.
What to look for: Where this horse (the darker column) leads the field or falls short. Strong ratings plus strong recent speed make a contender; recent speed well above career speed suggests improving form.
- Rating
- The three Pick Pony algorithm ratings (Algo 1, Algo 2, Algo 3) that make up the overall PP AI Rating — higher is a stronger contender rating.
- Speed
- Career average speed, recent 3-race average, and last-race speed figure — spot horses in improving or declining form.
- Pace
- Average Early (E1), Mid (E2), and Stretch (LP) pace figures — reveals pace-setters vs. closers vs. all-the-way types.
- This horse
- The horse whose stats card is open is highlighted with a darker column background.
Winning Profiles
What it shows: Each horse’s win rate and in-the-money rate over its last 10 starts, one dot per horse.
What to look for: Dots in the top-right are consistent winners. Top-left horses often finish in the money but rarely win — better for place and show bets or underneath in exotics. Bottom-left horses rarely finish well.
- Axes
- X: Win % from last 10 starts — Y: In-the-money % (top-3 finishes) from last 10 starts.
- Quadrants
- Consistent Winners (top-right): high win & ITM — reliable performers.
Place Threats (top-left): boards often but doesn’t win often — good exacta/trifecta angles.
Streaky (bottom-right): wins occasionally, misses the board often — all-or-nothing.
Developing (bottom-left): still finding form — longshot territory. - Reference Lines
- Dashed lines mark field averages. Dots to the right win more; dots higher board more.
- This horse
- Highlighted with a gold border and larger dot.
AI Model Comparison
What it shows: All AI model scores for every horse in the race, grouped by what each model is trained to find.
What to look for: The horse leading the green winner models is the models’ likely winner. A horse that stands out in the red longshot models but not the green ones is a longshot the models think is underrated.
- Winner Models (green)
- Mod1(W), Mod2(W), and Mod3(W) trained to predict race winners. Higher score = stronger contender.
- Longshot Models (red)
- Mod1-LS, Mod2-LS, and Mod3-LS trained to find high-value longshots. Higher score = stronger longshot candidate.
- Form Model (blue)
- Mod4 sequence model trained on recent form patterns. Higher score = stronger recent form profile.
- This horse
- Highlighted with a darker column background.
Race Pace Simulation Guide
What it shows: A simulated run of today’s race, based on each horse’s running style, post position and the expected pace.
What to look for: Who gets the lead, who gets boxed in, and who is gaining at the finish. Move the track-bias slider to see how the predicted order changes on a speed-favouring or closer-favouring track.
- Slider
- Drag left→right to advance from gate to finish. Drag all the way back to reset the race.
- Predicted Finish Order
- Factors in contested pace burn, each horse’s effort curve (peaked-early vs. peaked-late), and wide trip cost from outside posts. Updated live when Track Bias changes.
- Pace Scenario
- Lone Speed: single E horse likely rates and holds. Contested: two E horses burn each other — closers benefit. Hot Pace: speed meltdown, deep closers thrive. Soft: no early speed, moderate fractions throughout.
- Track Bias
- Slider below canvas. −2 = strong closer/wet bias; +2 = strong speed/rail bias. Recomputes the predicted finish order.
- Boxed Indicator
- Dashed orange ring = horse is surrounded (rival ahead, rival behind, wall outside). In a real race this horse must find a clear path to run.
- Running Styles
- E/EE = early speed (rushes to rail). P = presser (stalks the pace). S = stalker. SS = slow starter / closer.
| Stat | vs. Current Card | vs. All Horses |
|---|---|---|
| Averages
Career-average metrics across all AI race analysis. Performance and pace averages reflect estimated historical performance; trainer and jockey grades score in-the-money percentages. Grading scale: A = elite • B = above average • C = average • D = below average • F = poor • — = no data |
||
| Pick Pony AI Rating | A | B |
| Pace Trip Longshot | — | — |
| Connections Longshot | — | — |
| Situational Longshot | — | — |
| Speed | B | A |
| Early Pace | D | B |
| Mid Pace | D | A |
| Late Pace | B | A |
| Finish Pos | D | C |
| Dirt Speed | C | A |
| Turf Speed | A | A |
| Distance Speed | C | A |
| Trainer Effectiveness | F | C |
| Jockey Effectiveness | D | D |
| 3rd Party Ratings | A | A |
| Recent
Performance analysis from the horse's recent races, weighted to reflect current form. Sprint and Route FPS (Foot Per Second) measure pace efficiency over the horse's recent sprints and routes respectively. Grading scale: A = elite • B = above average • C = average • D = below average • F = poor • — = no data |
||
| Speed | B | A |
| Early Pace | B | A |
| Mid Pace | A | A |
| Late Pace | D | B |
| Sprint FPS | A | A |
| Route FPS | C | B |
| Trainer Effectiveness | F | C |
| Jockey Effectiveness | D | D |
| 3rd Party Ratings | A | A |
| Predictions
AI-generated projections for the upcoming race, derived from prior AI analysis for speed and pace trends, surface and distance suitability, and current conditions. Grading scale: A = elite • B = above average • C = average • D = below average • F = poor • — = no data |
||
| Speed | B | A |
| Early Pace | C | B |
| Mid Pace | D | A |
| Late Pace | C | C |
Chart Guide (2.0.41)
What it shows: This horse’s recent races, one bubble per race, plotted by its AI speed figure against the class par for today’s race (the dashed line).
What to look for: Recent bubbles at or above the dashed line, a trend line angled up, and a narrow shaded band (steady form). Check whether the good runs came on today’s surface and distance.
- Bubbles
- Color = surface: green (turf), brown (dirt), blue (synthetic)
- Top number = finishing position; bottom number in parentheses = starting post position
- Height above line = beaten lengths — closer means a smaller margin
- Border = track conditions: green (FST/GD/FM), yellow (WF/SL/YLD), red (SY/MY/FRZ/SFT/HVY)
- Connecting Line
- Solid = good conditions; dashed = bad conditions
- Line Symbol
- ▲ Triangle = sprint (7f or less); ● Circle = route (more than 7f)
- Days Between Races
- Small number above each bubble (e.g. 19d) = days since the previous race — helps spot freshness, layoffs, and tight scheduling.
- Shaded Band (Bollinger)
- Highlights volatility — a wider band means more variation in recent performance
- Performance Trend
- Straight line showing the overall performance direction — angled up = improving, angled down = declining
- Dashed Reference Line
- AI Opponent = AI analysis class-level par for the race
AI Model History Guide
What it shows: How our AI models rated this horse in each of its recent races, compared with how they rate today’s field (the dashed lines).
What to look for: Lines that are rising and sit above the dashed field averages — the models have liked this horse and still do. Falling lines, or lines below the dashed ones, mean the models are cooling on it.
- Lines
- Each solid line shows this horse’s model score over its last 10 races: blue = Mod1, green = Mod2, amber = Mod3.
- Dashed Lines
- Dashed lines represent the current race’s field average for each model — a score below the dashed line indicates the horse ranked below average in this model’s assessment.
- Higher is Stronger
- All three model scores are 0–100: a higher number means the model rates this horse more favorably among the field.
Mod1(W): 82 (1/8) Mod2(W): 75 (2/8) Mod3(W): 79 (3/8) Mod1-LS: 55 (6/8) Win Prob: 18.4% Value Score: 1.35 ★
Performance vs. Peers Guide
What it shows: Each horse’s career, last-3-race and last-race performance side by side, against the field average.
What to look for: Horses above the field average whose last race is green (better than their average) and whose trend line rises — improving form. Red last races and falling lines point to declining form.
- Bars (per post)
- Blue = avg career performance • Amber = avg last 3 races • Green = last race (improved vs. avg) • Red = last race (declined vs. avg)
- Trend Line
- Angled line above the bars: rising = improving form • falling = declining form.
- Horizontal Line
- Field average — the mean career performance of all horses in this race.
- Color Circles
- Standard post-position colors below each lane — same as the Total Pace chart.
- Border
- Thicker border = this horse’s post position.
Figure Comparison
What it shows: This horse’s ratings, speed figures and pace figures next to every other horse in the race.
What to look for: Where this horse (the darker column) leads the field or falls short. Strong ratings plus strong recent speed make a contender; recent speed well above career speed suggests improving form.
- Rating
- The three Pick Pony algorithm ratings (Algo 1, Algo 2, Algo 3) that make up the overall PP AI Rating — higher is a stronger contender rating.
- Speed
- Career average speed, recent 3-race average, and last-race speed figure — spot horses in improving or declining form.
- Pace
- Average Early (E1), Mid (E2), and Stretch (LP) pace figures — reveals pace-setters vs. closers vs. all-the-way types.
- This horse
- The horse whose stats card is open is highlighted with a darker column background.
Winning Profiles
What it shows: Each horse’s win rate and in-the-money rate over its last 10 starts, one dot per horse.
What to look for: Dots in the top-right are consistent winners. Top-left horses often finish in the money but rarely win — better for place and show bets or underneath in exotics. Bottom-left horses rarely finish well.
- Axes
- X: Win % from last 10 starts — Y: In-the-money % (top-3 finishes) from last 10 starts.
- Quadrants
- Consistent Winners (top-right): high win & ITM — reliable performers.
Place Threats (top-left): boards often but doesn’t win often — good exacta/trifecta angles.
Streaky (bottom-right): wins occasionally, misses the board often — all-or-nothing.
Developing (bottom-left): still finding form — longshot territory. - Reference Lines
- Dashed lines mark field averages. Dots to the right win more; dots higher board more.
- This horse
- Highlighted with a gold border and larger dot.
AI Model Comparison
What it shows: All AI model scores for every horse in the race, grouped by what each model is trained to find.
What to look for: The horse leading the green winner models is the models’ likely winner. A horse that stands out in the red longshot models but not the green ones is a longshot the models think is underrated.
- Winner Models (green)
- Mod1(W), Mod2(W), and Mod3(W) trained to predict race winners. Higher score = stronger contender.
- Longshot Models (red)
- Mod1-LS, Mod2-LS, and Mod3-LS trained to find high-value longshots. Higher score = stronger longshot candidate.
- Form Model (blue)
- Mod4 sequence model trained on recent form patterns. Higher score = stronger recent form profile.
- This horse
- Highlighted with a darker column background.
Race Pace Simulation Guide
What it shows: A simulated run of today’s race, based on each horse’s running style, post position and the expected pace.
What to look for: Who gets the lead, who gets boxed in, and who is gaining at the finish. Move the track-bias slider to see how the predicted order changes on a speed-favouring or closer-favouring track.
- Slider
- Drag left→right to advance from gate to finish. Drag all the way back to reset the race.
- Predicted Finish Order
- Factors in contested pace burn, each horse’s effort curve (peaked-early vs. peaked-late), and wide trip cost from outside posts. Updated live when Track Bias changes.
- Pace Scenario
- Lone Speed: single E horse likely rates and holds. Contested: two E horses burn each other — closers benefit. Hot Pace: speed meltdown, deep closers thrive. Soft: no early speed, moderate fractions throughout.
- Track Bias
- Slider below canvas. −2 = strong closer/wet bias; +2 = strong speed/rail bias. Recomputes the predicted finish order.
- Boxed Indicator
- Dashed orange ring = horse is surrounded (rival ahead, rival behind, wall outside). In a real race this horse must find a clear path to run.
- Running Styles
- E/EE = early speed (rushes to rail). P = presser (stalks the pace). S = stalker. SS = slow starter / closer.
| Stat | vs. Current Card | vs. All Horses |
|---|---|---|
| Averages
Career-average metrics across all AI race analysis. Performance and pace averages reflect estimated historical performance; trainer and jockey grades score in-the-money percentages. Grading scale: A = elite • B = above average • C = average • D = below average • F = poor • — = no data |
||
| Pick Pony AI Rating | C | B |
| Pace Trip Longshot | — | — |
| Connections Longshot | — | — |
| Situational Longshot | — | — |
| Speed | C | A |
| Early Pace | A | A |
| Mid Pace | A | A |
| Late Pace | C | A |
| Finish Pos | B | B |
| Dirt Speed | A | A |
| Turf Speed | D | D |
| Distance Speed | A | A |
| Trainer Effectiveness | C | B |
| Jockey Effectiveness | B | C |
| 3rd Party Ratings | C | A |
| Recent
Performance analysis from the horse's recent races, weighted to reflect current form. Sprint and Route FPS (Foot Per Second) measure pace efficiency over the horse's recent sprints and routes respectively. Grading scale: A = elite • B = above average • C = average • D = below average • F = poor • — = no data |
||
| Speed | D | A |
| Early Pace | A | A |
| Mid Pace | B | A |
| Late Pace | C | A |
| Sprint FPS | D | B |
| Route FPS | A | A |
| Trainer Effectiveness | C | B |
| Jockey Effectiveness | B | C |
| 3rd Party Ratings | C | A |
| Predictions
AI-generated projections for the upcoming race, derived from prior AI analysis for speed and pace trends, surface and distance suitability, and current conditions. Grading scale: A = elite • B = above average • C = average • D = below average • F = poor • — = no data |
||
| Speed | C | A |
| Early Pace | A | A |
| Mid Pace | A | A |
| Late Pace | C | C |
Chart Guide (2.0.41)
What it shows: This horse’s recent races, one bubble per race, plotted by its AI speed figure against the class par for today’s race (the dashed line).
What to look for: Recent bubbles at or above the dashed line, a trend line angled up, and a narrow shaded band (steady form). Check whether the good runs came on today’s surface and distance.
- Bubbles
- Color = surface: green (turf), brown (dirt), blue (synthetic)
- Top number = finishing position; bottom number in parentheses = starting post position
- Height above line = beaten lengths — closer means a smaller margin
- Border = track conditions: green (FST/GD/FM), yellow (WF/SL/YLD), red (SY/MY/FRZ/SFT/HVY)
- Connecting Line
- Solid = good conditions; dashed = bad conditions
- Line Symbol
- ▲ Triangle = sprint (7f or less); ● Circle = route (more than 7f)
- Days Between Races
- Small number above each bubble (e.g. 19d) = days since the previous race — helps spot freshness, layoffs, and tight scheduling.
- Shaded Band (Bollinger)
- Highlights volatility — a wider band means more variation in recent performance
- Performance Trend
- Straight line showing the overall performance direction — angled up = improving, angled down = declining
- Dashed Reference Line
- AI Opponent = AI analysis class-level par for the race
AI Model History Guide
What it shows: How our AI models rated this horse in each of its recent races, compared with how they rate today’s field (the dashed lines).
What to look for: Lines that are rising and sit above the dashed field averages — the models have liked this horse and still do. Falling lines, or lines below the dashed ones, mean the models are cooling on it.
- Lines
- Each solid line shows this horse’s model score over its last 10 races: blue = Mod1, green = Mod2, amber = Mod3.
- Dashed Lines
- Dashed lines represent the current race’s field average for each model — a score below the dashed line indicates the horse ranked below average in this model’s assessment.
- Higher is Stronger
- All three model scores are 0–100: a higher number means the model rates this horse more favorably among the field.
Mod1(W): 82 (1/8) Mod2(W): 75 (2/8) Mod3(W): 79 (3/8) Mod1-LS: 55 (6/8) Win Prob: 18.4% Value Score: 1.35 ★
Performance vs. Peers Guide
What it shows: Each horse’s career, last-3-race and last-race performance side by side, against the field average.
What to look for: Horses above the field average whose last race is green (better than their average) and whose trend line rises — improving form. Red last races and falling lines point to declining form.
- Bars (per post)
- Blue = avg career performance • Amber = avg last 3 races • Green = last race (improved vs. avg) • Red = last race (declined vs. avg)
- Trend Line
- Angled line above the bars: rising = improving form • falling = declining form.
- Horizontal Line
- Field average — the mean career performance of all horses in this race.
- Color Circles
- Standard post-position colors below each lane — same as the Total Pace chart.
- Border
- Thicker border = this horse’s post position.
Figure Comparison
What it shows: This horse’s ratings, speed figures and pace figures next to every other horse in the race.
What to look for: Where this horse (the darker column) leads the field or falls short. Strong ratings plus strong recent speed make a contender; recent speed well above career speed suggests improving form.
- Rating
- The three Pick Pony algorithm ratings (Algo 1, Algo 2, Algo 3) that make up the overall PP AI Rating — higher is a stronger contender rating.
- Speed
- Career average speed, recent 3-race average, and last-race speed figure — spot horses in improving or declining form.
- Pace
- Average Early (E1), Mid (E2), and Stretch (LP) pace figures — reveals pace-setters vs. closers vs. all-the-way types.
- This horse
- The horse whose stats card is open is highlighted with a darker column background.
Winning Profiles
What it shows: Each horse’s win rate and in-the-money rate over its last 10 starts, one dot per horse.
What to look for: Dots in the top-right are consistent winners. Top-left horses often finish in the money but rarely win — better for place and show bets or underneath in exotics. Bottom-left horses rarely finish well.
- Axes
- X: Win % from last 10 starts — Y: In-the-money % (top-3 finishes) from last 10 starts.
- Quadrants
- Consistent Winners (top-right): high win & ITM — reliable performers.
Place Threats (top-left): boards often but doesn’t win often — good exacta/trifecta angles.
Streaky (bottom-right): wins occasionally, misses the board often — all-or-nothing.
Developing (bottom-left): still finding form — longshot territory. - Reference Lines
- Dashed lines mark field averages. Dots to the right win more; dots higher board more.
- This horse
- Highlighted with a gold border and larger dot.
AI Model Comparison
What it shows: All AI model scores for every horse in the race, grouped by what each model is trained to find.
What to look for: The horse leading the green winner models is the models’ likely winner. A horse that stands out in the red longshot models but not the green ones is a longshot the models think is underrated.
- Winner Models (green)
- Mod1(W), Mod2(W), and Mod3(W) trained to predict race winners. Higher score = stronger contender.
- Longshot Models (red)
- Mod1-LS, Mod2-LS, and Mod3-LS trained to find high-value longshots. Higher score = stronger longshot candidate.
- Form Model (blue)
- Mod4 sequence model trained on recent form patterns. Higher score = stronger recent form profile.
- This horse
- Highlighted with a darker column background.
Race Pace Simulation Guide
What it shows: A simulated run of today’s race, based on each horse’s running style, post position and the expected pace.
What to look for: Who gets the lead, who gets boxed in, and who is gaining at the finish. Move the track-bias slider to see how the predicted order changes on a speed-favouring or closer-favouring track.
- Slider
- Drag left→right to advance from gate to finish. Drag all the way back to reset the race.
- Predicted Finish Order
- Factors in contested pace burn, each horse’s effort curve (peaked-early vs. peaked-late), and wide trip cost from outside posts. Updated live when Track Bias changes.
- Pace Scenario
- Lone Speed: single E horse likely rates and holds. Contested: two E horses burn each other — closers benefit. Hot Pace: speed meltdown, deep closers thrive. Soft: no early speed, moderate fractions throughout.
- Track Bias
- Slider below canvas. −2 = strong closer/wet bias; +2 = strong speed/rail bias. Recomputes the predicted finish order.
- Boxed Indicator
- Dashed orange ring = horse is surrounded (rival ahead, rival behind, wall outside). In a real race this horse must find a clear path to run.
- Running Styles
- E/EE = early speed (rushes to rail). P = presser (stalks the pace). S = stalker. SS = slow starter / closer.
| Stat | vs. Current Card | vs. All Horses |
|---|---|---|
| Averages
Career-average metrics across all AI race analysis. Performance and pace averages reflect estimated historical performance; trainer and jockey grades score in-the-money percentages. Grading scale: A = elite • B = above average • C = average • D = below average • F = poor • — = no data |
||
| Pick Pony AI Rating | D | C |
| Pace Trip Longshot | — | — |
| Connections Longshot | — | — |
| Situational Longshot | — | — |
| Speed | A | A |
| Early Pace | D | B |
| Mid Pace | C | A |
| Late Pace | A | A |
| Finish Pos | A | A |
| Dirt Speed | A | A |
| Turf Speed | B | A |
| Distance Speed | D | A |
| Trainer Effectiveness | D | C |
| Jockey Effectiveness | A | B |
| 3rd Party Ratings | A | A |
| Recent
Performance analysis from the horse's recent races, weighted to reflect current form. Sprint and Route FPS (Foot Per Second) measure pace efficiency over the horse's recent sprints and routes respectively. Grading scale: A = elite • B = above average • C = average • D = below average • F = poor • — = no data |
||
| Speed | A | A |
| Early Pace | D | C |
| Mid Pace | F | B |
| Late Pace | A | A |
| Sprint FPS | B | A |
| Route FPS | A | A |
| Trainer Effectiveness | D | C |
| Jockey Effectiveness | A | B |
| 3rd Party Ratings | A | A |
| Predictions
AI-generated projections for the upcoming race, derived from prior AI analysis for speed and pace trends, surface and distance suitability, and current conditions. Grading scale: A = elite • B = above average • C = average • D = below average • F = poor • — = no data |
||
| Speed | A | A |
| Early Pace | D | B |
| Mid Pace | C | A |
| Late Pace | C | C |
Chart Guide (2.0.41)
What it shows: This horse’s recent races, one bubble per race, plotted by its AI speed figure against the class par for today’s race (the dashed line).
What to look for: Recent bubbles at or above the dashed line, a trend line angled up, and a narrow shaded band (steady form). Check whether the good runs came on today’s surface and distance.
- Bubbles
- Color = surface: green (turf), brown (dirt), blue (synthetic)
- Top number = finishing position; bottom number in parentheses = starting post position
- Height above line = beaten lengths — closer means a smaller margin
- Border = track conditions: green (FST/GD/FM), yellow (WF/SL/YLD), red (SY/MY/FRZ/SFT/HVY)
- Connecting Line
- Solid = good conditions; dashed = bad conditions
- Line Symbol
- ▲ Triangle = sprint (7f or less); ● Circle = route (more than 7f)
- Days Between Races
- Small number above each bubble (e.g. 19d) = days since the previous race — helps spot freshness, layoffs, and tight scheduling.
- Shaded Band (Bollinger)
- Highlights volatility — a wider band means more variation in recent performance
- Performance Trend
- Straight line showing the overall performance direction — angled up = improving, angled down = declining
- Dashed Reference Line
- AI Opponent = AI analysis class-level par for the race
AI Model History Guide
What it shows: How our AI models rated this horse in each of its recent races, compared with how they rate today’s field (the dashed lines).
What to look for: Lines that are rising and sit above the dashed field averages — the models have liked this horse and still do. Falling lines, or lines below the dashed ones, mean the models are cooling on it.
- Lines
- Each solid line shows this horse’s model score over its last 10 races: blue = Mod1, green = Mod2, amber = Mod3.
- Dashed Lines
- Dashed lines represent the current race’s field average for each model — a score below the dashed line indicates the horse ranked below average in this model’s assessment.
- Higher is Stronger
- All three model scores are 0–100: a higher number means the model rates this horse more favorably among the field.
Mod1(W): 82 (1/8) Mod2(W): 75 (2/8) Mod3(W): 79 (3/8) Mod1-LS: 55 (6/8) Win Prob: 18.4% Value Score: 1.35 ★
Performance vs. Peers Guide
What it shows: Each horse’s career, last-3-race and last-race performance side by side, against the field average.
What to look for: Horses above the field average whose last race is green (better than their average) and whose trend line rises — improving form. Red last races and falling lines point to declining form.
- Bars (per post)
- Blue = avg career performance • Amber = avg last 3 races • Green = last race (improved vs. avg) • Red = last race (declined vs. avg)
- Trend Line
- Angled line above the bars: rising = improving form • falling = declining form.
- Horizontal Line
- Field average — the mean career performance of all horses in this race.
- Color Circles
- Standard post-position colors below each lane — same as the Total Pace chart.
- Border
- Thicker border = this horse’s post position.
Figure Comparison
What it shows: This horse’s ratings, speed figures and pace figures next to every other horse in the race.
What to look for: Where this horse (the darker column) leads the field or falls short. Strong ratings plus strong recent speed make a contender; recent speed well above career speed suggests improving form.
- Rating
- The three Pick Pony algorithm ratings (Algo 1, Algo 2, Algo 3) that make up the overall PP AI Rating — higher is a stronger contender rating.
- Speed
- Career average speed, recent 3-race average, and last-race speed figure — spot horses in improving or declining form.
- Pace
- Average Early (E1), Mid (E2), and Stretch (LP) pace figures — reveals pace-setters vs. closers vs. all-the-way types.
- This horse
- The horse whose stats card is open is highlighted with a darker column background.
Winning Profiles
What it shows: Each horse’s win rate and in-the-money rate over its last 10 starts, one dot per horse.
What to look for: Dots in the top-right are consistent winners. Top-left horses often finish in the money but rarely win — better for place and show bets or underneath in exotics. Bottom-left horses rarely finish well.
- Axes
- X: Win % from last 10 starts — Y: In-the-money % (top-3 finishes) from last 10 starts.
- Quadrants
- Consistent Winners (top-right): high win & ITM — reliable performers.
Place Threats (top-left): boards often but doesn’t win often — good exacta/trifecta angles.
Streaky (bottom-right): wins occasionally, misses the board often — all-or-nothing.
Developing (bottom-left): still finding form — longshot territory. - Reference Lines
- Dashed lines mark field averages. Dots to the right win more; dots higher board more.
- This horse
- Highlighted with a gold border and larger dot.
AI Model Comparison
What it shows: All AI model scores for every horse in the race, grouped by what each model is trained to find.
What to look for: The horse leading the green winner models is the models’ likely winner. A horse that stands out in the red longshot models but not the green ones is a longshot the models think is underrated.
- Winner Models (green)
- Mod1(W), Mod2(W), and Mod3(W) trained to predict race winners. Higher score = stronger contender.
- Longshot Models (red)
- Mod1-LS, Mod2-LS, and Mod3-LS trained to find high-value longshots. Higher score = stronger longshot candidate.
- Form Model (blue)
- Mod4 sequence model trained on recent form patterns. Higher score = stronger recent form profile.
- This horse
- Highlighted with a darker column background.
Race Pace Simulation Guide
What it shows: A simulated run of today’s race, based on each horse’s running style, post position and the expected pace.
What to look for: Who gets the lead, who gets boxed in, and who is gaining at the finish. Move the track-bias slider to see how the predicted order changes on a speed-favouring or closer-favouring track.
- Slider
- Drag left→right to advance from gate to finish. Drag all the way back to reset the race.
- Predicted Finish Order
- Factors in contested pace burn, each horse’s effort curve (peaked-early vs. peaked-late), and wide trip cost from outside posts. Updated live when Track Bias changes.
- Pace Scenario
- Lone Speed: single E horse likely rates and holds. Contested: two E horses burn each other — closers benefit. Hot Pace: speed meltdown, deep closers thrive. Soft: no early speed, moderate fractions throughout.
- Track Bias
- Slider below canvas. −2 = strong closer/wet bias; +2 = strong speed/rail bias. Recomputes the predicted finish order.
- Boxed Indicator
- Dashed orange ring = horse is surrounded (rival ahead, rival behind, wall outside). In a real race this horse must find a clear path to run.
- Running Styles
- E/EE = early speed (rushes to rail). P = presser (stalks the pace). S = stalker. SS = slow starter / closer.
| Stat | vs. Current Card | vs. All Horses |
|---|---|---|
| Averages
Career-average metrics across all AI race analysis. Performance and pace averages reflect estimated historical performance; trainer and jockey grades score in-the-money percentages. Grading scale: A = elite • B = above average • C = average • D = below average • F = poor • — = no data |
||
| Pick Pony AI Rating | D | C |
| Pace Trip Longshot | — | — |
| Connections Longshot | — | — |
| Situational Longshot | — | — |
| Speed | C | B |
| Early Pace | D | D |
| Mid Pace | F | C |
| Late Pace | B | A |
| Finish Pos | D | C |
| Dirt Speed | D | F |
| Turf Speed | D | A |
| Distance Speed | B | A |
| Trainer Effectiveness | D | B |
| Jockey Effectiveness | D | C |
| 3rd Party Ratings | D | A |
| Recent
Performance analysis from the horse's recent races, weighted to reflect current form. Sprint and Route FPS (Foot Per Second) measure pace efficiency over the horse's recent sprints and routes respectively. Grading scale: A = elite • B = above average • C = average • D = below average • F = poor • — = no data |
||
| Speed | D | A |
| Early Pace | D | D |
| Mid Pace | F | C |
| Late Pace | A | A |
| Sprint FPS | B | B |
| Route FPS | C | B |
| Trainer Effectiveness | D | B |
| Jockey Effectiveness | D | C |
| 3rd Party Ratings | D | A |
| Predictions
AI-generated projections for the upcoming race, derived from prior AI analysis for speed and pace trends, surface and distance suitability, and current conditions. Grading scale: A = elite • B = above average • C = average • D = below average • F = poor • — = no data |
||
| Speed | D | B |
| Early Pace | D | C |
| Mid Pace | F | D |
| Late Pace | C | C |
Chart Guide (2.0.41)
What it shows: This horse’s recent races, one bubble per race, plotted by its AI speed figure against the class par for today’s race (the dashed line).
What to look for: Recent bubbles at or above the dashed line, a trend line angled up, and a narrow shaded band (steady form). Check whether the good runs came on today’s surface and distance.
- Bubbles
- Color = surface: green (turf), brown (dirt), blue (synthetic)
- Top number = finishing position; bottom number in parentheses = starting post position
- Height above line = beaten lengths — closer means a smaller margin
- Border = track conditions: green (FST/GD/FM), yellow (WF/SL/YLD), red (SY/MY/FRZ/SFT/HVY)
- Connecting Line
- Solid = good conditions; dashed = bad conditions
- Line Symbol
- ▲ Triangle = sprint (7f or less); ● Circle = route (more than 7f)
- Days Between Races
- Small number above each bubble (e.g. 19d) = days since the previous race — helps spot freshness, layoffs, and tight scheduling.
- Shaded Band (Bollinger)
- Highlights volatility — a wider band means more variation in recent performance
- Performance Trend
- Straight line showing the overall performance direction — angled up = improving, angled down = declining
- Dashed Reference Line
- AI Opponent = AI analysis class-level par for the race
AI Model History Guide
What it shows: How our AI models rated this horse in each of its recent races, compared with how they rate today’s field (the dashed lines).
What to look for: Lines that are rising and sit above the dashed field averages — the models have liked this horse and still do. Falling lines, or lines below the dashed ones, mean the models are cooling on it.
- Lines
- Each solid line shows this horse’s model score over its last 10 races: blue = Mod1, green = Mod2, amber = Mod3.
- Dashed Lines
- Dashed lines represent the current race’s field average for each model — a score below the dashed line indicates the horse ranked below average in this model’s assessment.
- Higher is Stronger
- All three model scores are 0–100: a higher number means the model rates this horse more favorably among the field.
Mod1(W): 82 (1/8) Mod2(W): 75 (2/8) Mod3(W): 79 (3/8) Mod1-LS: 55 (6/8) Win Prob: 18.4% Value Score: 1.35 ★
Performance vs. Peers Guide
What it shows: Each horse’s career, last-3-race and last-race performance side by side, against the field average.
What to look for: Horses above the field average whose last race is green (better than their average) and whose trend line rises — improving form. Red last races and falling lines point to declining form.
- Bars (per post)
- Blue = avg career performance • Amber = avg last 3 races • Green = last race (improved vs. avg) • Red = last race (declined vs. avg)
- Trend Line
- Angled line above the bars: rising = improving form • falling = declining form.
- Horizontal Line
- Field average — the mean career performance of all horses in this race.
- Color Circles
- Standard post-position colors below each lane — same as the Total Pace chart.
- Border
- Thicker border = this horse’s post position.
Figure Comparison
What it shows: This horse’s ratings, speed figures and pace figures next to every other horse in the race.
What to look for: Where this horse (the darker column) leads the field or falls short. Strong ratings plus strong recent speed make a contender; recent speed well above career speed suggests improving form.
- Rating
- The three Pick Pony algorithm ratings (Algo 1, Algo 2, Algo 3) that make up the overall PP AI Rating — higher is a stronger contender rating.
- Speed
- Career average speed, recent 3-race average, and last-race speed figure — spot horses in improving or declining form.
- Pace
- Average Early (E1), Mid (E2), and Stretch (LP) pace figures — reveals pace-setters vs. closers vs. all-the-way types.
- This horse
- The horse whose stats card is open is highlighted with a darker column background.
Winning Profiles
What it shows: Each horse’s win rate and in-the-money rate over its last 10 starts, one dot per horse.
What to look for: Dots in the top-right are consistent winners. Top-left horses often finish in the money but rarely win — better for place and show bets or underneath in exotics. Bottom-left horses rarely finish well.
- Axes
- X: Win % from last 10 starts — Y: In-the-money % (top-3 finishes) from last 10 starts.
- Quadrants
- Consistent Winners (top-right): high win & ITM — reliable performers.
Place Threats (top-left): boards often but doesn’t win often — good exacta/trifecta angles.
Streaky (bottom-right): wins occasionally, misses the board often — all-or-nothing.
Developing (bottom-left): still finding form — longshot territory. - Reference Lines
- Dashed lines mark field averages. Dots to the right win more; dots higher board more.
- This horse
- Highlighted with a gold border and larger dot.
AI Model Comparison
What it shows: All AI model scores for every horse in the race, grouped by what each model is trained to find.
What to look for: The horse leading the green winner models is the models’ likely winner. A horse that stands out in the red longshot models but not the green ones is a longshot the models think is underrated.
- Winner Models (green)
- Mod1(W), Mod2(W), and Mod3(W) trained to predict race winners. Higher score = stronger contender.
- Longshot Models (red)
- Mod1-LS, Mod2-LS, and Mod3-LS trained to find high-value longshots. Higher score = stronger longshot candidate.
- Form Model (blue)
- Mod4 sequence model trained on recent form patterns. Higher score = stronger recent form profile.
- This horse
- Highlighted with a darker column background.
Race Pace Simulation Guide
What it shows: A simulated run of today’s race, based on each horse’s running style, post position and the expected pace.
What to look for: Who gets the lead, who gets boxed in, and who is gaining at the finish. Move the track-bias slider to see how the predicted order changes on a speed-favouring or closer-favouring track.
- Slider
- Drag left→right to advance from gate to finish. Drag all the way back to reset the race.
- Predicted Finish Order
- Factors in contested pace burn, each horse’s effort curve (peaked-early vs. peaked-late), and wide trip cost from outside posts. Updated live when Track Bias changes.
- Pace Scenario
- Lone Speed: single E horse likely rates and holds. Contested: two E horses burn each other — closers benefit. Hot Pace: speed meltdown, deep closers thrive. Soft: no early speed, moderate fractions throughout.
- Track Bias
- Slider below canvas. −2 = strong closer/wet bias; +2 = strong speed/rail bias. Recomputes the predicted finish order.
- Boxed Indicator
- Dashed orange ring = horse is surrounded (rival ahead, rival behind, wall outside). In a real race this horse must find a clear path to run.
- Running Styles
- E/EE = early speed (rushes to rail). P = presser (stalks the pace). S = stalker. SS = slow starter / closer.
| Stat | vs. Current Card | vs. All Horses |
|---|---|---|
| Averages
Career-average metrics across all AI race analysis. Performance and pace averages reflect estimated historical performance; trainer and jockey grades score in-the-money percentages. Grading scale: A = elite • B = above average • C = average • D = below average • F = poor • — = no data |
||
| Pick Pony AI Rating | A | B |
| Pace Trip Longshot | — | — |
| Connections Longshot | — | — |
| Situational Longshot | — | — |
| Speed | A | A |
| Early Pace | A | A |
| Mid Pace | A | A |
| Late Pace | A | A |
| Finish Pos | A | B |
| Dirt Speed | B | C |
| Turf Speed | B | A |
| Distance Speed | F | F |
| Trainer Effectiveness | D | B |
| Jockey Effectiveness | D | C |
| 3rd Party Ratings | A | A |
| Recent
Performance analysis from the horse's recent races, weighted to reflect current form. Sprint and Route FPS (Foot Per Second) measure pace efficiency over the horse's recent sprints and routes respectively. Grading scale: A = elite • B = above average • C = average • D = below average • F = poor • — = no data |
||
| Speed | A | A |
| Early Pace | A | A |
| Mid Pace | B | A |
| Late Pace | A | A |
| Sprint FPS | B | B |
| Route FPS | A | A |
| Trainer Effectiveness | D | B |
| Jockey Effectiveness | D | C |
| 3rd Party Ratings | A | A |
| Predictions
AI-generated projections for the upcoming race, derived from prior AI analysis for speed and pace trends, surface and distance suitability, and current conditions. Grading scale: A = elite • B = above average • C = average • D = below average • F = poor • — = no data |
||
| Speed | A | A |
| Early Pace | A | A |
| Mid Pace | A | A |
| Late Pace | C | C |
Chart Guide (2.0.41)
What it shows: This horse’s recent races, one bubble per race, plotted by its AI speed figure against the class par for today’s race (the dashed line).
What to look for: Recent bubbles at or above the dashed line, a trend line angled up, and a narrow shaded band (steady form). Check whether the good runs came on today’s surface and distance.
- Bubbles
- Color = surface: green (turf), brown (dirt), blue (synthetic)
- Top number = finishing position; bottom number in parentheses = starting post position
- Height above line = beaten lengths — closer means a smaller margin
- Border = track conditions: green (FST/GD/FM), yellow (WF/SL/YLD), red (SY/MY/FRZ/SFT/HVY)
- Connecting Line
- Solid = good conditions; dashed = bad conditions
- Line Symbol
- ▲ Triangle = sprint (7f or less); ● Circle = route (more than 7f)
- Days Between Races
- Small number above each bubble (e.g. 19d) = days since the previous race — helps spot freshness, layoffs, and tight scheduling.
- Shaded Band (Bollinger)
- Highlights volatility — a wider band means more variation in recent performance
- Performance Trend
- Straight line showing the overall performance direction — angled up = improving, angled down = declining
- Dashed Reference Line
- AI Opponent = AI analysis class-level par for the race
AI Model History Guide
What it shows: How our AI models rated this horse in each of its recent races, compared with how they rate today’s field (the dashed lines).
What to look for: Lines that are rising and sit above the dashed field averages — the models have liked this horse and still do. Falling lines, or lines below the dashed ones, mean the models are cooling on it.
- Lines
- Each solid line shows this horse’s model score over its last 10 races: blue = Mod1, green = Mod2, amber = Mod3.
- Dashed Lines
- Dashed lines represent the current race’s field average for each model — a score below the dashed line indicates the horse ranked below average in this model’s assessment.
- Higher is Stronger
- All three model scores are 0–100: a higher number means the model rates this horse more favorably among the field.
Mod1(W): 82 (1/8) Mod2(W): 75 (2/8) Mod3(W): 79 (3/8) Mod1-LS: 55 (6/8) Win Prob: 18.4% Value Score: 1.35 ★
Performance vs. Peers Guide
What it shows: Each horse’s career, last-3-race and last-race performance side by side, against the field average.
What to look for: Horses above the field average whose last race is green (better than their average) and whose trend line rises — improving form. Red last races and falling lines point to declining form.
- Bars (per post)
- Blue = avg career performance • Amber = avg last 3 races • Green = last race (improved vs. avg) • Red = last race (declined vs. avg)
- Trend Line
- Angled line above the bars: rising = improving form • falling = declining form.
- Horizontal Line
- Field average — the mean career performance of all horses in this race.
- Color Circles
- Standard post-position colors below each lane — same as the Total Pace chart.
- Border
- Thicker border = this horse’s post position.
Figure Comparison
What it shows: This horse’s ratings, speed figures and pace figures next to every other horse in the race.
What to look for: Where this horse (the darker column) leads the field or falls short. Strong ratings plus strong recent speed make a contender; recent speed well above career speed suggests improving form.
- Rating
- The three Pick Pony algorithm ratings (Algo 1, Algo 2, Algo 3) that make up the overall PP AI Rating — higher is a stronger contender rating.
- Speed
- Career average speed, recent 3-race average, and last-race speed figure — spot horses in improving or declining form.
- Pace
- Average Early (E1), Mid (E2), and Stretch (LP) pace figures — reveals pace-setters vs. closers vs. all-the-way types.
- This horse
- The horse whose stats card is open is highlighted with a darker column background.
Winning Profiles
What it shows: Each horse’s win rate and in-the-money rate over its last 10 starts, one dot per horse.
What to look for: Dots in the top-right are consistent winners. Top-left horses often finish in the money but rarely win — better for place and show bets or underneath in exotics. Bottom-left horses rarely finish well.
- Axes
- X: Win % from last 10 starts — Y: In-the-money % (top-3 finishes) from last 10 starts.
- Quadrants
- Consistent Winners (top-right): high win & ITM — reliable performers.
Place Threats (top-left): boards often but doesn’t win often — good exacta/trifecta angles.
Streaky (bottom-right): wins occasionally, misses the board often — all-or-nothing.
Developing (bottom-left): still finding form — longshot territory. - Reference Lines
- Dashed lines mark field averages. Dots to the right win more; dots higher board more.
- This horse
- Highlighted with a gold border and larger dot.
AI Model Comparison
What it shows: All AI model scores for every horse in the race, grouped by what each model is trained to find.
What to look for: The horse leading the green winner models is the models’ likely winner. A horse that stands out in the red longshot models but not the green ones is a longshot the models think is underrated.
- Winner Models (green)
- Mod1(W), Mod2(W), and Mod3(W) trained to predict race winners. Higher score = stronger contender.
- Longshot Models (red)
- Mod1-LS, Mod2-LS, and Mod3-LS trained to find high-value longshots. Higher score = stronger longshot candidate.
- Form Model (blue)
- Mod4 sequence model trained on recent form patterns. Higher score = stronger recent form profile.
- This horse
- Highlighted with a darker column background.
Race Pace Simulation Guide
What it shows: A simulated run of today’s race, based on each horse’s running style, post position and the expected pace.
What to look for: Who gets the lead, who gets boxed in, and who is gaining at the finish. Move the track-bias slider to see how the predicted order changes on a speed-favouring or closer-favouring track.
- Slider
- Drag left→right to advance from gate to finish. Drag all the way back to reset the race.
- Predicted Finish Order
- Factors in contested pace burn, each horse’s effort curve (peaked-early vs. peaked-late), and wide trip cost from outside posts. Updated live when Track Bias changes.
- Pace Scenario
- Lone Speed: single E horse likely rates and holds. Contested: two E horses burn each other — closers benefit. Hot Pace: speed meltdown, deep closers thrive. Soft: no early speed, moderate fractions throughout.
- Track Bias
- Slider below canvas. −2 = strong closer/wet bias; +2 = strong speed/rail bias. Recomputes the predicted finish order.
- Boxed Indicator
- Dashed orange ring = horse is surrounded (rival ahead, rival behind, wall outside). In a real race this horse must find a clear path to run.
- Running Styles
- E/EE = early speed (rushes to rail). P = presser (stalks the pace). S = stalker. SS = slow starter / closer.
| Stat | vs. Current Card | vs. All Horses |
|---|---|---|
| Averages
Career-average metrics across all AI race analysis. Performance and pace averages reflect estimated historical performance; trainer and jockey grades score in-the-money percentages. Grading scale: A = elite • B = above average • C = average • D = below average • F = poor • — = no data |
||
| Pick Pony AI Rating | B | C |
| Pace Trip Longshot | — | — |
| Connections Longshot | — | — |
| Situational Longshot | — | — |
| Speed | D | B |
| Early Pace | D | C |
| Mid Pace | B | B |
| Late Pace | D | B |
| Finish Pos | C | B |
| Dirt Speed | A | B |
| Turf Speed | C | A |
| Distance Speed | B | A |
| Trainer Effectiveness | C | B |
| Jockey Effectiveness | B | B |
| 3rd Party Ratings | B | A |
| Recent
Performance analysis from the horse's recent races, weighted to reflect current form. Sprint and Route FPS (Foot Per Second) measure pace efficiency over the horse's recent sprints and routes respectively. Grading scale: A = elite • B = above average • C = average • D = below average • F = poor • — = no data |
||
| Speed | D | A |
| Early Pace | F | D |
| Mid Pace | D | C |
| Late Pace | B | A |
| Sprint FPS | A | B |
| Route FPS | F | D |
| Trainer Effectiveness | C | B |
| Jockey Effectiveness | B | B |
| 3rd Party Ratings | B | A |
| Predictions
AI-generated projections for the upcoming race, derived from prior AI analysis for speed and pace trends, surface and distance suitability, and current conditions. Grading scale: A = elite • B = above average • C = average • D = below average • F = poor • — = no data |
||
| Speed | D | B |
| Early Pace | F | D |
| Mid Pace | B | B |
| Late Pace | C | C |
Chart Guide (2.0.41)
What it shows: This horse’s recent races, one bubble per race, plotted by its AI speed figure against the class par for today’s race (the dashed line).
What to look for: Recent bubbles at or above the dashed line, a trend line angled up, and a narrow shaded band (steady form). Check whether the good runs came on today’s surface and distance.
- Bubbles
- Color = surface: green (turf), brown (dirt), blue (synthetic)
- Top number = finishing position; bottom number in parentheses = starting post position
- Height above line = beaten lengths — closer means a smaller margin
- Border = track conditions: green (FST/GD/FM), yellow (WF/SL/YLD), red (SY/MY/FRZ/SFT/HVY)
- Connecting Line
- Solid = good conditions; dashed = bad conditions
- Line Symbol
- ▲ Triangle = sprint (7f or less); ● Circle = route (more than 7f)
- Days Between Races
- Small number above each bubble (e.g. 19d) = days since the previous race — helps spot freshness, layoffs, and tight scheduling.
- Shaded Band (Bollinger)
- Highlights volatility — a wider band means more variation in recent performance
- Performance Trend
- Straight line showing the overall performance direction — angled up = improving, angled down = declining
- Dashed Reference Line
- AI Opponent = AI analysis class-level par for the race
AI Model History Guide
What it shows: How our AI models rated this horse in each of its recent races, compared with how they rate today’s field (the dashed lines).
What to look for: Lines that are rising and sit above the dashed field averages — the models have liked this horse and still do. Falling lines, or lines below the dashed ones, mean the models are cooling on it.
- Lines
- Each solid line shows this horse’s model score over its last 10 races: blue = Mod1, green = Mod2, amber = Mod3.
- Dashed Lines
- Dashed lines represent the current race’s field average for each model — a score below the dashed line indicates the horse ranked below average in this model’s assessment.
- Higher is Stronger
- All three model scores are 0–100: a higher number means the model rates this horse more favorably among the field.
Mod1(W): 82 (1/8) Mod2(W): 75 (2/8) Mod3(W): 79 (3/8) Mod1-LS: 55 (6/8) Win Prob: 18.4% Value Score: 1.35 ★
Performance vs. Peers Guide
What it shows: Each horse’s career, last-3-race and last-race performance side by side, against the field average.
What to look for: Horses above the field average whose last race is green (better than their average) and whose trend line rises — improving form. Red last races and falling lines point to declining form.
- Bars (per post)
- Blue = avg career performance • Amber = avg last 3 races • Green = last race (improved vs. avg) • Red = last race (declined vs. avg)
- Trend Line
- Angled line above the bars: rising = improving form • falling = declining form.
- Horizontal Line
- Field average — the mean career performance of all horses in this race.
- Color Circles
- Standard post-position colors below each lane — same as the Total Pace chart.
- Border
- Thicker border = this horse’s post position.
Figure Comparison
What it shows: This horse’s ratings, speed figures and pace figures next to every other horse in the race.
What to look for: Where this horse (the darker column) leads the field or falls short. Strong ratings plus strong recent speed make a contender; recent speed well above career speed suggests improving form.
- Rating
- The three Pick Pony algorithm ratings (Algo 1, Algo 2, Algo 3) that make up the overall PP AI Rating — higher is a stronger contender rating.
- Speed
- Career average speed, recent 3-race average, and last-race speed figure — spot horses in improving or declining form.
- Pace
- Average Early (E1), Mid (E2), and Stretch (LP) pace figures — reveals pace-setters vs. closers vs. all-the-way types.
- This horse
- The horse whose stats card is open is highlighted with a darker column background.
Winning Profiles
What it shows: Each horse’s win rate and in-the-money rate over its last 10 starts, one dot per horse.
What to look for: Dots in the top-right are consistent winners. Top-left horses often finish in the money but rarely win — better for place and show bets or underneath in exotics. Bottom-left horses rarely finish well.
- Axes
- X: Win % from last 10 starts — Y: In-the-money % (top-3 finishes) from last 10 starts.
- Quadrants
- Consistent Winners (top-right): high win & ITM — reliable performers.
Place Threats (top-left): boards often but doesn’t win often — good exacta/trifecta angles.
Streaky (bottom-right): wins occasionally, misses the board often — all-or-nothing.
Developing (bottom-left): still finding form — longshot territory. - Reference Lines
- Dashed lines mark field averages. Dots to the right win more; dots higher board more.
- This horse
- Highlighted with a gold border and larger dot.
AI Model Comparison
What it shows: All AI model scores for every horse in the race, grouped by what each model is trained to find.
What to look for: The horse leading the green winner models is the models’ likely winner. A horse that stands out in the red longshot models but not the green ones is a longshot the models think is underrated.
- Winner Models (green)
- Mod1(W), Mod2(W), and Mod3(W) trained to predict race winners. Higher score = stronger contender.
- Longshot Models (red)
- Mod1-LS, Mod2-LS, and Mod3-LS trained to find high-value longshots. Higher score = stronger longshot candidate.
- Form Model (blue)
- Mod4 sequence model trained on recent form patterns. Higher score = stronger recent form profile.
- This horse
- Highlighted with a darker column background.
Race Pace Simulation Guide
What it shows: A simulated run of today’s race, based on each horse’s running style, post position and the expected pace.
What to look for: Who gets the lead, who gets boxed in, and who is gaining at the finish. Move the track-bias slider to see how the predicted order changes on a speed-favouring or closer-favouring track.
- Slider
- Drag left→right to advance from gate to finish. Drag all the way back to reset the race.
- Predicted Finish Order
- Factors in contested pace burn, each horse’s effort curve (peaked-early vs. peaked-late), and wide trip cost from outside posts. Updated live when Track Bias changes.
- Pace Scenario
- Lone Speed: single E horse likely rates and holds. Contested: two E horses burn each other — closers benefit. Hot Pace: speed meltdown, deep closers thrive. Soft: no early speed, moderate fractions throughout.
- Track Bias
- Slider below canvas. −2 = strong closer/wet bias; +2 = strong speed/rail bias. Recomputes the predicted finish order.
- Boxed Indicator
- Dashed orange ring = horse is surrounded (rival ahead, rival behind, wall outside). In a real race this horse must find a clear path to run.
- Running Styles
- E/EE = early speed (rushes to rail). P = presser (stalks the pace). S = stalker. SS = slow starter / closer.
| Stat | vs. Current Card | vs. All Horses |
|---|---|---|
| Averages
Career-average metrics across all AI race analysis. Performance and pace averages reflect estimated historical performance; trainer and jockey grades score in-the-money percentages. Grading scale: A = elite • B = above average • C = average • D = below average • F = poor • — = no data |
||
| Pick Pony AI Rating | B | B |
| Pace Trip Longshot | — | — |
| Connections Longshot | — | — |
| Situational Longshot | — | — |
| Speed | F | C |
| Early Pace | B | B |
| Mid Pace | C | B |
| Late Pace | F | D |
| Finish Pos | F | F |
| Dirt Speed | D | F |
| Turf Speed | C | A |
| Distance Speed | F | F |
| Trainer Effectiveness | D | B |
| Jockey Effectiveness | C | B |
| 3rd Party Ratings | C | A |
| Recent
Performance analysis from the horse's recent races, weighted to reflect current form. Sprint and Route FPS (Foot Per Second) measure pace efficiency over the horse's recent sprints and routes respectively. Grading scale: A = elite • B = above average • C = average • D = below average • F = poor • — = no data |
||
| Speed | F | B |
| Early Pace | B | A |
| Mid Pace | C | B |
| Late Pace | F | C |
| Sprint FPS | C | C |
| Route FPS | D | C |
| Trainer Effectiveness | D | B |
| Jockey Effectiveness | C | B |
| 3rd Party Ratings | C | A |
| Predictions
AI-generated projections for the upcoming race, derived from prior AI analysis for speed and pace trends, surface and distance suitability, and current conditions. Grading scale: A = elite • B = above average • C = average • D = below average • F = poor • — = no data |
||
| Speed | F | C |
| Early Pace | B | B |
| Mid Pace | C | B |
| Late Pace | C | C |
Chart Guide (2.0.41)
What it shows: This horse’s recent races, one bubble per race, plotted by its AI speed figure against the class par for today’s race (the dashed line).
What to look for: Recent bubbles at or above the dashed line, a trend line angled up, and a narrow shaded band (steady form). Check whether the good runs came on today’s surface and distance.
- Bubbles
- Color = surface: green (turf), brown (dirt), blue (synthetic)
- Top number = finishing position; bottom number in parentheses = starting post position
- Height above line = beaten lengths — closer means a smaller margin
- Border = track conditions: green (FST/GD/FM), yellow (WF/SL/YLD), red (SY/MY/FRZ/SFT/HVY)
- Connecting Line
- Solid = good conditions; dashed = bad conditions
- Line Symbol
- ▲ Triangle = sprint (7f or less); ● Circle = route (more than 7f)
- Days Between Races
- Small number above each bubble (e.g. 19d) = days since the previous race — helps spot freshness, layoffs, and tight scheduling.
- Shaded Band (Bollinger)
- Highlights volatility — a wider band means more variation in recent performance
- Performance Trend
- Straight line showing the overall performance direction — angled up = improving, angled down = declining
- Dashed Reference Line
- AI Opponent = AI analysis class-level par for the race
AI Model History Guide
What it shows: How our AI models rated this horse in each of its recent races, compared with how they rate today’s field (the dashed lines).
What to look for: Lines that are rising and sit above the dashed field averages — the models have liked this horse and still do. Falling lines, or lines below the dashed ones, mean the models are cooling on it.
- Lines
- Each solid line shows this horse’s model score over its last 10 races: blue = Mod1, green = Mod2, amber = Mod3.
- Dashed Lines
- Dashed lines represent the current race’s field average for each model — a score below the dashed line indicates the horse ranked below average in this model’s assessment.
- Higher is Stronger
- All three model scores are 0–100: a higher number means the model rates this horse more favorably among the field.
Mod1(W): 82 (1/8) Mod2(W): 75 (2/8) Mod3(W): 79 (3/8) Mod1-LS: 55 (6/8) Win Prob: 18.4% Value Score: 1.35 ★
Performance vs. Peers Guide
What it shows: Each horse’s career, last-3-race and last-race performance side by side, against the field average.
What to look for: Horses above the field average whose last race is green (better than their average) and whose trend line rises — improving form. Red last races and falling lines point to declining form.
- Bars (per post)
- Blue = avg career performance • Amber = avg last 3 races • Green = last race (improved vs. avg) • Red = last race (declined vs. avg)
- Trend Line
- Angled line above the bars: rising = improving form • falling = declining form.
- Horizontal Line
- Field average — the mean career performance of all horses in this race.
- Color Circles
- Standard post-position colors below each lane — same as the Total Pace chart.
- Border
- Thicker border = this horse’s post position.
Figure Comparison
What it shows: This horse’s ratings, speed figures and pace figures next to every other horse in the race.
What to look for: Where this horse (the darker column) leads the field or falls short. Strong ratings plus strong recent speed make a contender; recent speed well above career speed suggests improving form.
- Rating
- The three Pick Pony algorithm ratings (Algo 1, Algo 2, Algo 3) that make up the overall PP AI Rating — higher is a stronger contender rating.
- Speed
- Career average speed, recent 3-race average, and last-race speed figure — spot horses in improving or declining form.
- Pace
- Average Early (E1), Mid (E2), and Stretch (LP) pace figures — reveals pace-setters vs. closers vs. all-the-way types.
- This horse
- The horse whose stats card is open is highlighted with a darker column background.
Winning Profiles
What it shows: Each horse’s win rate and in-the-money rate over its last 10 starts, one dot per horse.
What to look for: Dots in the top-right are consistent winners. Top-left horses often finish in the money but rarely win — better for place and show bets or underneath in exotics. Bottom-left horses rarely finish well.
- Axes
- X: Win % from last 10 starts — Y: In-the-money % (top-3 finishes) from last 10 starts.
- Quadrants
- Consistent Winners (top-right): high win & ITM — reliable performers.
Place Threats (top-left): boards often but doesn’t win often — good exacta/trifecta angles.
Streaky (bottom-right): wins occasionally, misses the board often — all-or-nothing.
Developing (bottom-left): still finding form — longshot territory. - Reference Lines
- Dashed lines mark field averages. Dots to the right win more; dots higher board more.
- This horse
- Highlighted with a gold border and larger dot.
AI Model Comparison
What it shows: All AI model scores for every horse in the race, grouped by what each model is trained to find.
What to look for: The horse leading the green winner models is the models’ likely winner. A horse that stands out in the red longshot models but not the green ones is a longshot the models think is underrated.
- Winner Models (green)
- Mod1(W), Mod2(W), and Mod3(W) trained to predict race winners. Higher score = stronger contender.
- Longshot Models (red)
- Mod1-LS, Mod2-LS, and Mod3-LS trained to find high-value longshots. Higher score = stronger longshot candidate.
- Form Model (blue)
- Mod4 sequence model trained on recent form patterns. Higher score = stronger recent form profile.
- This horse
- Highlighted with a darker column background.
Race Pace Simulation Guide
What it shows: A simulated run of today’s race, based on each horse’s running style, post position and the expected pace.
What to look for: Who gets the lead, who gets boxed in, and who is gaining at the finish. Move the track-bias slider to see how the predicted order changes on a speed-favouring or closer-favouring track.
- Slider
- Drag left→right to advance from gate to finish. Drag all the way back to reset the race.
- Predicted Finish Order
- Factors in contested pace burn, each horse’s effort curve (peaked-early vs. peaked-late), and wide trip cost from outside posts. Updated live when Track Bias changes.
- Pace Scenario
- Lone Speed: single E horse likely rates and holds. Contested: two E horses burn each other — closers benefit. Hot Pace: speed meltdown, deep closers thrive. Soft: no early speed, moderate fractions throughout.
- Track Bias
- Slider below canvas. −2 = strong closer/wet bias; +2 = strong speed/rail bias. Recomputes the predicted finish order.
- Boxed Indicator
- Dashed orange ring = horse is surrounded (rival ahead, rival behind, wall outside). In a real race this horse must find a clear path to run.
- Running Styles
- E/EE = early speed (rushes to rail). P = presser (stalks the pace). S = stalker. SS = slow starter / closer.
| Stat | vs. Current Card | vs. All Horses |
|---|---|---|
| Averages
Career-average metrics across all AI race analysis. Performance and pace averages reflect estimated historical performance; trainer and jockey grades score in-the-money percentages. Grading scale: A = elite • B = above average • C = average • D = below average • F = poor • — = no data |
||
| Pick Pony AI Rating | C | C |
| Pace Trip Longshot | — | — |
| Connections Longshot | — | — |
| Situational Longshot | — | — |
| Speed | A | A |
| Early Pace | A | A |
| Mid Pace | A | A |
| Late Pace | B | A |
| Finish Pos | D | D |
| Dirt Speed | D | F |
| Turf Speed | A | A |
| Distance Speed | F | F |
| Trainer Effectiveness | F | C |
| Jockey Effectiveness | F | D |
| 3rd Party Ratings | A | A |
| Recent
Performance analysis from the horse's recent races, weighted to reflect current form. Sprint and Route FPS (Foot Per Second) measure pace efficiency over the horse's recent sprints and routes respectively. Grading scale: A = elite • B = above average • C = average • D = below average • F = poor • — = no data |
||
| Speed | B | A |
| Early Pace | A | A |
| Mid Pace | A | A |
| Late Pace | D | B |
| Sprint FPS | A | B |
| Route FPS | C | B |
| Trainer Effectiveness | F | C |
| Jockey Effectiveness | F | D |
| 3rd Party Ratings | A | A |
| Predictions
AI-generated projections for the upcoming race, derived from prior AI analysis for speed and pace trends, surface and distance suitability, and current conditions. Grading scale: A = elite • B = above average • C = average • D = below average • F = poor • — = no data |
||
| Speed | A | A |
| Early Pace | A | A |
| Mid Pace | A | A |
| Late Pace | C | C |
Chart Guide (2.0.41)
What it shows: This horse’s recent races, one bubble per race, plotted by its AI speed figure against the class par for today’s race (the dashed line).
What to look for: Recent bubbles at or above the dashed line, a trend line angled up, and a narrow shaded band (steady form). Check whether the good runs came on today’s surface and distance.
- Bubbles
- Color = surface: green (turf), brown (dirt), blue (synthetic)
- Top number = finishing position; bottom number in parentheses = starting post position
- Height above line = beaten lengths — closer means a smaller margin
- Border = track conditions: green (FST/GD/FM), yellow (WF/SL/YLD), red (SY/MY/FRZ/SFT/HVY)
- Connecting Line
- Solid = good conditions; dashed = bad conditions
- Line Symbol
- ▲ Triangle = sprint (7f or less); ● Circle = route (more than 7f)
- Days Between Races
- Small number above each bubble (e.g. 19d) = days since the previous race — helps spot freshness, layoffs, and tight scheduling.
- Shaded Band (Bollinger)
- Highlights volatility — a wider band means more variation in recent performance
- Performance Trend
- Straight line showing the overall performance direction — angled up = improving, angled down = declining
- Dashed Reference Line
- AI Opponent = AI analysis class-level par for the race
AI Model History Guide
What it shows: How our AI models rated this horse in each of its recent races, compared with how they rate today’s field (the dashed lines).
What to look for: Lines that are rising and sit above the dashed field averages — the models have liked this horse and still do. Falling lines, or lines below the dashed ones, mean the models are cooling on it.
- Lines
- Each solid line shows this horse’s model score over its last 10 races: blue = Mod1, green = Mod2, amber = Mod3.
- Dashed Lines
- Dashed lines represent the current race’s field average for each model — a score below the dashed line indicates the horse ranked below average in this model’s assessment.
- Higher is Stronger
- All three model scores are 0–100: a higher number means the model rates this horse more favorably among the field.
Mod1(W): 82 (1/8) Mod2(W): 75 (2/8) Mod3(W): 79 (3/8) Mod1-LS: 55 (6/8) Win Prob: 18.4% Value Score: 1.35 ★
Performance vs. Peers Guide
What it shows: Each horse’s career, last-3-race and last-race performance side by side, against the field average.
What to look for: Horses above the field average whose last race is green (better than their average) and whose trend line rises — improving form. Red last races and falling lines point to declining form.
- Bars (per post)
- Blue = avg career performance • Amber = avg last 3 races • Green = last race (improved vs. avg) • Red = last race (declined vs. avg)
- Trend Line
- Angled line above the bars: rising = improving form • falling = declining form.
- Horizontal Line
- Field average — the mean career performance of all horses in this race.
- Color Circles
- Standard post-position colors below each lane — same as the Total Pace chart.
- Border
- Thicker border = this horse’s post position.
Figure Comparison
What it shows: This horse’s ratings, speed figures and pace figures next to every other horse in the race.
What to look for: Where this horse (the darker column) leads the field or falls short. Strong ratings plus strong recent speed make a contender; recent speed well above career speed suggests improving form.
- Rating
- The three Pick Pony algorithm ratings (Algo 1, Algo 2, Algo 3) that make up the overall PP AI Rating — higher is a stronger contender rating.
- Speed
- Career average speed, recent 3-race average, and last-race speed figure — spot horses in improving or declining form.
- Pace
- Average Early (E1), Mid (E2), and Stretch (LP) pace figures — reveals pace-setters vs. closers vs. all-the-way types.
- This horse
- The horse whose stats card is open is highlighted with a darker column background.
Winning Profiles
What it shows: Each horse’s win rate and in-the-money rate over its last 10 starts, one dot per horse.
What to look for: Dots in the top-right are consistent winners. Top-left horses often finish in the money but rarely win — better for place and show bets or underneath in exotics. Bottom-left horses rarely finish well.
- Axes
- X: Win % from last 10 starts — Y: In-the-money % (top-3 finishes) from last 10 starts.
- Quadrants
- Consistent Winners (top-right): high win & ITM — reliable performers.
Place Threats (top-left): boards often but doesn’t win often — good exacta/trifecta angles.
Streaky (bottom-right): wins occasionally, misses the board often — all-or-nothing.
Developing (bottom-left): still finding form — longshot territory. - Reference Lines
- Dashed lines mark field averages. Dots to the right win more; dots higher board more.
- This horse
- Highlighted with a gold border and larger dot.
AI Model Comparison
What it shows: All AI model scores for every horse in the race, grouped by what each model is trained to find.
What to look for: The horse leading the green winner models is the models’ likely winner. A horse that stands out in the red longshot models but not the green ones is a longshot the models think is underrated.
- Winner Models (green)
- Mod1(W), Mod2(W), and Mod3(W) trained to predict race winners. Higher score = stronger contender.
- Longshot Models (red)
- Mod1-LS, Mod2-LS, and Mod3-LS trained to find high-value longshots. Higher score = stronger longshot candidate.
- Form Model (blue)
- Mod4 sequence model trained on recent form patterns. Higher score = stronger recent form profile.
- This horse
- Highlighted with a darker column background.
Race Pace Simulation Guide
What it shows: A simulated run of today’s race, based on each horse’s running style, post position and the expected pace.
What to look for: Who gets the lead, who gets boxed in, and who is gaining at the finish. Move the track-bias slider to see how the predicted order changes on a speed-favouring or closer-favouring track.
- Slider
- Drag left→right to advance from gate to finish. Drag all the way back to reset the race.
- Predicted Finish Order
- Factors in contested pace burn, each horse’s effort curve (peaked-early vs. peaked-late), and wide trip cost from outside posts. Updated live when Track Bias changes.
- Pace Scenario
- Lone Speed: single E horse likely rates and holds. Contested: two E horses burn each other — closers benefit. Hot Pace: speed meltdown, deep closers thrive. Soft: no early speed, moderate fractions throughout.
- Track Bias
- Slider below canvas. −2 = strong closer/wet bias; +2 = strong speed/rail bias. Recomputes the predicted finish order.
- Boxed Indicator
- Dashed orange ring = horse is surrounded (rival ahead, rival behind, wall outside). In a real race this horse must find a clear path to run.
- Running Styles
- E/EE = early speed (rushes to rail). P = presser (stalks the pace). S = stalker. SS = slow starter / closer.
| Stat | vs. Current Card | vs. All Horses |
|---|---|---|
| Averages
Career-average metrics across all AI race analysis. Performance and pace averages reflect estimated historical performance; trainer and jockey grades score in-the-money percentages. Grading scale: A = elite • B = above average • C = average • D = below average • F = poor • — = no data |
||
| Pick Pony AI Rating | A | B |
| Pace Trip Longshot | — | — |
| Connections Longshot | — | — |
| Situational Longshot | — | — |
| Speed | B | A |
| Early Pace | A | B |
| Mid Pace | A | A |
| Late Pace | C | A |
| Finish Pos | C | C |
| Dirt Speed | A | A |
| Turf Speed | B | A |
| Distance Speed | F | F |
| Trainer Effectiveness | B | A |
| Jockey Effectiveness | C | B |
| 3rd Party Ratings | B | A |
| Recent
Performance analysis from the horse's recent races, weighted to reflect current form. Sprint and Route FPS (Foot Per Second) measure pace efficiency over the horse's recent sprints and routes respectively. Grading scale: A = elite • B = above average • C = average • D = below average • F = poor • — = no data |
||
| Speed | A | A |
| Early Pace | C | B |
| Mid Pace | A | A |
| Late Pace | B | A |
| Sprint FPS | D | D |
| Route FPS | D | B |
| Trainer Effectiveness | B | A |
| Jockey Effectiveness | C | B |
| 3rd Party Ratings | B | A |
| Predictions
AI-generated projections for the upcoming race, derived from prior AI analysis for speed and pace trends, surface and distance suitability, and current conditions. Grading scale: A = elite • B = above average • C = average • D = below average • F = poor • — = no data |
||
| Speed | A | A |
| Early Pace | A | B |
| Mid Pace | A | A |
| Late Pace | C | C |
Chart Guide (2.0.41)
What it shows: This horse’s recent races, one bubble per race, plotted by its AI speed figure against the class par for today’s race (the dashed line).
What to look for: Recent bubbles at or above the dashed line, a trend line angled up, and a narrow shaded band (steady form). Check whether the good runs came on today’s surface and distance.
- Bubbles
- Color = surface: green (turf), brown (dirt), blue (synthetic)
- Top number = finishing position; bottom number in parentheses = starting post position
- Height above line = beaten lengths — closer means a smaller margin
- Border = track conditions: green (FST/GD/FM), yellow (WF/SL/YLD), red (SY/MY/FRZ/SFT/HVY)
- Connecting Line
- Solid = good conditions; dashed = bad conditions
- Line Symbol
- ▲ Triangle = sprint (7f or less); ● Circle = route (more than 7f)
- Days Between Races
- Small number above each bubble (e.g. 19d) = days since the previous race — helps spot freshness, layoffs, and tight scheduling.
- Shaded Band (Bollinger)
- Highlights volatility — a wider band means more variation in recent performance
- Performance Trend
- Straight line showing the overall performance direction — angled up = improving, angled down = declining
- Dashed Reference Line
- AI Opponent = AI analysis class-level par for the race
AI Model History Guide
What it shows: How our AI models rated this horse in each of its recent races, compared with how they rate today’s field (the dashed lines).
What to look for: Lines that are rising and sit above the dashed field averages — the models have liked this horse and still do. Falling lines, or lines below the dashed ones, mean the models are cooling on it.
- Lines
- Each solid line shows this horse’s model score over its last 10 races: blue = Mod1, green = Mod2, amber = Mod3.
- Dashed Lines
- Dashed lines represent the current race’s field average for each model — a score below the dashed line indicates the horse ranked below average in this model’s assessment.
- Higher is Stronger
- All three model scores are 0–100: a higher number means the model rates this horse more favorably among the field.
Mod1(W): 82 (1/8) Mod2(W): 75 (2/8) Mod3(W): 79 (3/8) Mod1-LS: 55 (6/8) Win Prob: 18.4% Value Score: 1.35 ★
Performance vs. Peers Guide
What it shows: Each horse’s career, last-3-race and last-race performance side by side, against the field average.
What to look for: Horses above the field average whose last race is green (better than their average) and whose trend line rises — improving form. Red last races and falling lines point to declining form.
- Bars (per post)
- Blue = avg career performance • Amber = avg last 3 races • Green = last race (improved vs. avg) • Red = last race (declined vs. avg)
- Trend Line
- Angled line above the bars: rising = improving form • falling = declining form.
- Horizontal Line
- Field average — the mean career performance of all horses in this race.
- Color Circles
- Standard post-position colors below each lane — same as the Total Pace chart.
- Border
- Thicker border = this horse’s post position.
Figure Comparison
What it shows: This horse’s ratings, speed figures and pace figures next to every other horse in the race.
What to look for: Where this horse (the darker column) leads the field or falls short. Strong ratings plus strong recent speed make a contender; recent speed well above career speed suggests improving form.
- Rating
- The three Pick Pony algorithm ratings (Algo 1, Algo 2, Algo 3) that make up the overall PP AI Rating — higher is a stronger contender rating.
- Speed
- Career average speed, recent 3-race average, and last-race speed figure — spot horses in improving or declining form.
- Pace
- Average Early (E1), Mid (E2), and Stretch (LP) pace figures — reveals pace-setters vs. closers vs. all-the-way types.
- This horse
- The horse whose stats card is open is highlighted with a darker column background.
Winning Profiles
What it shows: Each horse’s win rate and in-the-money rate over its last 10 starts, one dot per horse.
What to look for: Dots in the top-right are consistent winners. Top-left horses often finish in the money but rarely win — better for place and show bets or underneath in exotics. Bottom-left horses rarely finish well.
- Axes
- X: Win % from last 10 starts — Y: In-the-money % (top-3 finishes) from last 10 starts.
- Quadrants
- Consistent Winners (top-right): high win & ITM — reliable performers.
Place Threats (top-left): boards often but doesn’t win often — good exacta/trifecta angles.
Streaky (bottom-right): wins occasionally, misses the board often — all-or-nothing.
Developing (bottom-left): still finding form — longshot territory. - Reference Lines
- Dashed lines mark field averages. Dots to the right win more; dots higher board more.
- This horse
- Highlighted with a gold border and larger dot.
AI Model Comparison
What it shows: All AI model scores for every horse in the race, grouped by what each model is trained to find.
What to look for: The horse leading the green winner models is the models’ likely winner. A horse that stands out in the red longshot models but not the green ones is a longshot the models think is underrated.
- Winner Models (green)
- Mod1(W), Mod2(W), and Mod3(W) trained to predict race winners. Higher score = stronger contender.
- Longshot Models (red)
- Mod1-LS, Mod2-LS, and Mod3-LS trained to find high-value longshots. Higher score = stronger longshot candidate.
- Form Model (blue)
- Mod4 sequence model trained on recent form patterns. Higher score = stronger recent form profile.
- This horse
- Highlighted with a darker column background.
Race Pace Simulation Guide
What it shows: A simulated run of today’s race, based on each horse’s running style, post position and the expected pace.
What to look for: Who gets the lead, who gets boxed in, and who is gaining at the finish. Move the track-bias slider to see how the predicted order changes on a speed-favouring or closer-favouring track.
- Slider
- Drag left→right to advance from gate to finish. Drag all the way back to reset the race.
- Predicted Finish Order
- Factors in contested pace burn, each horse’s effort curve (peaked-early vs. peaked-late), and wide trip cost from outside posts. Updated live when Track Bias changes.
- Pace Scenario
- Lone Speed: single E horse likely rates and holds. Contested: two E horses burn each other — closers benefit. Hot Pace: speed meltdown, deep closers thrive. Soft: no early speed, moderate fractions throughout.
- Track Bias
- Slider below canvas. −2 = strong closer/wet bias; +2 = strong speed/rail bias. Recomputes the predicted finish order.
- Boxed Indicator
- Dashed orange ring = horse is surrounded (rival ahead, rival behind, wall outside). In a real race this horse must find a clear path to run.
- Running Styles
- E/EE = early speed (rushes to rail). P = presser (stalks the pace). S = stalker. SS = slow starter / closer.
| Stat | vs. Current Card | vs. All Horses |
|---|---|---|
| Averages
Career-average metrics across all AI race analysis. Performance and pace averages reflect estimated historical performance; trainer and jockey grades score in-the-money percentages. Grading scale: A = elite • B = above average • C = average • D = below average • F = poor • — = no data |
||
| Pick Pony AI Rating | A | C |
| Pace Trip Longshot | — | — |
| Connections Longshot | — | — |
| Situational Longshot | — | — |
| Speed | A | A |
| Early Pace | B | B |
| Mid Pace | B | A |
| Late Pace | A | A |
| Finish Pos | D | A |
| Dirt Speed | A | B |
| Turf Speed | C | D |
| Distance Speed | C | F |
| Trainer Effectiveness | A | A |
| Jockey Effectiveness | A | A |
| 3rd Party Ratings | A | A |
| Recent
Performance analysis from the horse's recent races, weighted to reflect current form. Sprint and Route FPS (Foot Per Second) measure pace efficiency over the horse's recent sprints and routes respectively. Grading scale: A = elite • B = above average • C = average • D = below average • F = poor • — = no data |
||
| Speed | A | A |
| Early Pace | B | B |
| Mid Pace | B | A |
| Late Pace | A | A |
| Sprint FPS | B | A |
| Route FPS | B | C |
| Trainer Effectiveness | A | A |
| Jockey Effectiveness | A | A |
| 3rd Party Ratings | A | A |
| Predictions
AI-generated projections for the upcoming race, derived from prior AI analysis for speed and pace trends, surface and distance suitability, and current conditions. Grading scale: A = elite • B = above average • C = average • D = below average • F = poor • — = no data |
||
| Speed | B | A |
| Early Pace | D | F |
| Mid Pace | D | F |
| Late Pace | C | C |
Chart Guide (2.0.41)
What it shows: This horse’s recent races, one bubble per race, plotted by its AI speed figure against the class par for today’s race (the dashed line).
What to look for: Recent bubbles at or above the dashed line, a trend line angled up, and a narrow shaded band (steady form). Check whether the good runs came on today’s surface and distance.
- Bubbles
- Color = surface: green (turf), brown (dirt), blue (synthetic)
- Top number = finishing position; bottom number in parentheses = starting post position
- Height above line = beaten lengths — closer means a smaller margin
- Border = track conditions: green (FST/GD/FM), yellow (WF/SL/YLD), red (SY/MY/FRZ/SFT/HVY)
- Connecting Line
- Solid = good conditions; dashed = bad conditions
- Line Symbol
- ▲ Triangle = sprint (7f or less); ● Circle = route (more than 7f)
- Days Between Races
- Small number above each bubble (e.g. 19d) = days since the previous race — helps spot freshness, layoffs, and tight scheduling.
- Shaded Band (Bollinger)
- Highlights volatility — a wider band means more variation in recent performance
- Performance Trend
- Straight line showing the overall performance direction — angled up = improving, angled down = declining
- Dashed Reference Line
- AI Opponent = AI analysis class-level par for the race
AI Model History Guide
What it shows: How our AI models rated this horse in each of its recent races, compared with how they rate today’s field (the dashed lines).
What to look for: Lines that are rising and sit above the dashed field averages — the models have liked this horse and still do. Falling lines, or lines below the dashed ones, mean the models are cooling on it.
- Lines
- Each solid line shows this horse’s model score over its last 10 races: blue = Mod1, green = Mod2, amber = Mod3.
- Dashed Lines
- Dashed lines represent the current race’s field average for each model — a score below the dashed line indicates the horse ranked below average in this model’s assessment.
- Higher is Stronger
- All three model scores are 0–100: a higher number means the model rates this horse more favorably among the field.
Mod1(W): 82 (1/8) Mod2(W): 75 (2/8) Mod3(W): 79 (3/8) Mod1-LS: 55 (6/8) Win Prob: 18.4% Value Score: 1.35 ★
Performance vs. Peers Guide
What it shows: Each horse’s career, last-3-race and last-race performance side by side, against the field average.
What to look for: Horses above the field average whose last race is green (better than their average) and whose trend line rises — improving form. Red last races and falling lines point to declining form.
- Bars (per post)
- Blue = avg career performance • Amber = avg last 3 races • Green = last race (improved vs. avg) • Red = last race (declined vs. avg)
- Trend Line
- Angled line above the bars: rising = improving form • falling = declining form.
- Horizontal Line
- Field average — the mean career performance of all horses in this race.
- Color Circles
- Standard post-position colors below each lane — same as the Total Pace chart.
- Border
- Thicker border = this horse’s post position.
Figure Comparison
What it shows: This horse’s ratings, speed figures and pace figures next to every other horse in the race.
What to look for: Where this horse (the darker column) leads the field or falls short. Strong ratings plus strong recent speed make a contender; recent speed well above career speed suggests improving form.
- Rating
- The three Pick Pony algorithm ratings (Algo 1, Algo 2, Algo 3) that make up the overall PP AI Rating — higher is a stronger contender rating.
- Speed
- Career average speed, recent 3-race average, and last-race speed figure — spot horses in improving or declining form.
- Pace
- Average Early (E1), Mid (E2), and Stretch (LP) pace figures — reveals pace-setters vs. closers vs. all-the-way types.
- This horse
- The horse whose stats card is open is highlighted with a darker column background.
Winning Profiles
What it shows: Each horse’s win rate and in-the-money rate over its last 10 starts, one dot per horse.
What to look for: Dots in the top-right are consistent winners. Top-left horses often finish in the money but rarely win — better for place and show bets or underneath in exotics. Bottom-left horses rarely finish well.
- Axes
- X: Win % from last 10 starts — Y: In-the-money % (top-3 finishes) from last 10 starts.
- Quadrants
- Consistent Winners (top-right): high win & ITM — reliable performers.
Place Threats (top-left): boards often but doesn’t win often — good exacta/trifecta angles.
Streaky (bottom-right): wins occasionally, misses the board often — all-or-nothing.
Developing (bottom-left): still finding form — longshot territory. - Reference Lines
- Dashed lines mark field averages. Dots to the right win more; dots higher board more.
- This horse
- Highlighted with a gold border and larger dot.
AI Model Comparison
What it shows: All AI model scores for every horse in the race, grouped by what each model is trained to find.
What to look for: The horse leading the green winner models is the models’ likely winner. A horse that stands out in the red longshot models but not the green ones is a longshot the models think is underrated.
- Winner Models (green)
- Mod1(W), Mod2(W), and Mod3(W) trained to predict race winners. Higher score = stronger contender.
- Longshot Models (red)
- Mod1-LS, Mod2-LS, and Mod3-LS trained to find high-value longshots. Higher score = stronger longshot candidate.
- Form Model (blue)
- Mod4 sequence model trained on recent form patterns. Higher score = stronger recent form profile.
- This horse
- Highlighted with a darker column background.
Race Pace Simulation Guide
What it shows: A simulated run of today’s race, based on each horse’s running style, post position and the expected pace.
What to look for: Who gets the lead, who gets boxed in, and who is gaining at the finish. Move the track-bias slider to see how the predicted order changes on a speed-favouring or closer-favouring track.
- Slider
- Drag left→right to advance from gate to finish. Drag all the way back to reset the race.
- Predicted Finish Order
- Factors in contested pace burn, each horse’s effort curve (peaked-early vs. peaked-late), and wide trip cost from outside posts. Updated live when Track Bias changes.
- Pace Scenario
- Lone Speed: single E horse likely rates and holds. Contested: two E horses burn each other — closers benefit. Hot Pace: speed meltdown, deep closers thrive. Soft: no early speed, moderate fractions throughout.
- Track Bias
- Slider below canvas. −2 = strong closer/wet bias; +2 = strong speed/rail bias. Recomputes the predicted finish order.
- Boxed Indicator
- Dashed orange ring = horse is surrounded (rival ahead, rival behind, wall outside). In a real race this horse must find a clear path to run.
- Running Styles
- E/EE = early speed (rushes to rail). P = presser (stalks the pace). S = stalker. SS = slow starter / closer.
| Stat | vs. Current Card | vs. All Horses |
|---|---|---|
| Averages
Career-average metrics across all AI race analysis. Performance and pace averages reflect estimated historical performance; trainer and jockey grades score in-the-money percentages. Grading scale: A = elite • B = above average • C = average • D = below average • F = poor • — = no data |
||
| Pick Pony AI Rating | B | C |
| Pace Trip Longshot | — | — |
| Connections Longshot | — | — |
| Situational Longshot | — | — |
| Speed | C | B |
| Early Pace | A | A |
| Mid Pace | A | A |
| Late Pace | D | C |
| Finish Pos | D | A |
| Dirt Speed | C | C |
| Turf Speed | C | D |
| Distance Speed | C | F |
| Trainer Effectiveness | C | B |
| Jockey Effectiveness | C | C |
| 3rd Party Ratings | B | A |
| Recent
Performance analysis from the horse's recent races, weighted to reflect current form. Sprint and Route FPS (Foot Per Second) measure pace efficiency over the horse's recent sprints and routes respectively. Grading scale: A = elite • B = above average • C = average • D = below average • F = poor • — = no data |
||
| Speed | C | B |
| Early Pace | A | A |
| Mid Pace | A | A |
| Late Pace | D | C |
| Sprint FPS | A | A |
| Route FPS | A | A |
| Trainer Effectiveness | C | B |
| Jockey Effectiveness | C | C |
| 3rd Party Ratings | B | A |
| Predictions
AI-generated projections for the upcoming race, derived from prior AI analysis for speed and pace trends, surface and distance suitability, and current conditions. Grading scale: A = elite • B = above average • C = average • D = below average • F = poor • — = no data |
||
| Speed | C | B |
| Early Pace | D | F |
| Mid Pace | D | F |
| Late Pace | C | C |
Chart Guide (2.0.41)
What it shows: This horse’s recent races, one bubble per race, plotted by its AI speed figure against the class par for today’s race (the dashed line).
What to look for: Recent bubbles at or above the dashed line, a trend line angled up, and a narrow shaded band (steady form). Check whether the good runs came on today’s surface and distance.
- Bubbles
- Color = surface: green (turf), brown (dirt), blue (synthetic)
- Top number = finishing position; bottom number in parentheses = starting post position
- Height above line = beaten lengths — closer means a smaller margin
- Border = track conditions: green (FST/GD/FM), yellow (WF/SL/YLD), red (SY/MY/FRZ/SFT/HVY)
- Connecting Line
- Solid = good conditions; dashed = bad conditions
- Line Symbol
- ▲ Triangle = sprint (7f or less); ● Circle = route (more than 7f)
- Days Between Races
- Small number above each bubble (e.g. 19d) = days since the previous race — helps spot freshness, layoffs, and tight scheduling.
- Shaded Band (Bollinger)
- Highlights volatility — a wider band means more variation in recent performance
- Performance Trend
- Straight line showing the overall performance direction — angled up = improving, angled down = declining
- Dashed Reference Line
- AI Opponent = AI analysis class-level par for the race
AI Model History Guide
What it shows: How our AI models rated this horse in each of its recent races, compared with how they rate today’s field (the dashed lines).
What to look for: Lines that are rising and sit above the dashed field averages — the models have liked this horse and still do. Falling lines, or lines below the dashed ones, mean the models are cooling on it.
- Lines
- Each solid line shows this horse’s model score over its last 10 races: blue = Mod1, green = Mod2, amber = Mod3.
- Dashed Lines
- Dashed lines represent the current race’s field average for each model — a score below the dashed line indicates the horse ranked below average in this model’s assessment.
- Higher is Stronger
- All three model scores are 0–100: a higher number means the model rates this horse more favorably among the field.
Mod1(W): 82 (1/8) Mod2(W): 75 (2/8) Mod3(W): 79 (3/8) Mod1-LS: 55 (6/8) Win Prob: 18.4% Value Score: 1.35 ★
Performance vs. Peers Guide
What it shows: Each horse’s career, last-3-race and last-race performance side by side, against the field average.
What to look for: Horses above the field average whose last race is green (better than their average) and whose trend line rises — improving form. Red last races and falling lines point to declining form.
- Bars (per post)
- Blue = avg career performance • Amber = avg last 3 races • Green = last race (improved vs. avg) • Red = last race (declined vs. avg)
- Trend Line
- Angled line above the bars: rising = improving form • falling = declining form.
- Horizontal Line
- Field average — the mean career performance of all horses in this race.
- Color Circles
- Standard post-position colors below each lane — same as the Total Pace chart.
- Border
- Thicker border = this horse’s post position.
Figure Comparison
What it shows: This horse’s ratings, speed figures and pace figures next to every other horse in the race.
What to look for: Where this horse (the darker column) leads the field or falls short. Strong ratings plus strong recent speed make a contender; recent speed well above career speed suggests improving form.
- Rating
- The three Pick Pony algorithm ratings (Algo 1, Algo 2, Algo 3) that make up the overall PP AI Rating — higher is a stronger contender rating.
- Speed
- Career average speed, recent 3-race average, and last-race speed figure — spot horses in improving or declining form.
- Pace
- Average Early (E1), Mid (E2), and Stretch (LP) pace figures — reveals pace-setters vs. closers vs. all-the-way types.
- This horse
- The horse whose stats card is open is highlighted with a darker column background.
Winning Profiles
What it shows: Each horse’s win rate and in-the-money rate over its last 10 starts, one dot per horse.
What to look for: Dots in the top-right are consistent winners. Top-left horses often finish in the money but rarely win — better for place and show bets or underneath in exotics. Bottom-left horses rarely finish well.
- Axes
- X: Win % from last 10 starts — Y: In-the-money % (top-3 finishes) from last 10 starts.
- Quadrants
- Consistent Winners (top-right): high win & ITM — reliable performers.
Place Threats (top-left): boards often but doesn’t win often — good exacta/trifecta angles.
Streaky (bottom-right): wins occasionally, misses the board often — all-or-nothing.
Developing (bottom-left): still finding form — longshot territory. - Reference Lines
- Dashed lines mark field averages. Dots to the right win more; dots higher board more.
- This horse
- Highlighted with a gold border and larger dot.
AI Model Comparison
What it shows: All AI model scores for every horse in the race, grouped by what each model is trained to find.
What to look for: The horse leading the green winner models is the models’ likely winner. A horse that stands out in the red longshot models but not the green ones is a longshot the models think is underrated.
- Winner Models (green)
- Mod1(W), Mod2(W), and Mod3(W) trained to predict race winners. Higher score = stronger contender.
- Longshot Models (red)
- Mod1-LS, Mod2-LS, and Mod3-LS trained to find high-value longshots. Higher score = stronger longshot candidate.
- Form Model (blue)
- Mod4 sequence model trained on recent form patterns. Higher score = stronger recent form profile.
- This horse
- Highlighted with a darker column background.
Race Pace Simulation Guide
What it shows: A simulated run of today’s race, based on each horse’s running style, post position and the expected pace.
What to look for: Who gets the lead, who gets boxed in, and who is gaining at the finish. Move the track-bias slider to see how the predicted order changes on a speed-favouring or closer-favouring track.
- Slider
- Drag left→right to advance from gate to finish. Drag all the way back to reset the race.
- Predicted Finish Order
- Factors in contested pace burn, each horse’s effort curve (peaked-early vs. peaked-late), and wide trip cost from outside posts. Updated live when Track Bias changes.
- Pace Scenario
- Lone Speed: single E horse likely rates and holds. Contested: two E horses burn each other — closers benefit. Hot Pace: speed meltdown, deep closers thrive. Soft: no early speed, moderate fractions throughout.
- Track Bias
- Slider below canvas. −2 = strong closer/wet bias; +2 = strong speed/rail bias. Recomputes the predicted finish order.
- Boxed Indicator
- Dashed orange ring = horse is surrounded (rival ahead, rival behind, wall outside). In a real race this horse must find a clear path to run.
- Running Styles
- E/EE = early speed (rushes to rail). P = presser (stalks the pace). S = stalker. SS = slow starter / closer.
| Stat | vs. Current Card | vs. All Horses |
|---|---|---|
| Averages
Career-average metrics across all AI race analysis. Performance and pace averages reflect estimated historical performance; trainer and jockey grades score in-the-money percentages. Grading scale: A = elite • B = above average • C = average • D = below average • F = poor • — = no data |
||
| Pick Pony AI Rating | A | B |
| Pace Trip Longshot | — | — |
| Connections Longshot | — | — |
| Situational Longshot | — | — |
| Speed | A | B |
| Early Pace | A | A |
| Mid Pace | A | A |
| Late Pace | C | B |
| Finish Pos | B | A |
| Dirt Speed | C | B |
| Turf Speed | C | D |
| Distance Speed | C | F |
| Trainer Effectiveness | B | A |
| Jockey Effectiveness | A | B |
| 3rd Party Ratings | A | A |
| Recent
Performance analysis from the horse's recent races, weighted to reflect current form. Sprint and Route FPS (Foot Per Second) measure pace efficiency over the horse's recent sprints and routes respectively. Grading scale: A = elite • B = above average • C = average • D = below average • F = poor • — = no data |
||
| Speed | A | B |
| Early Pace | A | A |
| Mid Pace | A | A |
| Late Pace | C | C |
| Sprint FPS | A | A |
| Route FPS | A | A |
| Trainer Effectiveness | B | A |
| Jockey Effectiveness | A | B |
| 3rd Party Ratings | A | A |
| Predictions
AI-generated projections for the upcoming race, derived from prior AI analysis for speed and pace trends, surface and distance suitability, and current conditions. Grading scale: A = elite • B = above average • C = average • D = below average • F = poor • — = no data |
||
| Speed | A | A |
| Early Pace | A | A |
| Mid Pace | A | A |
| Late Pace | C | C |
Chart Guide (2.0.41)
What it shows: This horse’s recent races, one bubble per race, plotted by its AI speed figure against the class par for today’s race (the dashed line).
What to look for: Recent bubbles at or above the dashed line, a trend line angled up, and a narrow shaded band (steady form). Check whether the good runs came on today’s surface and distance.
- Bubbles
- Color = surface: green (turf), brown (dirt), blue (synthetic)
- Top number = finishing position; bottom number in parentheses = starting post position
- Height above line = beaten lengths — closer means a smaller margin
- Border = track conditions: green (FST/GD/FM), yellow (WF/SL/YLD), red (SY/MY/FRZ/SFT/HVY)
- Connecting Line
- Solid = good conditions; dashed = bad conditions
- Line Symbol
- ▲ Triangle = sprint (7f or less); ● Circle = route (more than 7f)
- Days Between Races
- Small number above each bubble (e.g. 19d) = days since the previous race — helps spot freshness, layoffs, and tight scheduling.
- Shaded Band (Bollinger)
- Highlights volatility — a wider band means more variation in recent performance
- Performance Trend
- Straight line showing the overall performance direction — angled up = improving, angled down = declining
- Dashed Reference Line
- AI Opponent = AI analysis class-level par for the race
AI Model History Guide
What it shows: How our AI models rated this horse in each of its recent races, compared with how they rate today’s field (the dashed lines).
What to look for: Lines that are rising and sit above the dashed field averages — the models have liked this horse and still do. Falling lines, or lines below the dashed ones, mean the models are cooling on it.
- Lines
- Each solid line shows this horse’s model score over its last 10 races: blue = Mod1, green = Mod2, amber = Mod3.
- Dashed Lines
- Dashed lines represent the current race’s field average for each model — a score below the dashed line indicates the horse ranked below average in this model’s assessment.
- Higher is Stronger
- All three model scores are 0–100: a higher number means the model rates this horse more favorably among the field.
Mod1(W): 82 (1/8) Mod2(W): 75 (2/8) Mod3(W): 79 (3/8) Mod1-LS: 55 (6/8) Win Prob: 18.4% Value Score: 1.35 ★
Performance vs. Peers Guide
What it shows: Each horse’s career, last-3-race and last-race performance side by side, against the field average.
What to look for: Horses above the field average whose last race is green (better than their average) and whose trend line rises — improving form. Red last races and falling lines point to declining form.
- Bars (per post)
- Blue = avg career performance • Amber = avg last 3 races • Green = last race (improved vs. avg) • Red = last race (declined vs. avg)
- Trend Line
- Angled line above the bars: rising = improving form • falling = declining form.
- Horizontal Line
- Field average — the mean career performance of all horses in this race.
- Color Circles
- Standard post-position colors below each lane — same as the Total Pace chart.
- Border
- Thicker border = this horse’s post position.
Figure Comparison
What it shows: This horse’s ratings, speed figures and pace figures next to every other horse in the race.
What to look for: Where this horse (the darker column) leads the field or falls short. Strong ratings plus strong recent speed make a contender; recent speed well above career speed suggests improving form.
- Rating
- The three Pick Pony algorithm ratings (Algo 1, Algo 2, Algo 3) that make up the overall PP AI Rating — higher is a stronger contender rating.
- Speed
- Career average speed, recent 3-race average, and last-race speed figure — spot horses in improving or declining form.
- Pace
- Average Early (E1), Mid (E2), and Stretch (LP) pace figures — reveals pace-setters vs. closers vs. all-the-way types.
- This horse
- The horse whose stats card is open is highlighted with a darker column background.
Winning Profiles
What it shows: Each horse’s win rate and in-the-money rate over its last 10 starts, one dot per horse.
What to look for: Dots in the top-right are consistent winners. Top-left horses often finish in the money but rarely win — better for place and show bets or underneath in exotics. Bottom-left horses rarely finish well.
- Axes
- X: Win % from last 10 starts — Y: In-the-money % (top-3 finishes) from last 10 starts.
- Quadrants
- Consistent Winners (top-right): high win & ITM — reliable performers.
Place Threats (top-left): boards often but doesn’t win often — good exacta/trifecta angles.
Streaky (bottom-right): wins occasionally, misses the board often — all-or-nothing.
Developing (bottom-left): still finding form — longshot territory. - Reference Lines
- Dashed lines mark field averages. Dots to the right win more; dots higher board more.
- This horse
- Highlighted with a gold border and larger dot.
AI Model Comparison
What it shows: All AI model scores for every horse in the race, grouped by what each model is trained to find.
What to look for: The horse leading the green winner models is the models’ likely winner. A horse that stands out in the red longshot models but not the green ones is a longshot the models think is underrated.
- Winner Models (green)
- Mod1(W), Mod2(W), and Mod3(W) trained to predict race winners. Higher score = stronger contender.
- Longshot Models (red)
- Mod1-LS, Mod2-LS, and Mod3-LS trained to find high-value longshots. Higher score = stronger longshot candidate.
- Form Model (blue)
- Mod4 sequence model trained on recent form patterns. Higher score = stronger recent form profile.
- This horse
- Highlighted with a darker column background.
Race Pace Simulation Guide
What it shows: A simulated run of today’s race, based on each horse’s running style, post position and the expected pace.
What to look for: Who gets the lead, who gets boxed in, and who is gaining at the finish. Move the track-bias slider to see how the predicted order changes on a speed-favouring or closer-favouring track.
- Slider
- Drag left→right to advance from gate to finish. Drag all the way back to reset the race.
- Predicted Finish Order
- Factors in contested pace burn, each horse’s effort curve (peaked-early vs. peaked-late), and wide trip cost from outside posts. Updated live when Track Bias changes.
- Pace Scenario
- Lone Speed: single E horse likely rates and holds. Contested: two E horses burn each other — closers benefit. Hot Pace: speed meltdown, deep closers thrive. Soft: no early speed, moderate fractions throughout.
- Track Bias
- Slider below canvas. −2 = strong closer/wet bias; +2 = strong speed/rail bias. Recomputes the predicted finish order.
- Boxed Indicator
- Dashed orange ring = horse is surrounded (rival ahead, rival behind, wall outside). In a real race this horse must find a clear path to run.
- Running Styles
- E/EE = early speed (rushes to rail). P = presser (stalks the pace). S = stalker. SS = slow starter / closer.
| Stat | vs. Current Card | vs. All Horses |
|---|---|---|
| Averages
Career-average metrics across all AI race analysis. Performance and pace averages reflect estimated historical performance; trainer and jockey grades score in-the-money percentages. Grading scale: A = elite • B = above average • C = average • D = below average • F = poor • — = no data |
||
| Pick Pony AI Rating | C | C |
| Pace Trip Longshot | — | — |
| Connections Longshot | — | — |
| Situational Longshot | — | — |
| Speed | B | B |
| Early Pace | C | C |
| Mid Pace | C | C |
| Late Pace | A | A |
| Finish Pos | B | A |
| Dirt Speed | A | B |
| Turf Speed | C | D |
| Distance Speed | C | F |
| Trainer Effectiveness | F | D |
| Jockey Effectiveness | F | D |
| 3rd Party Ratings | C | B |
| Recent
Performance analysis from the horse's recent races, weighted to reflect current form. Sprint and Route FPS (Foot Per Second) measure pace efficiency over the horse's recent sprints and routes respectively. Grading scale: A = elite • B = above average • C = average • D = below average • F = poor • — = no data |
||
| Speed | B | B |
| Early Pace | C | C |
| Mid Pace | C | C |
| Late Pace | A | A |
| Sprint FPS | C | D |
| Route FPS | C | C |
| Trainer Effectiveness | F | D |
| Jockey Effectiveness | F | D |
| 3rd Party Ratings | C | B |
| Predictions
AI-generated projections for the upcoming race, derived from prior AI analysis for speed and pace trends, surface and distance suitability, and current conditions. Grading scale: A = elite • B = above average • C = average • D = below average • F = poor • — = no data |
||
| Speed | A | A |
| Early Pace | B | C |
| Mid Pace | B | C |
| Late Pace | C | C |
Chart Guide (2.0.41)
What it shows: This horse’s recent races, one bubble per race, plotted by its AI speed figure against the class par for today’s race (the dashed line).
What to look for: Recent bubbles at or above the dashed line, a trend line angled up, and a narrow shaded band (steady form). Check whether the good runs came on today’s surface and distance.
- Bubbles
- Color = surface: green (turf), brown (dirt), blue (synthetic)
- Top number = finishing position; bottom number in parentheses = starting post position
- Height above line = beaten lengths — closer means a smaller margin
- Border = track conditions: green (FST/GD/FM), yellow (WF/SL/YLD), red (SY/MY/FRZ/SFT/HVY)
- Connecting Line
- Solid = good conditions; dashed = bad conditions
- Line Symbol
- ▲ Triangle = sprint (7f or less); ● Circle = route (more than 7f)
- Days Between Races
- Small number above each bubble (e.g. 19d) = days since the previous race — helps spot freshness, layoffs, and tight scheduling.
- Shaded Band (Bollinger)
- Highlights volatility — a wider band means more variation in recent performance
- Performance Trend
- Straight line showing the overall performance direction — angled up = improving, angled down = declining
- Dashed Reference Line
- AI Opponent = AI analysis class-level par for the race
AI Model History Guide
What it shows: How our AI models rated this horse in each of its recent races, compared with how they rate today’s field (the dashed lines).
What to look for: Lines that are rising and sit above the dashed field averages — the models have liked this horse and still do. Falling lines, or lines below the dashed ones, mean the models are cooling on it.
- Lines
- Each solid line shows this horse’s model score over its last 10 races: blue = Mod1, green = Mod2, amber = Mod3.
- Dashed Lines
- Dashed lines represent the current race’s field average for each model — a score below the dashed line indicates the horse ranked below average in this model’s assessment.
- Higher is Stronger
- All three model scores are 0–100: a higher number means the model rates this horse more favorably among the field.
Mod1(W): 82 (1/8) Mod2(W): 75 (2/8) Mod3(W): 79 (3/8) Mod1-LS: 55 (6/8) Win Prob: 18.4% Value Score: 1.35 ★
Performance vs. Peers Guide
What it shows: Each horse’s career, last-3-race and last-race performance side by side, against the field average.
What to look for: Horses above the field average whose last race is green (better than their average) and whose trend line rises — improving form. Red last races and falling lines point to declining form.
- Bars (per post)
- Blue = avg career performance • Amber = avg last 3 races • Green = last race (improved vs. avg) • Red = last race (declined vs. avg)
- Trend Line
- Angled line above the bars: rising = improving form • falling = declining form.
- Horizontal Line
- Field average — the mean career performance of all horses in this race.
- Color Circles
- Standard post-position colors below each lane — same as the Total Pace chart.
- Border
- Thicker border = this horse’s post position.
Figure Comparison
What it shows: This horse’s ratings, speed figures and pace figures next to every other horse in the race.
What to look for: Where this horse (the darker column) leads the field or falls short. Strong ratings plus strong recent speed make a contender; recent speed well above career speed suggests improving form.
- Rating
- The three Pick Pony algorithm ratings (Algo 1, Algo 2, Algo 3) that make up the overall PP AI Rating — higher is a stronger contender rating.
- Speed
- Career average speed, recent 3-race average, and last-race speed figure — spot horses in improving or declining form.
- Pace
- Average Early (E1), Mid (E2), and Stretch (LP) pace figures — reveals pace-setters vs. closers vs. all-the-way types.
- This horse
- The horse whose stats card is open is highlighted with a darker column background.
Winning Profiles
What it shows: Each horse’s win rate and in-the-money rate over its last 10 starts, one dot per horse.
What to look for: Dots in the top-right are consistent winners. Top-left horses often finish in the money but rarely win — better for place and show bets or underneath in exotics. Bottom-left horses rarely finish well.
- Axes
- X: Win % from last 10 starts — Y: In-the-money % (top-3 finishes) from last 10 starts.
- Quadrants
- Consistent Winners (top-right): high win & ITM — reliable performers.
Place Threats (top-left): boards often but doesn’t win often — good exacta/trifecta angles.
Streaky (bottom-right): wins occasionally, misses the board often — all-or-nothing.
Developing (bottom-left): still finding form — longshot territory. - Reference Lines
- Dashed lines mark field averages. Dots to the right win more; dots higher board more.
- This horse
- Highlighted with a gold border and larger dot.
AI Model Comparison
What it shows: All AI model scores for every horse in the race, grouped by what each model is trained to find.
What to look for: The horse leading the green winner models is the models’ likely winner. A horse that stands out in the red longshot models but not the green ones is a longshot the models think is underrated.
- Winner Models (green)
- Mod1(W), Mod2(W), and Mod3(W) trained to predict race winners. Higher score = stronger contender.
- Longshot Models (red)
- Mod1-LS, Mod2-LS, and Mod3-LS trained to find high-value longshots. Higher score = stronger longshot candidate.
- Form Model (blue)
- Mod4 sequence model trained on recent form patterns. Higher score = stronger recent form profile.
- This horse
- Highlighted with a darker column background.
Race Pace Simulation Guide
What it shows: A simulated run of today’s race, based on each horse’s running style, post position and the expected pace.
What to look for: Who gets the lead, who gets boxed in, and who is gaining at the finish. Move the track-bias slider to see how the predicted order changes on a speed-favouring or closer-favouring track.
- Slider
- Drag left→right to advance from gate to finish. Drag all the way back to reset the race.
- Predicted Finish Order
- Factors in contested pace burn, each horse’s effort curve (peaked-early vs. peaked-late), and wide trip cost from outside posts. Updated live when Track Bias changes.
- Pace Scenario
- Lone Speed: single E horse likely rates and holds. Contested: two E horses burn each other — closers benefit. Hot Pace: speed meltdown, deep closers thrive. Soft: no early speed, moderate fractions throughout.
- Track Bias
- Slider below canvas. −2 = strong closer/wet bias; +2 = strong speed/rail bias. Recomputes the predicted finish order.
- Boxed Indicator
- Dashed orange ring = horse is surrounded (rival ahead, rival behind, wall outside). In a real race this horse must find a clear path to run.
- Running Styles
- E/EE = early speed (rushes to rail). P = presser (stalks the pace). S = stalker. SS = slow starter / closer.
| Stat | vs. Current Card | vs. All Horses |
|---|---|---|
| Averages
Career-average metrics across all AI race analysis. Performance and pace averages reflect estimated historical performance; trainer and jockey grades score in-the-money percentages. Grading scale: A = elite • B = above average • C = average • D = below average • F = poor • — = no data |
||
| Pick Pony AI Rating | C | C |
| Pace Trip Longshot | — | — |
| Connections Longshot | — | — |
| Situational Longshot | — | — |
| Speed | B | B |
| Early Pace | D | D |
| Mid Pace | D | D |
| Late Pace | C | A |
| Finish Pos | F | F |
| Dirt Speed | D | F |
| Turf Speed | A | A |
| Distance Speed | A | A |
| Trainer Effectiveness | F | F |
| Jockey Effectiveness | F | F |
| 3rd Party Ratings | C | B |
| Recent
Performance analysis from the horse's recent races, weighted to reflect current form. Sprint and Route FPS (Foot Per Second) measure pace efficiency over the horse's recent sprints and routes respectively. Grading scale: A = elite • B = above average • C = average • D = below average • F = poor • — = no data |
||
| Speed | B | B |
| Early Pace | F | D |
| Mid Pace | F | D |
| Late Pace | B | B |
| Sprint FPS | C | D |
| Route FPS | C | C |
| Trainer Effectiveness | F | F |
| Jockey Effectiveness | F | F |
| 3rd Party Ratings | C | B |
| Predictions
AI-generated projections for the upcoming race, derived from prior AI analysis for speed and pace trends, surface and distance suitability, and current conditions. Grading scale: A = elite • B = above average • C = average • D = below average • F = poor • — = no data |
||
| Speed | B | B |
| Early Pace | D | D |
| Mid Pace | C | C |
| Late Pace | C | C |
Chart Guide (2.0.41)
What it shows: This horse’s recent races, one bubble per race, plotted by its AI speed figure against the class par for today’s race (the dashed line).
What to look for: Recent bubbles at or above the dashed line, a trend line angled up, and a narrow shaded band (steady form). Check whether the good runs came on today’s surface and distance.
- Bubbles
- Color = surface: green (turf), brown (dirt), blue (synthetic)
- Top number = finishing position; bottom number in parentheses = starting post position
- Height above line = beaten lengths — closer means a smaller margin
- Border = track conditions: green (FST/GD/FM), yellow (WF/SL/YLD), red (SY/MY/FRZ/SFT/HVY)
- Connecting Line
- Solid = good conditions; dashed = bad conditions
- Line Symbol
- ▲ Triangle = sprint (7f or less); ● Circle = route (more than 7f)
- Days Between Races
- Small number above each bubble (e.g. 19d) = days since the previous race — helps spot freshness, layoffs, and tight scheduling.
- Shaded Band (Bollinger)
- Highlights volatility — a wider band means more variation in recent performance
- Performance Trend
- Straight line showing the overall performance direction — angled up = improving, angled down = declining
- Dashed Reference Line
- AI Opponent = AI analysis class-level par for the race
AI Model History Guide
What it shows: How our AI models rated this horse in each of its recent races, compared with how they rate today’s field (the dashed lines).
What to look for: Lines that are rising and sit above the dashed field averages — the models have liked this horse and still do. Falling lines, or lines below the dashed ones, mean the models are cooling on it.
- Lines
- Each solid line shows this horse’s model score over its last 10 races: blue = Mod1, green = Mod2, amber = Mod3.
- Dashed Lines
- Dashed lines represent the current race’s field average for each model — a score below the dashed line indicates the horse ranked below average in this model’s assessment.
- Higher is Stronger
- All three model scores are 0–100: a higher number means the model rates this horse more favorably among the field.
Mod1(W): 82 (1/8) Mod2(W): 75 (2/8) Mod3(W): 79 (3/8) Mod1-LS: 55 (6/8) Win Prob: 18.4% Value Score: 1.35 ★
Performance vs. Peers Guide
What it shows: Each horse’s career, last-3-race and last-race performance side by side, against the field average.
What to look for: Horses above the field average whose last race is green (better than their average) and whose trend line rises — improving form. Red last races and falling lines point to declining form.
- Bars (per post)
- Blue = avg career performance • Amber = avg last 3 races • Green = last race (improved vs. avg) • Red = last race (declined vs. avg)
- Trend Line
- Angled line above the bars: rising = improving form • falling = declining form.
- Horizontal Line
- Field average — the mean career performance of all horses in this race.
- Color Circles
- Standard post-position colors below each lane — same as the Total Pace chart.
- Border
- Thicker border = this horse’s post position.
Figure Comparison
What it shows: This horse’s ratings, speed figures and pace figures next to every other horse in the race.
What to look for: Where this horse (the darker column) leads the field or falls short. Strong ratings plus strong recent speed make a contender; recent speed well above career speed suggests improving form.
- Rating
- The three Pick Pony algorithm ratings (Algo 1, Algo 2, Algo 3) that make up the overall PP AI Rating — higher is a stronger contender rating.
- Speed
- Career average speed, recent 3-race average, and last-race speed figure — spot horses in improving or declining form.
- Pace
- Average Early (E1), Mid (E2), and Stretch (LP) pace figures — reveals pace-setters vs. closers vs. all-the-way types.
- This horse
- The horse whose stats card is open is highlighted with a darker column background.
Winning Profiles
What it shows: Each horse’s win rate and in-the-money rate over its last 10 starts, one dot per horse.
What to look for: Dots in the top-right are consistent winners. Top-left horses often finish in the money but rarely win — better for place and show bets or underneath in exotics. Bottom-left horses rarely finish well.
- Axes
- X: Win % from last 10 starts — Y: In-the-money % (top-3 finishes) from last 10 starts.
- Quadrants
- Consistent Winners (top-right): high win & ITM — reliable performers.
Place Threats (top-left): boards often but doesn’t win often — good exacta/trifecta angles.
Streaky (bottom-right): wins occasionally, misses the board often — all-or-nothing.
Developing (bottom-left): still finding form — longshot territory. - Reference Lines
- Dashed lines mark field averages. Dots to the right win more; dots higher board more.
- This horse
- Highlighted with a gold border and larger dot.
AI Model Comparison
What it shows: All AI model scores for every horse in the race, grouped by what each model is trained to find.
What to look for: The horse leading the green winner models is the models’ likely winner. A horse that stands out in the red longshot models but not the green ones is a longshot the models think is underrated.
- Winner Models (green)
- Mod1(W), Mod2(W), and Mod3(W) trained to predict race winners. Higher score = stronger contender.
- Longshot Models (red)
- Mod1-LS, Mod2-LS, and Mod3-LS trained to find high-value longshots. Higher score = stronger longshot candidate.
- Form Model (blue)
- Mod4 sequence model trained on recent form patterns. Higher score = stronger recent form profile.
- This horse
- Highlighted with a darker column background.
Race Pace Simulation Guide
What it shows: A simulated run of today’s race, based on each horse’s running style, post position and the expected pace.
What to look for: Who gets the lead, who gets boxed in, and who is gaining at the finish. Move the track-bias slider to see how the predicted order changes on a speed-favouring or closer-favouring track.
- Slider
- Drag left→right to advance from gate to finish. Drag all the way back to reset the race.
- Predicted Finish Order
- Factors in contested pace burn, each horse’s effort curve (peaked-early vs. peaked-late), and wide trip cost from outside posts. Updated live when Track Bias changes.
- Pace Scenario
- Lone Speed: single E horse likely rates and holds. Contested: two E horses burn each other — closers benefit. Hot Pace: speed meltdown, deep closers thrive. Soft: no early speed, moderate fractions throughout.
- Track Bias
- Slider below canvas. −2 = strong closer/wet bias; +2 = strong speed/rail bias. Recomputes the predicted finish order.
- Boxed Indicator
- Dashed orange ring = horse is surrounded (rival ahead, rival behind, wall outside). In a real race this horse must find a clear path to run.
- Running Styles
- E/EE = early speed (rushes to rail). P = presser (stalks the pace). S = stalker. SS = slow starter / closer.
| Stat | vs. Current Card | vs. All Horses |
|---|---|---|
| Averages
Career-average metrics across all AI race analysis. Performance and pace averages reflect estimated historical performance; trainer and jockey grades score in-the-money percentages. Grading scale: A = elite • B = above average • C = average • D = below average • F = poor • — = no data |
||
| Pick Pony AI Rating | B | B |
| Pace Trip Longshot | — | — |
| Connections Longshot | — | — |
| Situational Longshot | — | — |
| Speed | C | B |
| Early Pace | F | F |
| Mid Pace | F | D |
| Late Pace | A | A |
| Finish Pos | A | B |
| Dirt Speed | B | C |
| Turf Speed | B | A |
| Distance Speed | D | B |
| Trainer Effectiveness | D | D |
| Jockey Effectiveness | B | B |
| 3rd Party Ratings | C | B |
| Recent
Performance analysis from the horse's recent races, weighted to reflect current form. Sprint and Route FPS (Foot Per Second) measure pace efficiency over the horse's recent sprints and routes respectively. Grading scale: A = elite • B = above average • C = average • D = below average • F = poor • — = no data |
||
| Speed | A | B |
| Early Pace | D | D |
| Mid Pace | D | D |
| Late Pace | A | A |
| Sprint FPS | C | D |
| Route FPS | C | D |
| Trainer Effectiveness | D | D |
| Jockey Effectiveness | B | B |
| 3rd Party Ratings | C | B |
| Predictions
AI-generated projections for the upcoming race, derived from prior AI analysis for speed and pace trends, surface and distance suitability, and current conditions. Grading scale: A = elite • B = above average • C = average • D = below average • F = poor • — = no data |
||
| Speed | C | C |
| Early Pace | F | D |
| Mid Pace | D | D |
| Late Pace | C | C |
Chart Guide (2.0.41)
What it shows: This horse’s recent races, one bubble per race, plotted by its AI speed figure against the class par for today’s race (the dashed line).
What to look for: Recent bubbles at or above the dashed line, a trend line angled up, and a narrow shaded band (steady form). Check whether the good runs came on today’s surface and distance.
- Bubbles
- Color = surface: green (turf), brown (dirt), blue (synthetic)
- Top number = finishing position; bottom number in parentheses = starting post position
- Height above line = beaten lengths — closer means a smaller margin
- Border = track conditions: green (FST/GD/FM), yellow (WF/SL/YLD), red (SY/MY/FRZ/SFT/HVY)
- Connecting Line
- Solid = good conditions; dashed = bad conditions
- Line Symbol
- ▲ Triangle = sprint (7f or less); ● Circle = route (more than 7f)
- Days Between Races
- Small number above each bubble (e.g. 19d) = days since the previous race — helps spot freshness, layoffs, and tight scheduling.
- Shaded Band (Bollinger)
- Highlights volatility — a wider band means more variation in recent performance
- Performance Trend
- Straight line showing the overall performance direction — angled up = improving, angled down = declining
- Dashed Reference Line
- AI Opponent = AI analysis class-level par for the race
AI Model History Guide
What it shows: How our AI models rated this horse in each of its recent races, compared with how they rate today’s field (the dashed lines).
What to look for: Lines that are rising and sit above the dashed field averages — the models have liked this horse and still do. Falling lines, or lines below the dashed ones, mean the models are cooling on it.
- Lines
- Each solid line shows this horse’s model score over its last 10 races: blue = Mod1, green = Mod2, amber = Mod3.
- Dashed Lines
- Dashed lines represent the current race’s field average for each model — a score below the dashed line indicates the horse ranked below average in this model’s assessment.
- Higher is Stronger
- All three model scores are 0–100: a higher number means the model rates this horse more favorably among the field.
Mod1(W): 82 (1/8) Mod2(W): 75 (2/8) Mod3(W): 79 (3/8) Mod1-LS: 55 (6/8) Win Prob: 18.4% Value Score: 1.35 ★
Performance vs. Peers Guide
What it shows: Each horse’s career, last-3-race and last-race performance side by side, against the field average.
What to look for: Horses above the field average whose last race is green (better than their average) and whose trend line rises — improving form. Red last races and falling lines point to declining form.
- Bars (per post)
- Blue = avg career performance • Amber = avg last 3 races • Green = last race (improved vs. avg) • Red = last race (declined vs. avg)
- Trend Line
- Angled line above the bars: rising = improving form • falling = declining form.
- Horizontal Line
- Field average — the mean career performance of all horses in this race.
- Color Circles
- Standard post-position colors below each lane — same as the Total Pace chart.
- Border
- Thicker border = this horse’s post position.
Figure Comparison
What it shows: This horse’s ratings, speed figures and pace figures next to every other horse in the race.
What to look for: Where this horse (the darker column) leads the field or falls short. Strong ratings plus strong recent speed make a contender; recent speed well above career speed suggests improving form.
- Rating
- The three Pick Pony algorithm ratings (Algo 1, Algo 2, Algo 3) that make up the overall PP AI Rating — higher is a stronger contender rating.
- Speed
- Career average speed, recent 3-race average, and last-race speed figure — spot horses in improving or declining form.
- Pace
- Average Early (E1), Mid (E2), and Stretch (LP) pace figures — reveals pace-setters vs. closers vs. all-the-way types.
- This horse
- The horse whose stats card is open is highlighted with a darker column background.
Winning Profiles
What it shows: Each horse’s win rate and in-the-money rate over its last 10 starts, one dot per horse.
What to look for: Dots in the top-right are consistent winners. Top-left horses often finish in the money but rarely win — better for place and show bets or underneath in exotics. Bottom-left horses rarely finish well.
- Axes
- X: Win % from last 10 starts — Y: In-the-money % (top-3 finishes) from last 10 starts.
- Quadrants
- Consistent Winners (top-right): high win & ITM — reliable performers.
Place Threats (top-left): boards often but doesn’t win often — good exacta/trifecta angles.
Streaky (bottom-right): wins occasionally, misses the board often — all-or-nothing.
Developing (bottom-left): still finding form — longshot territory. - Reference Lines
- Dashed lines mark field averages. Dots to the right win more; dots higher board more.
- This horse
- Highlighted with a gold border and larger dot.
AI Model Comparison
What it shows: All AI model scores for every horse in the race, grouped by what each model is trained to find.
What to look for: The horse leading the green winner models is the models’ likely winner. A horse that stands out in the red longshot models but not the green ones is a longshot the models think is underrated.
- Winner Models (green)
- Mod1(W), Mod2(W), and Mod3(W) trained to predict race winners. Higher score = stronger contender.
- Longshot Models (red)
- Mod1-LS, Mod2-LS, and Mod3-LS trained to find high-value longshots. Higher score = stronger longshot candidate.
- Form Model (blue)
- Mod4 sequence model trained on recent form patterns. Higher score = stronger recent form profile.
- This horse
- Highlighted with a darker column background.
Race Pace Simulation Guide
What it shows: A simulated run of today’s race, based on each horse’s running style, post position and the expected pace.
What to look for: Who gets the lead, who gets boxed in, and who is gaining at the finish. Move the track-bias slider to see how the predicted order changes on a speed-favouring or closer-favouring track.
- Slider
- Drag left→right to advance from gate to finish. Drag all the way back to reset the race.
- Predicted Finish Order
- Factors in contested pace burn, each horse’s effort curve (peaked-early vs. peaked-late), and wide trip cost from outside posts. Updated live when Track Bias changes.
- Pace Scenario
- Lone Speed: single E horse likely rates and holds. Contested: two E horses burn each other — closers benefit. Hot Pace: speed meltdown, deep closers thrive. Soft: no early speed, moderate fractions throughout.
- Track Bias
- Slider below canvas. −2 = strong closer/wet bias; +2 = strong speed/rail bias. Recomputes the predicted finish order.
- Boxed Indicator
- Dashed orange ring = horse is surrounded (rival ahead, rival behind, wall outside). In a real race this horse must find a clear path to run.
- Running Styles
- E/EE = early speed (rushes to rail). P = presser (stalks the pace). S = stalker. SS = slow starter / closer.
| Stat | vs. Current Card | vs. All Horses |
|---|---|---|
| Averages
Career-average metrics across all AI race analysis. Performance and pace averages reflect estimated historical performance; trainer and jockey grades score in-the-money percentages. Grading scale: A = elite • B = above average • C = average • D = below average • F = poor • — = no data |
||
| Pick Pony AI Rating | A | B |
| Pace Trip Longshot | — | — |
| Connections Longshot | — | — |
| Situational Longshot | — | — |
| Speed | D | C |
| Early Pace | A | D |
| Mid Pace | C | D |
| Late Pace | C | B |
| Finish Pos | A | B |
| Dirt Speed | C | C |
| Turf Speed | F | C |
| Distance Speed | C | B |
| Trainer Effectiveness | C | D |
| Jockey Effectiveness | C | D |
| 3rd Party Ratings | A | B |
| Recent
Performance analysis from the horse's recent races, weighted to reflect current form. Sprint and Route FPS (Foot Per Second) measure pace efficiency over the horse's recent sprints and routes respectively. Grading scale: A = elite • B = above average • C = average • D = below average • F = poor • — = no data |
||
| Speed | D | C |
| Early Pace | B | D |
| Mid Pace | B | D |
| Late Pace | D | C |
| Sprint FPS | A | C |
| Route FPS | A | B |
| Trainer Effectiveness | C | D |
| Jockey Effectiveness | C | D |
| 3rd Party Ratings | A | B |
| Predictions
AI-generated projections for the upcoming race, derived from prior AI analysis for speed and pace trends, surface and distance suitability, and current conditions. Grading scale: A = elite • B = above average • C = average • D = below average • F = poor • — = no data |
||
| Speed | D | C |
| Early Pace | B | D |
| Mid Pace | F | D |
| Late Pace | C | C |
Chart Guide (2.0.41)
What it shows: This horse’s recent races, one bubble per race, plotted by its AI speed figure against the class par for today’s race (the dashed line).
What to look for: Recent bubbles at or above the dashed line, a trend line angled up, and a narrow shaded band (steady form). Check whether the good runs came on today’s surface and distance.
- Bubbles
- Color = surface: green (turf), brown (dirt), blue (synthetic)
- Top number = finishing position; bottom number in parentheses = starting post position
- Height above line = beaten lengths — closer means a smaller margin
- Border = track conditions: green (FST/GD/FM), yellow (WF/SL/YLD), red (SY/MY/FRZ/SFT/HVY)
- Connecting Line
- Solid = good conditions; dashed = bad conditions
- Line Symbol
- ▲ Triangle = sprint (7f or less); ● Circle = route (more than 7f)
- Days Between Races
- Small number above each bubble (e.g. 19d) = days since the previous race — helps spot freshness, layoffs, and tight scheduling.
- Shaded Band (Bollinger)
- Highlights volatility — a wider band means more variation in recent performance
- Performance Trend
- Straight line showing the overall performance direction — angled up = improving, angled down = declining
- Dashed Reference Line
- AI Opponent = AI analysis class-level par for the race
AI Model History Guide
What it shows: How our AI models rated this horse in each of its recent races, compared with how they rate today’s field (the dashed lines).
What to look for: Lines that are rising and sit above the dashed field averages — the models have liked this horse and still do. Falling lines, or lines below the dashed ones, mean the models are cooling on it.
- Lines
- Each solid line shows this horse’s model score over its last 10 races: blue = Mod1, green = Mod2, amber = Mod3.
- Dashed Lines
- Dashed lines represent the current race’s field average for each model — a score below the dashed line indicates the horse ranked below average in this model’s assessment.
- Higher is Stronger
- All three model scores are 0–100: a higher number means the model rates this horse more favorably among the field.
Mod1(W): 82 (1/8) Mod2(W): 75 (2/8) Mod3(W): 79 (3/8) Mod1-LS: 55 (6/8) Win Prob: 18.4% Value Score: 1.35 ★
Performance vs. Peers Guide
What it shows: Each horse’s career, last-3-race and last-race performance side by side, against the field average.
What to look for: Horses above the field average whose last race is green (better than their average) and whose trend line rises — improving form. Red last races and falling lines point to declining form.
- Bars (per post)
- Blue = avg career performance • Amber = avg last 3 races • Green = last race (improved vs. avg) • Red = last race (declined vs. avg)
- Trend Line
- Angled line above the bars: rising = improving form • falling = declining form.
- Horizontal Line
- Field average — the mean career performance of all horses in this race.
- Color Circles
- Standard post-position colors below each lane — same as the Total Pace chart.
- Border
- Thicker border = this horse’s post position.
Figure Comparison
What it shows: This horse’s ratings, speed figures and pace figures next to every other horse in the race.
What to look for: Where this horse (the darker column) leads the field or falls short. Strong ratings plus strong recent speed make a contender; recent speed well above career speed suggests improving form.
- Rating
- The three Pick Pony algorithm ratings (Algo 1, Algo 2, Algo 3) that make up the overall PP AI Rating — higher is a stronger contender rating.
- Speed
- Career average speed, recent 3-race average, and last-race speed figure — spot horses in improving or declining form.
- Pace
- Average Early (E1), Mid (E2), and Stretch (LP) pace figures — reveals pace-setters vs. closers vs. all-the-way types.
- This horse
- The horse whose stats card is open is highlighted with a darker column background.
Winning Profiles
What it shows: Each horse’s win rate and in-the-money rate over its last 10 starts, one dot per horse.
What to look for: Dots in the top-right are consistent winners. Top-left horses often finish in the money but rarely win — better for place and show bets or underneath in exotics. Bottom-left horses rarely finish well.
- Axes
- X: Win % from last 10 starts — Y: In-the-money % (top-3 finishes) from last 10 starts.
- Quadrants
- Consistent Winners (top-right): high win & ITM — reliable performers.
Place Threats (top-left): boards often but doesn’t win often — good exacta/trifecta angles.
Streaky (bottom-right): wins occasionally, misses the board often — all-or-nothing.
Developing (bottom-left): still finding form — longshot territory. - Reference Lines
- Dashed lines mark field averages. Dots to the right win more; dots higher board more.
- This horse
- Highlighted with a gold border and larger dot.
AI Model Comparison
What it shows: All AI model scores for every horse in the race, grouped by what each model is trained to find.
What to look for: The horse leading the green winner models is the models’ likely winner. A horse that stands out in the red longshot models but not the green ones is a longshot the models think is underrated.
- Winner Models (green)
- Mod1(W), Mod2(W), and Mod3(W) trained to predict race winners. Higher score = stronger contender.
- Longshot Models (red)
- Mod1-LS, Mod2-LS, and Mod3-LS trained to find high-value longshots. Higher score = stronger longshot candidate.
- Form Model (blue)
- Mod4 sequence model trained on recent form patterns. Higher score = stronger recent form profile.
- This horse
- Highlighted with a darker column background.
Race Pace Simulation Guide
What it shows: A simulated run of today’s race, based on each horse’s running style, post position and the expected pace.
What to look for: Who gets the lead, who gets boxed in, and who is gaining at the finish. Move the track-bias slider to see how the predicted order changes on a speed-favouring or closer-favouring track.
- Slider
- Drag left→right to advance from gate to finish. Drag all the way back to reset the race.
- Predicted Finish Order
- Factors in contested pace burn, each horse’s effort curve (peaked-early vs. peaked-late), and wide trip cost from outside posts. Updated live when Track Bias changes.
- Pace Scenario
- Lone Speed: single E horse likely rates and holds. Contested: two E horses burn each other — closers benefit. Hot Pace: speed meltdown, deep closers thrive. Soft: no early speed, moderate fractions throughout.
- Track Bias
- Slider below canvas. −2 = strong closer/wet bias; +2 = strong speed/rail bias. Recomputes the predicted finish order.
- Boxed Indicator
- Dashed orange ring = horse is surrounded (rival ahead, rival behind, wall outside). In a real race this horse must find a clear path to run.
- Running Styles
- E/EE = early speed (rushes to rail). P = presser (stalks the pace). S = stalker. SS = slow starter / closer.
| Stat | vs. Current Card | vs. All Horses |
|---|---|---|
| Averages
Career-average metrics across all AI race analysis. Performance and pace averages reflect estimated historical performance; trainer and jockey grades score in-the-money percentages. Grading scale: A = elite • B = above average • C = average • D = below average • F = poor • — = no data |
||
| Pick Pony AI Rating | D | C |
| Pace Trip Longshot | — | — |
| Connections Longshot | — | — |
| Situational Longshot | — | — |
| Speed | C | C |
| Early Pace | B | D |
| Mid Pace | B | C |
| Late Pace | F | C |
| Finish Pos | C | C |
| Dirt Speed | C | C |
| Turf Speed | C | B |
| Distance Speed | D | B |
| Trainer Effectiveness | B | B |
| Jockey Effectiveness | A | B |
| 3rd Party Ratings | D | C |
| Recent
Performance analysis from the horse's recent races, weighted to reflect current form. Sprint and Route FPS (Foot Per Second) measure pace efficiency over the horse's recent sprints and routes respectively. Grading scale: A = elite • B = above average • C = average • D = below average • F = poor • — = no data |
||
| Speed | C | C |
| Early Pace | C | D |
| Mid Pace | C | D |
| Late Pace | C | B |
| Sprint FPS | D | F |
| Route FPS | D | F |
| Trainer Effectiveness | B | B |
| Jockey Effectiveness | A | B |
| 3rd Party Ratings | D | C |
| Predictions
AI-generated projections for the upcoming race, derived from prior AI analysis for speed and pace trends, surface and distance suitability, and current conditions. Grading scale: A = elite • B = above average • C = average • D = below average • F = poor • — = no data |
||
| Speed | C | C |
| Early Pace | A | C |
| Mid Pace | B | C |
| Late Pace | C | C |
Chart Guide (2.0.41)
What it shows: This horse’s recent races, one bubble per race, plotted by its AI speed figure against the class par for today’s race (the dashed line).
What to look for: Recent bubbles at or above the dashed line, a trend line angled up, and a narrow shaded band (steady form). Check whether the good runs came on today’s surface and distance.
- Bubbles
- Color = surface: green (turf), brown (dirt), blue (synthetic)
- Top number = finishing position; bottom number in parentheses = starting post position
- Height above line = beaten lengths — closer means a smaller margin
- Border = track conditions: green (FST/GD/FM), yellow (WF/SL/YLD), red (SY/MY/FRZ/SFT/HVY)
- Connecting Line
- Solid = good conditions; dashed = bad conditions
- Line Symbol
- ▲ Triangle = sprint (7f or less); ● Circle = route (more than 7f)
- Days Between Races
- Small number above each bubble (e.g. 19d) = days since the previous race — helps spot freshness, layoffs, and tight scheduling.
- Shaded Band (Bollinger)
- Highlights volatility — a wider band means more variation in recent performance
- Performance Trend
- Straight line showing the overall performance direction — angled up = improving, angled down = declining
- Dashed Reference Line
- AI Opponent = AI analysis class-level par for the race
AI Model History Guide
What it shows: How our AI models rated this horse in each of its recent races, compared with how they rate today’s field (the dashed lines).
What to look for: Lines that are rising and sit above the dashed field averages — the models have liked this horse and still do. Falling lines, or lines below the dashed ones, mean the models are cooling on it.
- Lines
- Each solid line shows this horse’s model score over its last 10 races: blue = Mod1, green = Mod2, amber = Mod3.
- Dashed Lines
- Dashed lines represent the current race’s field average for each model — a score below the dashed line indicates the horse ranked below average in this model’s assessment.
- Higher is Stronger
- All three model scores are 0–100: a higher number means the model rates this horse more favorably among the field.
Mod1(W): 82 (1/8) Mod2(W): 75 (2/8) Mod3(W): 79 (3/8) Mod1-LS: 55 (6/8) Win Prob: 18.4% Value Score: 1.35 ★
Performance vs. Peers Guide
What it shows: Each horse’s career, last-3-race and last-race performance side by side, against the field average.
What to look for: Horses above the field average whose last race is green (better than their average) and whose trend line rises — improving form. Red last races and falling lines point to declining form.
- Bars (per post)
- Blue = avg career performance • Amber = avg last 3 races • Green = last race (improved vs. avg) • Red = last race (declined vs. avg)
- Trend Line
- Angled line above the bars: rising = improving form • falling = declining form.
- Horizontal Line
- Field average — the mean career performance of all horses in this race.
- Color Circles
- Standard post-position colors below each lane — same as the Total Pace chart.
- Border
- Thicker border = this horse’s post position.
Figure Comparison
What it shows: This horse’s ratings, speed figures and pace figures next to every other horse in the race.
What to look for: Where this horse (the darker column) leads the field or falls short. Strong ratings plus strong recent speed make a contender; recent speed well above career speed suggests improving form.
- Rating
- The three Pick Pony algorithm ratings (Algo 1, Algo 2, Algo 3) that make up the overall PP AI Rating — higher is a stronger contender rating.
- Speed
- Career average speed, recent 3-race average, and last-race speed figure — spot horses in improving or declining form.
- Pace
- Average Early (E1), Mid (E2), and Stretch (LP) pace figures — reveals pace-setters vs. closers vs. all-the-way types.
- This horse
- The horse whose stats card is open is highlighted with a darker column background.
Winning Profiles
What it shows: Each horse’s win rate and in-the-money rate over its last 10 starts, one dot per horse.
What to look for: Dots in the top-right are consistent winners. Top-left horses often finish in the money but rarely win — better for place and show bets or underneath in exotics. Bottom-left horses rarely finish well.
- Axes
- X: Win % from last 10 starts — Y: In-the-money % (top-3 finishes) from last 10 starts.
- Quadrants
- Consistent Winners (top-right): high win & ITM — reliable performers.
Place Threats (top-left): boards often but doesn’t win often — good exacta/trifecta angles.
Streaky (bottom-right): wins occasionally, misses the board often — all-or-nothing.
Developing (bottom-left): still finding form — longshot territory. - Reference Lines
- Dashed lines mark field averages. Dots to the right win more; dots higher board more.
- This horse
- Highlighted with a gold border and larger dot.
AI Model Comparison
What it shows: All AI model scores for every horse in the race, grouped by what each model is trained to find.
What to look for: The horse leading the green winner models is the models’ likely winner. A horse that stands out in the red longshot models but not the green ones is a longshot the models think is underrated.
- Winner Models (green)
- Mod1(W), Mod2(W), and Mod3(W) trained to predict race winners. Higher score = stronger contender.
- Longshot Models (red)
- Mod1-LS, Mod2-LS, and Mod3-LS trained to find high-value longshots. Higher score = stronger longshot candidate.
- Form Model (blue)
- Mod4 sequence model trained on recent form patterns. Higher score = stronger recent form profile.
- This horse
- Highlighted with a darker column background.
Race Pace Simulation Guide
What it shows: A simulated run of today’s race, based on each horse’s running style, post position and the expected pace.
What to look for: Who gets the lead, who gets boxed in, and who is gaining at the finish. Move the track-bias slider to see how the predicted order changes on a speed-favouring or closer-favouring track.
- Slider
- Drag left→right to advance from gate to finish. Drag all the way back to reset the race.
- Predicted Finish Order
- Factors in contested pace burn, each horse’s effort curve (peaked-early vs. peaked-late), and wide trip cost from outside posts. Updated live when Track Bias changes.
- Pace Scenario
- Lone Speed: single E horse likely rates and holds. Contested: two E horses burn each other — closers benefit. Hot Pace: speed meltdown, deep closers thrive. Soft: no early speed, moderate fractions throughout.
- Track Bias
- Slider below canvas. −2 = strong closer/wet bias; +2 = strong speed/rail bias. Recomputes the predicted finish order.
- Boxed Indicator
- Dashed orange ring = horse is surrounded (rival ahead, rival behind, wall outside). In a real race this horse must find a clear path to run.
- Running Styles
- E/EE = early speed (rushes to rail). P = presser (stalks the pace). S = stalker. SS = slow starter / closer.
| Stat | vs. Current Card | vs. All Horses |
|---|---|---|
| Averages
Career-average metrics across all AI race analysis. Performance and pace averages reflect estimated historical performance; trainer and jockey grades score in-the-money percentages. Grading scale: A = elite • B = above average • C = average • D = below average • F = poor • — = no data |
||
| Pick Pony AI Rating | A | A |
| Pace Trip Longshot | — | — |
| Connections Longshot | — | — |
| Situational Longshot | — | — |
| Speed | A | A |
| Early Pace | C | D |
| Mid Pace | A | C |
| Late Pace | A | A |
| Finish Pos | B | C |
| Dirt Speed | A | B |
| Turf Speed | A | A |
| Distance Speed | B | B |
| Trainer Effectiveness | A | B |
| Jockey Effectiveness | A | A |
| 3rd Party Ratings | A | B |
| Recent
Performance analysis from the horse's recent races, weighted to reflect current form. Sprint and Route FPS (Foot Per Second) measure pace efficiency over the horse's recent sprints and routes respectively. Grading scale: A = elite • B = above average • C = average • D = below average • F = poor • — = no data |
||
| Speed | A | B |
| Early Pace | A | C |
| Mid Pace | A | C |
| Late Pace | A | A |
| Sprint FPS | B | C |
| Route FPS | B | B |
| Trainer Effectiveness | A | B |
| Jockey Effectiveness | A | A |
| 3rd Party Ratings | A | B |
| Predictions
AI-generated projections for the upcoming race, derived from prior AI analysis for speed and pace trends, surface and distance suitability, and current conditions. Grading scale: A = elite • B = above average • C = average • D = below average • F = poor • — = no data |
||
| Speed | A | B |
| Early Pace | C | D |
| Mid Pace | A | C |
| Late Pace | C | C |
Chart Guide (2.0.41)
What it shows: This horse’s recent races, one bubble per race, plotted by its AI speed figure against the class par for today’s race (the dashed line).
What to look for: Recent bubbles at or above the dashed line, a trend line angled up, and a narrow shaded band (steady form). Check whether the good runs came on today’s surface and distance.
- Bubbles
- Color = surface: green (turf), brown (dirt), blue (synthetic)
- Top number = finishing position; bottom number in parentheses = starting post position
- Height above line = beaten lengths — closer means a smaller margin
- Border = track conditions: green (FST/GD/FM), yellow (WF/SL/YLD), red (SY/MY/FRZ/SFT/HVY)
- Connecting Line
- Solid = good conditions; dashed = bad conditions
- Line Symbol
- ▲ Triangle = sprint (7f or less); ● Circle = route (more than 7f)
- Days Between Races
- Small number above each bubble (e.g. 19d) = days since the previous race — helps spot freshness, layoffs, and tight scheduling.
- Shaded Band (Bollinger)
- Highlights volatility — a wider band means more variation in recent performance
- Performance Trend
- Straight line showing the overall performance direction — angled up = improving, angled down = declining
- Dashed Reference Line
- AI Opponent = AI analysis class-level par for the race
AI Model History Guide
What it shows: How our AI models rated this horse in each of its recent races, compared with how they rate today’s field (the dashed lines).
What to look for: Lines that are rising and sit above the dashed field averages — the models have liked this horse and still do. Falling lines, or lines below the dashed ones, mean the models are cooling on it.
- Lines
- Each solid line shows this horse’s model score over its last 10 races: blue = Mod1, green = Mod2, amber = Mod3.
- Dashed Lines
- Dashed lines represent the current race’s field average for each model — a score below the dashed line indicates the horse ranked below average in this model’s assessment.
- Higher is Stronger
- All three model scores are 0–100: a higher number means the model rates this horse more favorably among the field.
Mod1(W): 82 (1/8) Mod2(W): 75 (2/8) Mod3(W): 79 (3/8) Mod1-LS: 55 (6/8) Win Prob: 18.4% Value Score: 1.35 ★
Performance vs. Peers Guide
What it shows: Each horse’s career, last-3-race and last-race performance side by side, against the field average.
What to look for: Horses above the field average whose last race is green (better than their average) and whose trend line rises — improving form. Red last races and falling lines point to declining form.
- Bars (per post)
- Blue = avg career performance • Amber = avg last 3 races • Green = last race (improved vs. avg) • Red = last race (declined vs. avg)
- Trend Line
- Angled line above the bars: rising = improving form • falling = declining form.
- Horizontal Line
- Field average — the mean career performance of all horses in this race.
- Color Circles
- Standard post-position colors below each lane — same as the Total Pace chart.
- Border
- Thicker border = this horse’s post position.
Figure Comparison
What it shows: This horse’s ratings, speed figures and pace figures next to every other horse in the race.
What to look for: Where this horse (the darker column) leads the field or falls short. Strong ratings plus strong recent speed make a contender; recent speed well above career speed suggests improving form.
- Rating
- The three Pick Pony algorithm ratings (Algo 1, Algo 2, Algo 3) that make up the overall PP AI Rating — higher is a stronger contender rating.
- Speed
- Career average speed, recent 3-race average, and last-race speed figure — spot horses in improving or declining form.
- Pace
- Average Early (E1), Mid (E2), and Stretch (LP) pace figures — reveals pace-setters vs. closers vs. all-the-way types.
- This horse
- The horse whose stats card is open is highlighted with a darker column background.
Winning Profiles
What it shows: Each horse’s win rate and in-the-money rate over its last 10 starts, one dot per horse.
What to look for: Dots in the top-right are consistent winners. Top-left horses often finish in the money but rarely win — better for place and show bets or underneath in exotics. Bottom-left horses rarely finish well.
- Axes
- X: Win % from last 10 starts — Y: In-the-money % (top-3 finishes) from last 10 starts.
- Quadrants
- Consistent Winners (top-right): high win & ITM — reliable performers.
Place Threats (top-left): boards often but doesn’t win often — good exacta/trifecta angles.
Streaky (bottom-right): wins occasionally, misses the board often — all-or-nothing.
Developing (bottom-left): still finding form — longshot territory. - Reference Lines
- Dashed lines mark field averages. Dots to the right win more; dots higher board more.
- This horse
- Highlighted with a gold border and larger dot.
AI Model Comparison
What it shows: All AI model scores for every horse in the race, grouped by what each model is trained to find.
What to look for: The horse leading the green winner models is the models’ likely winner. A horse that stands out in the red longshot models but not the green ones is a longshot the models think is underrated.
- Winner Models (green)
- Mod1(W), Mod2(W), and Mod3(W) trained to predict race winners. Higher score = stronger contender.
- Longshot Models (red)
- Mod1-LS, Mod2-LS, and Mod3-LS trained to find high-value longshots. Higher score = stronger longshot candidate.
- Form Model (blue)
- Mod4 sequence model trained on recent form patterns. Higher score = stronger recent form profile.
- This horse
- Highlighted with a darker column background.
Race Pace Simulation Guide
What it shows: A simulated run of today’s race, based on each horse’s running style, post position and the expected pace.
What to look for: Who gets the lead, who gets boxed in, and who is gaining at the finish. Move the track-bias slider to see how the predicted order changes on a speed-favouring or closer-favouring track.
- Slider
- Drag left→right to advance from gate to finish. Drag all the way back to reset the race.
- Predicted Finish Order
- Factors in contested pace burn, each horse’s effort curve (peaked-early vs. peaked-late), and wide trip cost from outside posts. Updated live when Track Bias changes.
- Pace Scenario
- Lone Speed: single E horse likely rates and holds. Contested: two E horses burn each other — closers benefit. Hot Pace: speed meltdown, deep closers thrive. Soft: no early speed, moderate fractions throughout.
- Track Bias
- Slider below canvas. −2 = strong closer/wet bias; +2 = strong speed/rail bias. Recomputes the predicted finish order.
- Boxed Indicator
- Dashed orange ring = horse is surrounded (rival ahead, rival behind, wall outside). In a real race this horse must find a clear path to run.
- Running Styles
- E/EE = early speed (rushes to rail). P = presser (stalks the pace). S = stalker. SS = slow starter / closer.
| Stat | vs. Current Card | vs. All Horses |
|---|---|---|
| Averages
Career-average metrics across all AI race analysis. Performance and pace averages reflect estimated historical performance; trainer and jockey grades score in-the-money percentages. Grading scale: A = elite • B = above average • C = average • D = below average • F = poor • — = no data |
||
| Pick Pony AI Rating | D | C |
| Pace Trip Longshot | — | — |
| Connections Longshot | — | — |
| Situational Longshot | — | — |
| Speed | F | B |
| Early Pace | D | C |
| Mid Pace | D | B |
| Late Pace | F | B |
| Finish Pos | F | F |
| Dirt Speed | B | D |
| Turf Speed | D | A |
| Distance Speed | C | A |
| Trainer Effectiveness | D | D |
| Jockey Effectiveness | D | C |
| 3rd Party Ratings | F | A |
| Recent
Performance analysis from the horse's recent races, weighted to reflect current form. Sprint and Route FPS (Foot Per Second) measure pace efficiency over the horse's recent sprints and routes respectively. Grading scale: A = elite • B = above average • C = average • D = below average • F = poor • — = no data |
||
| Speed | D | A |
| Early Pace | D | C |
| Mid Pace | D | B |
| Late Pace | D | A |
| Sprint FPS | D | D |
| Route FPS | D | D |
| Trainer Effectiveness | D | D |
| Jockey Effectiveness | D | C |
| 3rd Party Ratings | F | A |
| Predictions
AI-generated projections for the upcoming race, derived from prior AI analysis for speed and pace trends, surface and distance suitability, and current conditions. Grading scale: A = elite • B = above average • C = average • D = below average • F = poor • — = no data |
||
| Speed | D | B |
| Early Pace | D | C |
| Mid Pace | D | B |
| Late Pace | C | C |
Chart Guide (2.0.41)
What it shows: This horse’s recent races, one bubble per race, plotted by its AI speed figure against the class par for today’s race (the dashed line).
What to look for: Recent bubbles at or above the dashed line, a trend line angled up, and a narrow shaded band (steady form). Check whether the good runs came on today’s surface and distance.
- Bubbles
- Color = surface: green (turf), brown (dirt), blue (synthetic)
- Top number = finishing position; bottom number in parentheses = starting post position
- Height above line = beaten lengths — closer means a smaller margin
- Border = track conditions: green (FST/GD/FM), yellow (WF/SL/YLD), red (SY/MY/FRZ/SFT/HVY)
- Connecting Line
- Solid = good conditions; dashed = bad conditions
- Line Symbol
- ▲ Triangle = sprint (7f or less); ● Circle = route (more than 7f)
- Days Between Races
- Small number above each bubble (e.g. 19d) = days since the previous race — helps spot freshness, layoffs, and tight scheduling.
- Shaded Band (Bollinger)
- Highlights volatility — a wider band means more variation in recent performance
- Performance Trend
- Straight line showing the overall performance direction — angled up = improving, angled down = declining
- Dashed Reference Line
- AI Opponent = AI analysis class-level par for the race
AI Model History Guide
What it shows: How our AI models rated this horse in each of its recent races, compared with how they rate today’s field (the dashed lines).
What to look for: Lines that are rising and sit above the dashed field averages — the models have liked this horse and still do. Falling lines, or lines below the dashed ones, mean the models are cooling on it.
- Lines
- Each solid line shows this horse’s model score over its last 10 races: blue = Mod1, green = Mod2, amber = Mod3.
- Dashed Lines
- Dashed lines represent the current race’s field average for each model — a score below the dashed line indicates the horse ranked below average in this model’s assessment.
- Higher is Stronger
- All three model scores are 0–100: a higher number means the model rates this horse more favorably among the field.
Mod1(W): 82 (1/8) Mod2(W): 75 (2/8) Mod3(W): 79 (3/8) Mod1-LS: 55 (6/8) Win Prob: 18.4% Value Score: 1.35 ★
Performance vs. Peers Guide
What it shows: Each horse’s career, last-3-race and last-race performance side by side, against the field average.
What to look for: Horses above the field average whose last race is green (better than their average) and whose trend line rises — improving form. Red last races and falling lines point to declining form.
- Bars (per post)
- Blue = avg career performance • Amber = avg last 3 races • Green = last race (improved vs. avg) • Red = last race (declined vs. avg)
- Trend Line
- Angled line above the bars: rising = improving form • falling = declining form.
- Horizontal Line
- Field average — the mean career performance of all horses in this race.
- Color Circles
- Standard post-position colors below each lane — same as the Total Pace chart.
- Border
- Thicker border = this horse’s post position.
Figure Comparison
What it shows: This horse’s ratings, speed figures and pace figures next to every other horse in the race.
What to look for: Where this horse (the darker column) leads the field or falls short. Strong ratings plus strong recent speed make a contender; recent speed well above career speed suggests improving form.
- Rating
- The three Pick Pony algorithm ratings (Algo 1, Algo 2, Algo 3) that make up the overall PP AI Rating — higher is a stronger contender rating.
- Speed
- Career average speed, recent 3-race average, and last-race speed figure — spot horses in improving or declining form.
- Pace
- Average Early (E1), Mid (E2), and Stretch (LP) pace figures — reveals pace-setters vs. closers vs. all-the-way types.
- This horse
- The horse whose stats card is open is highlighted with a darker column background.
Winning Profiles
What it shows: Each horse’s win rate and in-the-money rate over its last 10 starts, one dot per horse.
What to look for: Dots in the top-right are consistent winners. Top-left horses often finish in the money but rarely win — better for place and show bets or underneath in exotics. Bottom-left horses rarely finish well.
- Axes
- X: Win % from last 10 starts — Y: In-the-money % (top-3 finishes) from last 10 starts.
- Quadrants
- Consistent Winners (top-right): high win & ITM — reliable performers.
Place Threats (top-left): boards often but doesn’t win often — good exacta/trifecta angles.
Streaky (bottom-right): wins occasionally, misses the board often — all-or-nothing.
Developing (bottom-left): still finding form — longshot territory. - Reference Lines
- Dashed lines mark field averages. Dots to the right win more; dots higher board more.
- This horse
- Highlighted with a gold border and larger dot.
AI Model Comparison
What it shows: All AI model scores for every horse in the race, grouped by what each model is trained to find.
What to look for: The horse leading the green winner models is the models’ likely winner. A horse that stands out in the red longshot models but not the green ones is a longshot the models think is underrated.
- Winner Models (green)
- Mod1(W), Mod2(W), and Mod3(W) trained to predict race winners. Higher score = stronger contender.
- Longshot Models (red)
- Mod1-LS, Mod2-LS, and Mod3-LS trained to find high-value longshots. Higher score = stronger longshot candidate.
- Form Model (blue)
- Mod4 sequence model trained on recent form patterns. Higher score = stronger recent form profile.
- This horse
- Highlighted with a darker column background.
Race Pace Simulation Guide
What it shows: A simulated run of today’s race, based on each horse’s running style, post position and the expected pace.
What to look for: Who gets the lead, who gets boxed in, and who is gaining at the finish. Move the track-bias slider to see how the predicted order changes on a speed-favouring or closer-favouring track.
- Slider
- Drag left→right to advance from gate to finish. Drag all the way back to reset the race.
- Predicted Finish Order
- Factors in contested pace burn, each horse’s effort curve (peaked-early vs. peaked-late), and wide trip cost from outside posts. Updated live when Track Bias changes.
- Pace Scenario
- Lone Speed: single E horse likely rates and holds. Contested: two E horses burn each other — closers benefit. Hot Pace: speed meltdown, deep closers thrive. Soft: no early speed, moderate fractions throughout.
- Track Bias
- Slider below canvas. −2 = strong closer/wet bias; +2 = strong speed/rail bias. Recomputes the predicted finish order.
- Boxed Indicator
- Dashed orange ring = horse is surrounded (rival ahead, rival behind, wall outside). In a real race this horse must find a clear path to run.
- Running Styles
- E/EE = early speed (rushes to rail). P = presser (stalks the pace). S = stalker. SS = slow starter / closer.
| Stat | vs. Current Card | vs. All Horses |
|---|---|---|
| Averages
Career-average metrics across all AI race analysis. Performance and pace averages reflect estimated historical performance; trainer and jockey grades score in-the-money percentages. Grading scale: A = elite • B = above average • C = average • D = below average • F = poor • — = no data |
||
| Pick Pony AI Rating | A | B |
| Pace Trip Longshot | — | — |
| Connections Longshot | — | — |
| Situational Longshot | — | — |
| Speed | A | A |
| Early Pace | B | B |
| Mid Pace | A | A |
| Late Pace | B | A |
| Finish Pos | C | C |
| Dirt Speed | D | F |
| Turf Speed | A | A |
| Distance Speed | D | A |
| Trainer Effectiveness | F | D |
| Jockey Effectiveness | F | C |
| 3rd Party Ratings | B | A |
| Recent
Performance analysis from the horse's recent races, weighted to reflect current form. Sprint and Route FPS (Foot Per Second) measure pace efficiency over the horse's recent sprints and routes respectively. Grading scale: A = elite • B = above average • C = average • D = below average • F = poor • — = no data |
||
| Speed | A | A |
| Early Pace | C | B |
| Mid Pace | A | A |
| Late Pace | D | A |
| Sprint FPS | D | C |
| Route FPS | B | B |
| Trainer Effectiveness | F | D |
| Jockey Effectiveness | F | C |
| 3rd Party Ratings | B | A |
| Predictions
AI-generated projections for the upcoming race, derived from prior AI analysis for speed and pace trends, surface and distance suitability, and current conditions. Grading scale: A = elite • B = above average • C = average • D = below average • F = poor • — = no data |
||
| Speed | A | A |
| Early Pace | B | B |
| Mid Pace | A | A |
| Late Pace | C | C |
Chart Guide (2.0.41)
What it shows: This horse’s recent races, one bubble per race, plotted by its AI speed figure against the class par for today’s race (the dashed line).
What to look for: Recent bubbles at or above the dashed line, a trend line angled up, and a narrow shaded band (steady form). Check whether the good runs came on today’s surface and distance.
- Bubbles
- Color = surface: green (turf), brown (dirt), blue (synthetic)
- Top number = finishing position; bottom number in parentheses = starting post position
- Height above line = beaten lengths — closer means a smaller margin
- Border = track conditions: green (FST/GD/FM), yellow (WF/SL/YLD), red (SY/MY/FRZ/SFT/HVY)
- Connecting Line
- Solid = good conditions; dashed = bad conditions
- Line Symbol
- ▲ Triangle = sprint (7f or less); ● Circle = route (more than 7f)
- Days Between Races
- Small number above each bubble (e.g. 19d) = days since the previous race — helps spot freshness, layoffs, and tight scheduling.
- Shaded Band (Bollinger)
- Highlights volatility — a wider band means more variation in recent performance
- Performance Trend
- Straight line showing the overall performance direction — angled up = improving, angled down = declining
- Dashed Reference Line
- AI Opponent = AI analysis class-level par for the race
AI Model History Guide
What it shows: How our AI models rated this horse in each of its recent races, compared with how they rate today’s field (the dashed lines).
What to look for: Lines that are rising and sit above the dashed field averages — the models have liked this horse and still do. Falling lines, or lines below the dashed ones, mean the models are cooling on it.
- Lines
- Each solid line shows this horse’s model score over its last 10 races: blue = Mod1, green = Mod2, amber = Mod3.
- Dashed Lines
- Dashed lines represent the current race’s field average for each model — a score below the dashed line indicates the horse ranked below average in this model’s assessment.
- Higher is Stronger
- All three model scores are 0–100: a higher number means the model rates this horse more favorably among the field.
Mod1(W): 82 (1/8) Mod2(W): 75 (2/8) Mod3(W): 79 (3/8) Mod1-LS: 55 (6/8) Win Prob: 18.4% Value Score: 1.35 ★
Performance vs. Peers Guide
What it shows: Each horse’s career, last-3-race and last-race performance side by side, against the field average.
What to look for: Horses above the field average whose last race is green (better than their average) and whose trend line rises — improving form. Red last races and falling lines point to declining form.
- Bars (per post)
- Blue = avg career performance • Amber = avg last 3 races • Green = last race (improved vs. avg) • Red = last race (declined vs. avg)
- Trend Line
- Angled line above the bars: rising = improving form • falling = declining form.
- Horizontal Line
- Field average — the mean career performance of all horses in this race.
- Color Circles
- Standard post-position colors below each lane — same as the Total Pace chart.
- Border
- Thicker border = this horse’s post position.
Figure Comparison
What it shows: This horse’s ratings, speed figures and pace figures next to every other horse in the race.
What to look for: Where this horse (the darker column) leads the field or falls short. Strong ratings plus strong recent speed make a contender; recent speed well above career speed suggests improving form.
- Rating
- The three Pick Pony algorithm ratings (Algo 1, Algo 2, Algo 3) that make up the overall PP AI Rating — higher is a stronger contender rating.
- Speed
- Career average speed, recent 3-race average, and last-race speed figure — spot horses in improving or declining form.
- Pace
- Average Early (E1), Mid (E2), and Stretch (LP) pace figures — reveals pace-setters vs. closers vs. all-the-way types.
- This horse
- The horse whose stats card is open is highlighted with a darker column background.
Winning Profiles
What it shows: Each horse’s win rate and in-the-money rate over its last 10 starts, one dot per horse.
What to look for: Dots in the top-right are consistent winners. Top-left horses often finish in the money but rarely win — better for place and show bets or underneath in exotics. Bottom-left horses rarely finish well.
- Axes
- X: Win % from last 10 starts — Y: In-the-money % (top-3 finishes) from last 10 starts.
- Quadrants
- Consistent Winners (top-right): high win & ITM — reliable performers.
Place Threats (top-left): boards often but doesn’t win often — good exacta/trifecta angles.
Streaky (bottom-right): wins occasionally, misses the board often — all-or-nothing.
Developing (bottom-left): still finding form — longshot territory. - Reference Lines
- Dashed lines mark field averages. Dots to the right win more; dots higher board more.
- This horse
- Highlighted with a gold border and larger dot.
AI Model Comparison
What it shows: All AI model scores for every horse in the race, grouped by what each model is trained to find.
What to look for: The horse leading the green winner models is the models’ likely winner. A horse that stands out in the red longshot models but not the green ones is a longshot the models think is underrated.
- Winner Models (green)
- Mod1(W), Mod2(W), and Mod3(W) trained to predict race winners. Higher score = stronger contender.
- Longshot Models (red)
- Mod1-LS, Mod2-LS, and Mod3-LS trained to find high-value longshots. Higher score = stronger longshot candidate.
- Form Model (blue)
- Mod4 sequence model trained on recent form patterns. Higher score = stronger recent form profile.
- This horse
- Highlighted with a darker column background.
Race Pace Simulation Guide
What it shows: A simulated run of today’s race, based on each horse’s running style, post position and the expected pace.
What to look for: Who gets the lead, who gets boxed in, and who is gaining at the finish. Move the track-bias slider to see how the predicted order changes on a speed-favouring or closer-favouring track.
- Slider
- Drag left→right to advance from gate to finish. Drag all the way back to reset the race.
- Predicted Finish Order
- Factors in contested pace burn, each horse’s effort curve (peaked-early vs. peaked-late), and wide trip cost from outside posts. Updated live when Track Bias changes.
- Pace Scenario
- Lone Speed: single E horse likely rates and holds. Contested: two E horses burn each other — closers benefit. Hot Pace: speed meltdown, deep closers thrive. Soft: no early speed, moderate fractions throughout.
- Track Bias
- Slider below canvas. −2 = strong closer/wet bias; +2 = strong speed/rail bias. Recomputes the predicted finish order.
- Boxed Indicator
- Dashed orange ring = horse is surrounded (rival ahead, rival behind, wall outside). In a real race this horse must find a clear path to run.
- Running Styles
- E/EE = early speed (rushes to rail). P = presser (stalks the pace). S = stalker. SS = slow starter / closer.
| Stat | vs. Current Card | vs. All Horses |
|---|---|---|
| Averages
Career-average metrics across all AI race analysis. Performance and pace averages reflect estimated historical performance; trainer and jockey grades score in-the-money percentages. Grading scale: A = elite • B = above average • C = average • D = below average • F = poor • — = no data |
||
| Pick Pony AI Rating | B | C |
| Pace Trip Longshot | — | — |
| Connections Longshot | — | — |
| Situational Longshot | — | — |
| Speed | A | A |
| Early Pace | A | B |
| Mid Pace | B | A |
| Late Pace | B | A |
| Finish Pos | D | C |
| Dirt Speed | A | A |
| Turf Speed | B | A |
| Distance Speed | C | A |
| Trainer Effectiveness | C | B |
| Jockey Effectiveness | A | B |
| 3rd Party Ratings | D | A |
| Recent
Performance analysis from the horse's recent races, weighted to reflect current form. Sprint and Route FPS (Foot Per Second) measure pace efficiency over the horse's recent sprints and routes respectively. Grading scale: A = elite • B = above average • C = average • D = below average • F = poor • — = no data |
||
| Speed | C | A |
| Early Pace | A | A |
| Mid Pace | B | A |
| Late Pace | D | A |
| Sprint FPS | B | B |
| Route FPS | B | B |
| Trainer Effectiveness | C | B |
| Jockey Effectiveness | A | B |
| 3rd Party Ratings | D | A |
| Predictions
AI-generated projections for the upcoming race, derived from prior AI analysis for speed and pace trends, surface and distance suitability, and current conditions. Grading scale: A = elite • B = above average • C = average • D = below average • F = poor • — = no data |
||
| Speed | B | A |
| Early Pace | A | B |
| Mid Pace | B | A |
| Late Pace | C | C |
Chart Guide (2.0.41)
What it shows: This horse’s recent races, one bubble per race, plotted by its AI speed figure against the class par for today’s race (the dashed line).
What to look for: Recent bubbles at or above the dashed line, a trend line angled up, and a narrow shaded band (steady form). Check whether the good runs came on today’s surface and distance.
- Bubbles
- Color = surface: green (turf), brown (dirt), blue (synthetic)
- Top number = finishing position; bottom number in parentheses = starting post position
- Height above line = beaten lengths — closer means a smaller margin
- Border = track conditions: green (FST/GD/FM), yellow (WF/SL/YLD), red (SY/MY/FRZ/SFT/HVY)
- Connecting Line
- Solid = good conditions; dashed = bad conditions
- Line Symbol
- ▲ Triangle = sprint (7f or less); ● Circle = route (more than 7f)
- Days Between Races
- Small number above each bubble (e.g. 19d) = days since the previous race — helps spot freshness, layoffs, and tight scheduling.
- Shaded Band (Bollinger)
- Highlights volatility — a wider band means more variation in recent performance
- Performance Trend
- Straight line showing the overall performance direction — angled up = improving, angled down = declining
- Dashed Reference Line
- AI Opponent = AI analysis class-level par for the race
AI Model History Guide
What it shows: How our AI models rated this horse in each of its recent races, compared with how they rate today’s field (the dashed lines).
What to look for: Lines that are rising and sit above the dashed field averages — the models have liked this horse and still do. Falling lines, or lines below the dashed ones, mean the models are cooling on it.
- Lines
- Each solid line shows this horse’s model score over its last 10 races: blue = Mod1, green = Mod2, amber = Mod3.
- Dashed Lines
- Dashed lines represent the current race’s field average for each model — a score below the dashed line indicates the horse ranked below average in this model’s assessment.
- Higher is Stronger
- All three model scores are 0–100: a higher number means the model rates this horse more favorably among the field.
Mod1(W): 82 (1/8) Mod2(W): 75 (2/8) Mod3(W): 79 (3/8) Mod1-LS: 55 (6/8) Win Prob: 18.4% Value Score: 1.35 ★
Performance vs. Peers Guide
What it shows: Each horse’s career, last-3-race and last-race performance side by side, against the field average.
What to look for: Horses above the field average whose last race is green (better than their average) and whose trend line rises — improving form. Red last races and falling lines point to declining form.
- Bars (per post)
- Blue = avg career performance • Amber = avg last 3 races • Green = last race (improved vs. avg) • Red = last race (declined vs. avg)
- Trend Line
- Angled line above the bars: rising = improving form • falling = declining form.
- Horizontal Line
- Field average — the mean career performance of all horses in this race.
- Color Circles
- Standard post-position colors below each lane — same as the Total Pace chart.
- Border
- Thicker border = this horse’s post position.
Figure Comparison
What it shows: This horse’s ratings, speed figures and pace figures next to every other horse in the race.
What to look for: Where this horse (the darker column) leads the field or falls short. Strong ratings plus strong recent speed make a contender; recent speed well above career speed suggests improving form.
- Rating
- The three Pick Pony algorithm ratings (Algo 1, Algo 2, Algo 3) that make up the overall PP AI Rating — higher is a stronger contender rating.
- Speed
- Career average speed, recent 3-race average, and last-race speed figure — spot horses in improving or declining form.
- Pace
- Average Early (E1), Mid (E2), and Stretch (LP) pace figures — reveals pace-setters vs. closers vs. all-the-way types.
- This horse
- The horse whose stats card is open is highlighted with a darker column background.
Winning Profiles
What it shows: Each horse’s win rate and in-the-money rate over its last 10 starts, one dot per horse.
What to look for: Dots in the top-right are consistent winners. Top-left horses often finish in the money but rarely win — better for place and show bets or underneath in exotics. Bottom-left horses rarely finish well.
- Axes
- X: Win % from last 10 starts — Y: In-the-money % (top-3 finishes) from last 10 starts.
- Quadrants
- Consistent Winners (top-right): high win & ITM — reliable performers.
Place Threats (top-left): boards often but doesn’t win often — good exacta/trifecta angles.
Streaky (bottom-right): wins occasionally, misses the board often — all-or-nothing.
Developing (bottom-left): still finding form — longshot territory. - Reference Lines
- Dashed lines mark field averages. Dots to the right win more; dots higher board more.
- This horse
- Highlighted with a gold border and larger dot.
AI Model Comparison
What it shows: All AI model scores for every horse in the race, grouped by what each model is trained to find.
What to look for: The horse leading the green winner models is the models’ likely winner. A horse that stands out in the red longshot models but not the green ones is a longshot the models think is underrated.
- Winner Models (green)
- Mod1(W), Mod2(W), and Mod3(W) trained to predict race winners. Higher score = stronger contender.
- Longshot Models (red)
- Mod1-LS, Mod2-LS, and Mod3-LS trained to find high-value longshots. Higher score = stronger longshot candidate.
- Form Model (blue)
- Mod4 sequence model trained on recent form patterns. Higher score = stronger recent form profile.
- This horse
- Highlighted with a darker column background.
Race Pace Simulation Guide
What it shows: A simulated run of today’s race, based on each horse’s running style, post position and the expected pace.
What to look for: Who gets the lead, who gets boxed in, and who is gaining at the finish. Move the track-bias slider to see how the predicted order changes on a speed-favouring or closer-favouring track.
- Slider
- Drag left→right to advance from gate to finish. Drag all the way back to reset the race.
- Predicted Finish Order
- Factors in contested pace burn, each horse’s effort curve (peaked-early vs. peaked-late), and wide trip cost from outside posts. Updated live when Track Bias changes.
- Pace Scenario
- Lone Speed: single E horse likely rates and holds. Contested: two E horses burn each other — closers benefit. Hot Pace: speed meltdown, deep closers thrive. Soft: no early speed, moderate fractions throughout.
- Track Bias
- Slider below canvas. −2 = strong closer/wet bias; +2 = strong speed/rail bias. Recomputes the predicted finish order.
- Boxed Indicator
- Dashed orange ring = horse is surrounded (rival ahead, rival behind, wall outside). In a real race this horse must find a clear path to run.
- Running Styles
- E/EE = early speed (rushes to rail). P = presser (stalks the pace). S = stalker. SS = slow starter / closer.
| Stat | vs. Current Card | vs. All Horses |
|---|---|---|
| Averages
Career-average metrics across all AI race analysis. Performance and pace averages reflect estimated historical performance; trainer and jockey grades score in-the-money percentages. Grading scale: A = elite • B = above average • C = average • D = below average • F = poor • — = no data |
||
| Pick Pony AI Rating | A | B |
| Pace Trip Longshot | — | — |
| Connections Longshot | — | — |
| Situational Longshot | — | — |
| Speed | D | A |
| Early Pace | F | D |
| Mid Pace | F | D |
| Late Pace | A | A |
| Finish Pos | D | D |
| Dirt Speed | D | F |
| Turf Speed | B | A |
| Distance Speed | A | A |
| Trainer Effectiveness | D | B |
| Jockey Effectiveness | B | B |
| 3rd Party Ratings | A | A |
| Recent
Performance analysis from the horse's recent races, weighted to reflect current form. Sprint and Route FPS (Foot Per Second) measure pace efficiency over the horse's recent sprints and routes respectively. Grading scale: A = elite • B = above average • C = average • D = below average • F = poor • — = no data |
||
| Speed | D | A |
| Early Pace | F | D |
| Mid Pace | F | C |
| Late Pace | A | A |
| Sprint FPS | D | D |
| Route FPS | D | D |
| Trainer Effectiveness | D | B |
| Jockey Effectiveness | B | B |
| 3rd Party Ratings | A | A |
| Predictions
AI-generated projections for the upcoming race, derived from prior AI analysis for speed and pace trends, surface and distance suitability, and current conditions. Grading scale: A = elite • B = above average • C = average • D = below average • F = poor • — = no data |
||
| Speed | D | A |
| Early Pace | F | C |
| Mid Pace | F | C |
| Late Pace | C | C |
Chart Guide (2.0.41)
What it shows: This horse’s recent races, one bubble per race, plotted by its AI speed figure against the class par for today’s race (the dashed line).
What to look for: Recent bubbles at or above the dashed line, a trend line angled up, and a narrow shaded band (steady form). Check whether the good runs came on today’s surface and distance.
- Bubbles
- Color = surface: green (turf), brown (dirt), blue (synthetic)
- Top number = finishing position; bottom number in parentheses = starting post position
- Height above line = beaten lengths — closer means a smaller margin
- Border = track conditions: green (FST/GD/FM), yellow (WF/SL/YLD), red (SY/MY/FRZ/SFT/HVY)
- Connecting Line
- Solid = good conditions; dashed = bad conditions
- Line Symbol
- ▲ Triangle = sprint (7f or less); ● Circle = route (more than 7f)
- Days Between Races
- Small number above each bubble (e.g. 19d) = days since the previous race — helps spot freshness, layoffs, and tight scheduling.
- Shaded Band (Bollinger)
- Highlights volatility — a wider band means more variation in recent performance
- Performance Trend
- Straight line showing the overall performance direction — angled up = improving, angled down = declining
- Dashed Reference Line
- AI Opponent = AI analysis class-level par for the race
AI Model History Guide
What it shows: How our AI models rated this horse in each of its recent races, compared with how they rate today’s field (the dashed lines).
What to look for: Lines that are rising and sit above the dashed field averages — the models have liked this horse and still do. Falling lines, or lines below the dashed ones, mean the models are cooling on it.
- Lines
- Each solid line shows this horse’s model score over its last 10 races: blue = Mod1, green = Mod2, amber = Mod3.
- Dashed Lines
- Dashed lines represent the current race’s field average for each model — a score below the dashed line indicates the horse ranked below average in this model’s assessment.
- Higher is Stronger
- All three model scores are 0–100: a higher number means the model rates this horse more favorably among the field.
Mod1(W): 82 (1/8) Mod2(W): 75 (2/8) Mod3(W): 79 (3/8) Mod1-LS: 55 (6/8) Win Prob: 18.4% Value Score: 1.35 ★
Performance vs. Peers Guide
What it shows: Each horse’s career, last-3-race and last-race performance side by side, against the field average.
What to look for: Horses above the field average whose last race is green (better than their average) and whose trend line rises — improving form. Red last races and falling lines point to declining form.
- Bars (per post)
- Blue = avg career performance • Amber = avg last 3 races • Green = last race (improved vs. avg) • Red = last race (declined vs. avg)
- Trend Line
- Angled line above the bars: rising = improving form • falling = declining form.
- Horizontal Line
- Field average — the mean career performance of all horses in this race.
- Color Circles
- Standard post-position colors below each lane — same as the Total Pace chart.
- Border
- Thicker border = this horse’s post position.
Figure Comparison
What it shows: This horse’s ratings, speed figures and pace figures next to every other horse in the race.
What to look for: Where this horse (the darker column) leads the field or falls short. Strong ratings plus strong recent speed make a contender; recent speed well above career speed suggests improving form.
- Rating
- The three Pick Pony algorithm ratings (Algo 1, Algo 2, Algo 3) that make up the overall PP AI Rating — higher is a stronger contender rating.
- Speed
- Career average speed, recent 3-race average, and last-race speed figure — spot horses in improving or declining form.
- Pace
- Average Early (E1), Mid (E2), and Stretch (LP) pace figures — reveals pace-setters vs. closers vs. all-the-way types.
- This horse
- The horse whose stats card is open is highlighted with a darker column background.
Winning Profiles
What it shows: Each horse’s win rate and in-the-money rate over its last 10 starts, one dot per horse.
What to look for: Dots in the top-right are consistent winners. Top-left horses often finish in the money but rarely win — better for place and show bets or underneath in exotics. Bottom-left horses rarely finish well.
- Axes
- X: Win % from last 10 starts — Y: In-the-money % (top-3 finishes) from last 10 starts.
- Quadrants
- Consistent Winners (top-right): high win & ITM — reliable performers.
Place Threats (top-left): boards often but doesn’t win often — good exacta/trifecta angles.
Streaky (bottom-right): wins occasionally, misses the board often — all-or-nothing.
Developing (bottom-left): still finding form — longshot territory. - Reference Lines
- Dashed lines mark field averages. Dots to the right win more; dots higher board more.
- This horse
- Highlighted with a gold border and larger dot.
AI Model Comparison
What it shows: All AI model scores for every horse in the race, grouped by what each model is trained to find.
What to look for: The horse leading the green winner models is the models’ likely winner. A horse that stands out in the red longshot models but not the green ones is a longshot the models think is underrated.
- Winner Models (green)
- Mod1(W), Mod2(W), and Mod3(W) trained to predict race winners. Higher score = stronger contender.
- Longshot Models (red)
- Mod1-LS, Mod2-LS, and Mod3-LS trained to find high-value longshots. Higher score = stronger longshot candidate.
- Form Model (blue)
- Mod4 sequence model trained on recent form patterns. Higher score = stronger recent form profile.
- This horse
- Highlighted with a darker column background.
Race Pace Simulation Guide
What it shows: A simulated run of today’s race, based on each horse’s running style, post position and the expected pace.
What to look for: Who gets the lead, who gets boxed in, and who is gaining at the finish. Move the track-bias slider to see how the predicted order changes on a speed-favouring or closer-favouring track.
- Slider
- Drag left→right to advance from gate to finish. Drag all the way back to reset the race.
- Predicted Finish Order
- Factors in contested pace burn, each horse’s effort curve (peaked-early vs. peaked-late), and wide trip cost from outside posts. Updated live when Track Bias changes.
- Pace Scenario
- Lone Speed: single E horse likely rates and holds. Contested: two E horses burn each other — closers benefit. Hot Pace: speed meltdown, deep closers thrive. Soft: no early speed, moderate fractions throughout.
- Track Bias
- Slider below canvas. −2 = strong closer/wet bias; +2 = strong speed/rail bias. Recomputes the predicted finish order.
- Boxed Indicator
- Dashed orange ring = horse is surrounded (rival ahead, rival behind, wall outside). In a real race this horse must find a clear path to run.
- Running Styles
- E/EE = early speed (rushes to rail). P = presser (stalks the pace). S = stalker. SS = slow starter / closer.
| Stat | vs. Current Card | vs. All Horses |
|---|---|---|
| Averages
Career-average metrics across all AI race analysis. Performance and pace averages reflect estimated historical performance; trainer and jockey grades score in-the-money percentages. Grading scale: A = elite • B = above average • C = average • D = below average • F = poor • — = no data |
||
| Pick Pony AI Rating | C | C |
| Pace Trip Longshot | — | — |
| Connections Longshot | — | — |
| Situational Longshot | — | — |
| Speed | C | A |
| Early Pace | D | C |
| Mid Pace | D | B |
| Late Pace | D | A |
| Finish Pos | D | C |
| Dirt Speed | B | C |
| Turf Speed | A | A |
| Distance Speed | A | A |
| Trainer Effectiveness | B | A |
| Jockey Effectiveness | B | B |
| 3rd Party Ratings | F | A |
| Recent
Performance analysis from the horse's recent races, weighted to reflect current form. Sprint and Route FPS (Foot Per Second) measure pace efficiency over the horse's recent sprints and routes respectively. Grading scale: A = elite • B = above average • C = average • D = below average • F = poor • — = no data |
||
| Speed | F | A |
| Early Pace | B | B |
| Mid Pace | B | A |
| Late Pace | F | B |
| Sprint FPS | B | C |
| Route FPS | C | C |
| Trainer Effectiveness | B | A |
| Jockey Effectiveness | B | B |
| 3rd Party Ratings | F | A |
| Predictions
AI-generated projections for the upcoming race, derived from prior AI analysis for speed and pace trends, surface and distance suitability, and current conditions. Grading scale: A = elite • B = above average • C = average • D = below average • F = poor • — = no data |
||
| Speed | C | A |
| Early Pace | D | C |
| Mid Pace | B | B |
| Late Pace | C | C |
TL;DR
Toggle
Get more in-depth analysis, expert picks, handicapper reports, AI picks, handicapping tools, in-article data tooltips, NO ADVERTISEMENTS, and other membership perks with a Pick Pony subscription!
Don’t forget Pick Pony’s Expert Picks, AI Picks, and Past Performance Sheets/Racing Forms!
The Pick Pony Handicapper's Report is published daily and provides analysis of all races on the card. A Pick Pony analyst prepares the report, so selections may differ from the Pick Pony Expert Picks, which are based on the consensus of all Pick Pony analysts.
Today's 11-race card features two premier stakes events for 3-year-olds on the turf: the $125,000 Tropical Park Oaks (Race 8) and the $125,000 Tropical Park Derby (Race 11). The meet is in full swing, and the jockey and trainer colonies are stacked with elite talent.
Saffie Joseph Jr. enters the day as the trainer to beat, leveraging his massive volume of starters to dominate the standings. He is countered by Todd Pletcher, whose efficiency with 2-year-olds and stakes runners remains the gold standard in Hallandale Beach. On the riding front, Tyler Gaffalione and Javier Castellano are the key veterans to watch, while apprentice Micah Husbands has emerged as a high-percentage “bug” rider offering significant value.
Wagering focus today should be on surface versatility. With races carded on Dirt, Turf, and Synthetic (Tapeta), handicappers must pay close attention to pedigree and past performance on specific surfaces. The Tropical Park Oaks and Derby often serve as launching pads for 4-year-old campaigns, so look for late-blooming sophomores improving their speed figures.
Weather and Track Conditions
Forecast: Hallandale Beach, FL
The forecast for today calls for warm and unsettled conditions, typical of December in South Florida. Expect temperatures in the mid-70s with a mix of clouds and sun. There is a lingering chance of showers which could impact the turf course condition.
Track Surface Analysis:
- Dirt: Fast. The main track has been playing fair, but keep an eye on early speed. During the Championship Meet, the dirt profile often tilts slightly toward horses who can secure tactical position early.
- Turf: Firm (Subject to Change). If rain develops, the course fits the “good” profile well, but significant moisture could force races to the Tapeta. The turf course rails are set at 45 feet, which historically favors horses with inside draws who can save ground.
- Synthetic (Tapeta): Fast. The all-weather surface has been a haven for turf horses when races are washed off. It plays fairly to closers, unlike the dirt, allowing late runners to make an impact if the pace is honest.
Jockey Notes and Insights
Micah Husbands: The apprentice sensation is winning at a remarkable 28% clip. His weight allowance and aggressive riding style make him a dangerous variable, particularly on front-runners. He has live mounts today in Goldinthesky (Race 2) and Municipal (Race 4).
Javier Castellano: The Hall of Famer is the go-to rider for patience on the turf. His pairing with Mark Casse on And One More Time (Race 8) signals a maximum effort.
Tyler Gaffalione: Currently sitting second in the standings, Gaffalione is riding with extreme confidence. He is especially lethal on the turf-to-dirt surface switches and pairs well with Saffie Joseph Jr. on Ramsey Pond (Race 8).
Trainer Notes and Insights
Todd Pletcher: The Pletcher barn is heating up with their 2-year-olds. Jackson Hole (Race 4) and Imperatrice (Race 9) fit the classic Pletcher profile: well-bred, working sharply at Palm Beach Downs, and placed aggressively in maiden special weights.
Saffie Joseph Jr.: The volume king of Gulfstream. He has entries in nearly every race. His ability to win “off the claim” and with horses switching surfaces is unmatched at this oval. Watch for Little Georgie (Race 9) to outperform her odds.
Mark Casse: A major player in the stakes today. His decision to run And One More Time (Race 8) here rather than waiting for a 4-year-old campaign suggests she is training forwardly and ready to fire off the layoff.
Best Wagering Strategies and Value Plays
Value Play of the Day: Race 4 – #1 Eternal Dream. While the Pletcher/Joseph entries will take money, this Matthew Williams trainee draws the rail and may get overlooked. If he breaks cleanly, he could steal it or sit a perfect trip at a price.
Best Bet: Race 8 – #3 And One More Time. A Grade 1 winner facing a field of listed stakes caliber. If she returns anywhere near her 2024 form, she outclasses this field significantly.
Pick 4 Strategy (Races 8-11):
- Leg 1 (R8): 3, 9
- Leg 2 (R9): 1, 2, 5
- Leg 3 (R10): 4, 7
- Leg 4 (R11): 2, 8, 11
- Ticket Cost: Affordable structure focusing on the class dropper in the Oaks.
Race 1
Post Time: 12:20 PM | 5 Furlongs Turf | Maiden Optional Claiming
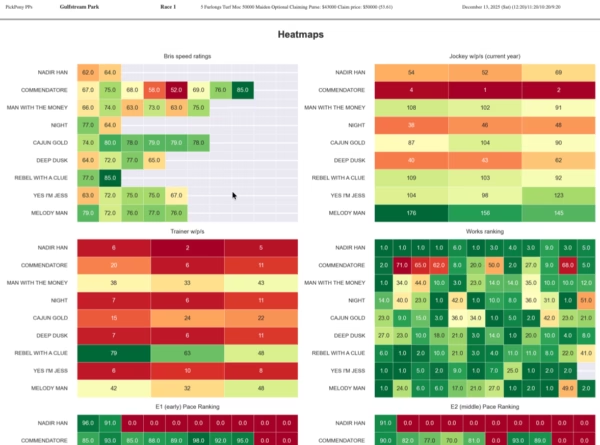
Pace Analysis
A 5-furlong turf sprint with the rails out 45 feet demands early positioning. Nadir Han (1) draws the rail and must send. Man With The Money (3) has shown flashes of speed and should press the issue. Expect a quick opening quarter of :21 and change.
Key Contenders
**#3 Man With The Money (Kelly Breen / Junior Alvarado
Listed as an Also-Eligible in a previous race, he finds a spot here. Breen is excellent at spotting these turf sprinters. Alvarado is a strong finisher who can time the move perfectly if the pace duel heats up.
**#7 Rebel With a Clue (IRE) (Wesleyard / John Velazquez):
Wesley Ward on the turf with a 4-year-old maiden? This screams “ready to win.” The Irish breeding suggests he will appreciate the firm going, and Ward's horses rarely lack gate speed. Velazquez is the perfect pilot to nurse his speed.
Secondary Choices
#1 Nadir Han (Hernan Parra / Yolber Torres):
The rail draw is a double-edged sword at 5 furlongs. If he breaks, he's dangerous. If he hesitates, he's buried. At a price, he is usable in exotics.
Longshots
#9 Melody Man (J. Kent Sweezey / Tyler Gaffalione):
The outside post is tough at this distance, but Gaffalione is a master at working out trips. If the inside speed collapses, he will be the one closing.
Betting Strategy
Focus on the Ward/Velazquez combination.
Selections
Win: Rebel With A Clue (7)
Place: Man With The Money (3)
Show: Melody Man (9)
Race 2
Post Time: 12:49 PM | 1 Mile 70Y Synthetic | Maiden Claiming
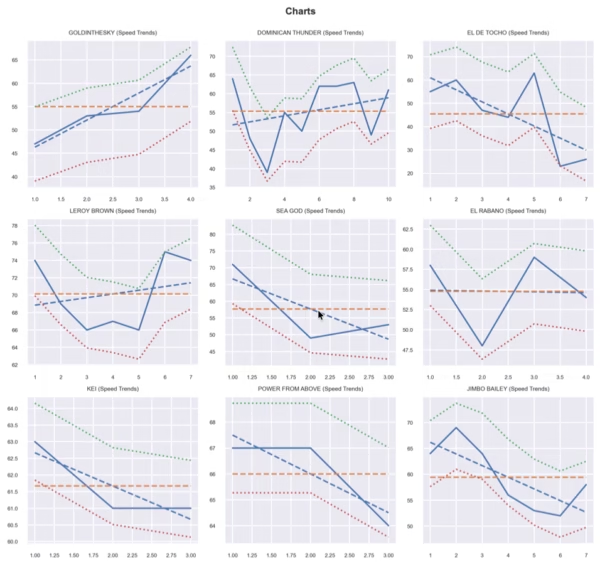
Pace Analysis
Synthetic routes often play slower early. Goldinthesky (1) has the apprentice Husbands and the rail; expect him to try and wire the field. Leroy Brown (4) has tactical speed and should sit just off the flank.
Key Contenders
#1 Goldinthesky (Dalton Lawrence / Micah Husbands):
The apprentice allowance is huge here. Husbands is riding at 28% and this horse fits the “speed of the speed” profile on the Tapeta.
#9 Jimbo Bailey (Bruno Tessore / Edwin Gonzalez):
The veteran in the field (4yo). The wide draw is a concern, but Gonzalez is an aggressive rider. Drops into a winnable spot.
Secondary Choices
#7 Kei (Victor Barboza Jr. / Miguel Vasquez):
Barboza is 20%+ with claimers. Vasquez is a grinder who will keep this horse involved. Consistent underneath play.
Longshots
**#4 Leroy Brown (Kathen O'Connell / Luca Panici):
O'Connell can pop with a price horse. If the 1 gets pressured, Leroy Brown picks up the pieces.
Betting Strategy
Back the apprentice on the speed.
- Win: #1 Goldinthesky
Selections
Win: Goldinthesky (1)
Place: Jimbo Bailey (9)
Show: Kei (7)
Race 3
Post Time: 01:18 PM | 5 Furlongs Synthetic | Claiming
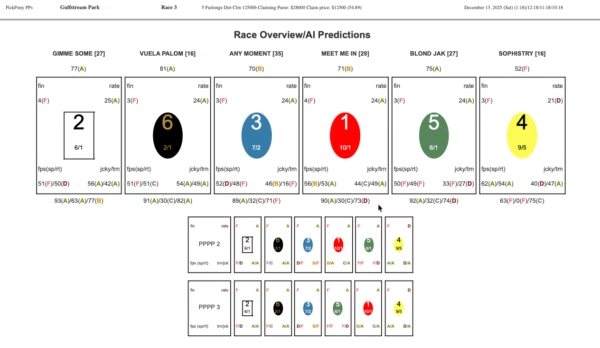
Pace Analysis
Meet Me In The Air (1) has Tyler Gaffalione and the rail. In a 5F sprint, that is often game over. Blond Jak (5) has shown speed and will keep the 1 honest.
Key Contenders
#1 Meet Me In The Air (Eniel Cordero / Tyler Gaffalione):
The clear horse to beat. Gaffalione doesn't take low-level claiming mounts unless they are live. The rail draw on the synthetic is an advantage for a speed horse.
#6 Vuela Paloma (Bobby Dibona / Edgard Zayas):
Re-entered from a previous scratch. Zayas is the King of the Tapeta at Gulfstream. If the 1 falters, this is the winner.
Secondary Choices
#5 Blond Jak (Daniel Hurtak / Horacio Karamanos):
Hurtak is a savvy trainer with these claiming types. Karamanos provides a veteran ride.
Longshots
#2 Gimme Some Luck (Collin Maragh / Rajiv Maragh):
The Maragh family connection. A quirky horse that could wake up on a designated “off” day for the favorites.
Betting Strategy
Cold Double from Race 2 (1) to Race 3 (1).
- Win: #1 Meet Me in the Air
Selections
Win: Meet Me In The Air (1)
Place: Vuela Paloma (6)
Show: Blond Jak (5)
Race 4
Post Time: 01:47 PM | 7 Furlongs Dirt | Maiden Special Weight
Pace Analysis
A competitive 2-year-old sprint. Jackson Hole (7) and Municipal (4) will likely vie for the lead. Eternal Dream (1) is the wildcard from the rail.
Key Contenders
#7 Jackson Hole (Todd Pletcher / John Velazquez):
Pletcher 2-year-olds at 7 furlongs are a 20%+ proposition. The outside draw is perfect—Velazquez can see the break and decide whether to send or stalk. The likely favorite and deserving.
#4 Municipal (Saffie Joseph Jr. / Micah Husbands):
Saffie Joseph plus the hot apprentice. This horse will be bet down. Husbands will likely be aggressive early to clear the inside traffic.
Secondary Choices
**#2 Ace Jack Deuce (KennycPeek / Renzo Rojas):
McPeek's horses often improve with a run or two. At 7 furlongs, his stamina influence kicks in. A strong threat to hit the board.
Longshots
#5 Maykomotion (George Weaver / Tyler Gaffalione):
Weaver is excellent with sprinters. Gaffalione taking the mount is a massive jockey upgrade or signal of intent.
Betting Strategy
Exacta Key Box: 7 with 1, 4, 5.
- Win: #7 Jackson Hole
Selections
Win: Jackson Hole (7)
Place: Municipal (4)
Show: Maykomotion (5)
Race 5
Post Time: 02:17 PM | 1 1/16 Miles Synthetic | Claiming
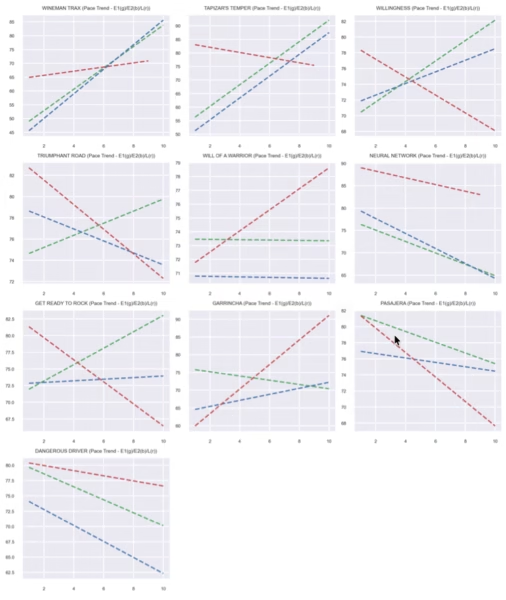
Pace Analysis
A messy claiming route. Will Of A Warrior (5) has Gaffalione and speed. Neural Network (6) will be closing.
Key Contenders
#6 Neural Network (Tareq Moubarak / David Egan):
Drops to a competitive level. Egan is a patient rider who fits the synthetic surface well. If the pace is hot, he wins.
#5 Will Of A Warrior (Georgina Baxter / Tyler Gaffalione):
Baxter sends them ready. Gaffalione is the best finisher here. The horse to catch.
Secondary Choices
#10 Dangerous Driver (Leandro Moreno-Barban / Edwin Gonzalez):
Bad post, good jockey. Gonzalez will have to use him early to get position.
Longshots
#2 Tapizar's Temper (Jane Cibelli / Edgard Zayas):
Cibelli has high percentages off layoffs/freshening. Zayas fits the horse well.
Betting Strategy
- Win: #6 Neural Network
- Exacta: 5, 6 Box
Selections
Win: Neural Network (6)
Place: Will Of A Warrior (5)
Show: Dangerous Driver (10)
Race 6
Post Time: 02:47 PM | 1 Mile Turf | Starter Optional Claiming
Pace Analysis
Live High Live Low (2) has speed. Act A Fool (1) is a classy grinder who can sit close.
Key Contenders
**#1 Act A Fool (Laura Cazes / Joe Bravo):
“Jersey Joe” Bravo on the turf is a legendary angle. This 5-year-old has back class and draws the rail. He saves all the ground and kicks home.
#2 Live High Live Low (George Weaver / Tyler Gaffalione):
The main danger. Weaver/Gaffalione is a top-tier combo. Will try to get the jump on Act a Fool.
Secondary Choices
#7 American Farmer (Sam Wilensky / Edgar Perez):
The 8-year-old veteran. He knows where the wire is. A must-use in vertical wagers.
Longshots
#3 Nantasket Beach (Lauren Robson / John Velazquez):
Velazquez takes the mount on a 6-year-old. Interesting jockey placement suggests the horse is live.
Betting Strategy
- Win: #1 Act a Fool
Selections
Win: Act A Fool (1)
Place: Live High Live Low (2)
Show: Nantasket Beach (3)
Race 7
Post Time: 03:17 PM | 7 Furlongs Dirt | Starter Optional Claiming
Pace Analysis
El Principito (1) and Big Paradise (4) provide the speed. Unclecharliesgift (2) stalks.
Key Contenders
#2 Unclecharliesgift (Nicholas Zito / Nik Juarez):
Nick Zito is a Hall of Famer who still pops with these types. The 5-year-old fits this condition perfectly.
#4 Big Paradise (Laura Cazares / Edgar Perez):
The 3-year-old taking on older horses. Has the upside to improve past the veterans.
Secondary Choices
** El Principito (Gerald Bennett / Jose Ferrer):
Bennett ships in ready. The rail is good for 7F.
Longshots
#6 Freedom Road (Richard Sillaman / Junior Alvarado):
Alvarado is a key jockey for the 7F distance. Can close into a fast pace.
Betting Strategy
- Win: #2 Unclecharliesgift
Selections
Win: Unclecharliesgift (2)
Place: Big Paradise (4)
Show: Freedom Road (6)
Race 8 – $125,000 Tropical Park Oaks
Post Time: 03:47 PM | 1 1/16 Miles Turf | Stakes
Pace Analysis
It Ain't Two (9) has speed, as does Supa Speed (10). The pace should be honest, setting up the closers.
Key Contenders
#3 And One More Time (Mark Casse / Javier Castellano):
The class of the field. A Grade 1 winner (Natalma) returning to restricted company. Castellano fits her closing style perfectly. If she is 80% ready, she wins.
#9 It Ain't Two (GB) (Riley Mott / David Egan):
Coming off a scratch in the Pebbles (G3). Mott has been patient. The Euro-breeding (GB) is lethal on the Gulfstream turf.
Secondary Choices
**#1 Smart Union (HGraham Motion / John Velazquez):
Graham Motion is the master of turf fillies. Velazquez aboard is a massive signal. A dangerous stalker.
#8 Souper Zonda (Mark Casse / Miguel Vasquez):
The “other” Casse. Miguel Vasquez will be aggressive. If the 3 needs a race, the 8 is the backup.
Longshots
#5 Mischief In Motion (Michael Trombetta / Emisael Jaramillo):
Jaramillo on a turf horse means speed. Could steal it if the pace slows down.
Betting Strategy
Trifecta Key: 3 over 1, 8, 9.
Win: #3 And One More Time (Best Bet)
Selections
Win: And One More Time (3)
Place: It Ain't Two (GB) (9)
Show: Smart Union (1)
Race 9
Post Time: 04:17 PM | 1 Mile Dirt | Maiden Special Weight
Pace Analysis
Little Georgie (1) and Imperatrice (2) are the main players. 2-year-old fillies going a mile for the first time often results in a slow pace.
Key Contenders
#2 Imperatrice (Todd Pletcher / John Velazquez):
Pletcher going a route of ground with a 2-year-old maiden is a 25% win move. Velazquez stays put. The logical favorite.
#1 Little Georgie (Saffie Joseph Jr. / Edgard Zayas):
Saffie's horses improve massively stretching out. The rail allows Zayas to save ground.
Secondary Choices
**#5 Betty's Pearl (Brian Lynch / Tyler Gaffalne):
Lynch is having a great meet. Gaffalione is a top choice.
Longshots
#6 Quiddity (Barclay Tagg / Katie Davis):
Tagg is patient. If the Pletcher/Joseph favorites duel, Quiddity picks up the pieces.
Betting Strategy
- Exacta: 2 over 1, 5
Selections
Win: Imperatrice (2)
Place: Little Georgie (1)
Show: Betty's Pearl (5)
Race 10
Post Time: 04:47 PM | 1 1/16 Miles Synthetic | Claiming
Pace Analysis
Sunroof (1) has the rail and speed. Trumpetta (4) will press.
Key Contenders
#4 Trumpetta (Frank Regalbuto / Nik Juarez):
A 3-year-old filly with upside. Juarez rides the synthetic well.
#7 More Than Glory (Amador Sanchez / Edgard Zayas):
The class dropper. Zayas is the right rider to navigate the outside post.
Secondary Choices
**#2 Compass Rises (Angel Rodriguez Junior Alvarado):
Alvarado provides a steady hand on a veteran mare.
Longshots
#6 Play Free Bird (Steve Klesaris / Jorge Ruiz):
Klesaris is a high-percentage trainer. Ruiz is an underrated turf/synthetic rider.
Betting Strategy
- Win: #4 Trumpetta
Selections
Win: Trumpetta (4)
Place: More Than Glory (7)
Show: Compass Rises (2)
Race 11 – $125,000 Tropical Park Derby
Post Time: 05:17 PM | 1 1/16 Miles Turf | Stakes
Pace Analysis
Tank (11) has speed from the outside. Simulate (8) should be forwardly placed.
Key Contenders
#8 Simulate (William Mott / Joe Bravo):
Scratched from the Commonwealth Turf (G3) to run here. Mott places them where they can win. Bravo is excellent in these turf stakes.
#2 Discreet Dancer (Antonio Sano / John Velazquez):
Sano is a giant killer at Gulfstream. Velazquez takes the call, which is significant.
Secondary Choices
#11 Tank (Carlos David / Emisael Jaramillo):
Dangerous speed threat. If Jaramillo clears, he could take them gate to wire.
#3 Tiz Dashing (Barclay Tagg / Javier Castellano):
A closer who needs pace. Castellano will have him flying late.
Longshots
#5 Day And Age (Mark Casse / Edwin Gonzalez):
Casse is dangerous in these spots. Gonzalez is a price jockey who rides hard.
Betting Strategy
Win: #8 Simulate
Exacta Box: 2, 8, 11
Selections
Win: Simulate (8)
Place: Discreet Dancer (2)
Show: Tank (11)

Mod1(W): 82 (1/8) Mod2(W): 75 (2/8) Mod3(W): 79 (3/8) Mod1-LS: 55 (6/8) Win Prob: 18.4% Value Score: 1.35 ★