Chart Guide (2.0.36)
- Bubbles
- Color = surface: green (turf), brown (dirt), blue (synthetic)
- Top number = finishing position; bottom number in parentheses = starting post position
- Height above line = beaten lengths — closer means a smaller margin
- Border = track conditions: green (FST/GD/FM), yellow (WF/SL/YLD), red (SY/MY/FRZ/SFT/HVY)
- Connecting Line
- Solid = good conditions; dashed = bad conditions
- Line Symbol
- ▲ Triangle = sprint (7f or less); ● Circle = route (more than 7f)
- Days Between Races
- Small number above each bubble (e.g. 19d) = days since the previous race — helps spot freshness, layoffs, and tight scheduling.
- Shaded Band (Bollinger)
- Highlights volatility — a wider band means more variation in recent performance
- Performance Trend
- Straight line showing the overall performance direction — angled up = improving, angled down = declining
- Dashed Reference Line
- AI Opponent = AI analysis class-level par for the race
AI Model History Guide
- Lines
- Each solid line shows this horse’s model score over its last 10 races: blue = Mod1, green = Mod2, amber = Mod3.
- Dashed Lines
- Dashed lines represent the current race’s field average for each model — a score below the dashed line indicates the horse ranked below average in this model’s assessment.
- Higher is Stronger
- All three model scores are 0–100: a higher number means the model rates this horse more favorably among the field.
Performance vs. Peers Guide
- Bars (per post)
- Blue = avg career performance • Amber = avg last 3 races • Green = last race (improved vs. avg) • Red = last race (declined vs. avg)
- Trend Line
- Angled line above the bars: rising = improving form • falling = declining form.
- Horizontal Line
- Field average — the mean career performance of all horses in this race.
- Color Circles
- Standard post-position colors below each lane — same as the Total Pace chart.
- Border
- Thicker border = this horse’s post position.
Figure Comparison
- Rating
- The three Pick Pony algorithm ratings (Algo 1, Algo 2, Algo 3) that make up the overall PP AI Rating — higher is a stronger contender rating.
- Speed
- Career average speed, recent 3-race average, and last-race speed figure — spot horses in improving or declining form.
- Pace
- Average Early (E1), Mid (E2), and Stretch (LP) pace figures — reveals pace-setters vs. closers vs. all-the-way types.
- This horse
- The horse whose stats card is open is highlighted with a darker column background.
Winning Profiles
- Axes
- X: Win % from last 10 starts — Y: In-the-money % (top-3 finishes) from last 10 starts.
- Quadrants
- Consistent Winners (top-right): high win & ITM — reliable performers.
Place Threats (top-left): boards often but doesn’t win often — good exacta/trifecta angles.
Streaky (bottom-right): wins occasionally, misses the board often — all-or-nothing.
Developing (bottom-left): still finding form — longshot territory. - Reference Lines
- Dashed lines mark field averages. Dots to the right win more; dots higher board more.
- This horse
- Highlighted with a gold border and larger dot.
AI Model Comparison
- Winner Models (green)
- Mod1(W), Mod2(W), and Mod3(W) trained to predict race winners. Higher score = stronger contender.
- Longshot Models (red)
- Mod1-LS, Mod2-LS, and Mod3-LS trained to find high-value longshots. Higher score = stronger longshot candidate.
- Form Model (blue)
- Mod4 sequence model trained on recent form patterns. Higher score = stronger recent form profile.
- This horse
- Highlighted with a darker column background.
Race Pace Simulation Guide
- Slider
- Drag left→right to advance from gate to finish. Drag all the way back to reset the race.
- Predicted Finish Order
- Factors in contested pace burn, each horse’s effort curve (peaked-early vs. peaked-late), and wide trip cost from outside posts. Updated live when Track Bias changes.
- Pace Scenario
- Lone Speed: single E horse likely rates and holds. Contested: two E horses burn each other — closers benefit. Hot Pace: speed meltdown, deep closers thrive. Soft: no early speed, moderate fractions throughout.
- Track Bias
- Slider below canvas. −2 = strong closer/wet bias; +2 = strong speed/rail bias. Recomputes the predicted finish order.
- Boxed Indicator
- Dashed orange ring = horse is surrounded (rival ahead, rival behind, wall outside). In a real race this horse must find a clear path to run.
- Running Styles
- E/EE = early speed (rushes to rail). P = presser (stalks the pace). S = stalker. SS = slow starter / closer.
| Stat | vs. Current Card | vs. All Horses |
|---|---|---|
| Averages
Career-average metrics across all AI race analysis. Performance and pace averages reflect estimated historical performance; trainer and jockey grades score in-the-money percentages. Grading scale: A = elite • B = above average • C = average • D = below average • F = poor • — = no data |
||
| Pick Pony AI Rating | D | D |
| Pace Trip Longshot | — | — |
| Connections Longshot | — | — |
| Situational Longshot | — | — |
| Speed | F | C |
| Early Pace | D | C |
| Mid Pace | F | C |
| Late Pace | D | A |
| Finish Pos | B | D |
| Dirt Speed | B | C |
| Turf Speed | D | B |
| Distance Speed | D | F |
| Trainer Effectiveness | C | D |
| Jockey Effectiveness | B | B |
| 3rd Party Ratings | F | C |
| Recent
Performance analysis from the horse's recent races, weighted to reflect current form. Sprint and Route FPS (Foot Per Second) measure pace efficiency over the horse's recent sprints and routes respectively. Grading scale: A = elite • B = above average • C = average • D = below average • F = poor • — = no data |
||
| Speed | F | C |
| Early Pace | B | C |
| Mid Pace | F | C |
| Late Pace | D | A |
| Sprint FPS | D | C |
| Route FPS | F | D |
| Trainer Effectiveness | C | D |
| Jockey Effectiveness | B | B |
| 3rd Party Ratings | F | C |
| Predictions
AI-generated projections for the upcoming race, derived from prior AI analysis for speed and pace trends, surface and distance suitability, and current conditions. Grading scale: A = elite • B = above average • C = average • D = below average • F = poor • — = no data |
||
| Speed | F | C |
| Early Pace | F | C |
| Mid Pace | F | C |
| Late Pace | C | C |
Chart Guide (2.0.36)
- Bubbles
- Color = surface: green (turf), brown (dirt), blue (synthetic)
- Top number = finishing position; bottom number in parentheses = starting post position
- Height above line = beaten lengths — closer means a smaller margin
- Border = track conditions: green (FST/GD/FM), yellow (WF/SL/YLD), red (SY/MY/FRZ/SFT/HVY)
- Connecting Line
- Solid = good conditions; dashed = bad conditions
- Line Symbol
- ▲ Triangle = sprint (7f or less); ● Circle = route (more than 7f)
- Days Between Races
- Small number above each bubble (e.g. 19d) = days since the previous race — helps spot freshness, layoffs, and tight scheduling.
- Shaded Band (Bollinger)
- Highlights volatility — a wider band means more variation in recent performance
- Performance Trend
- Straight line showing the overall performance direction — angled up = improving, angled down = declining
- Dashed Reference Line
- AI Opponent = AI analysis class-level par for the race
AI Model History Guide
- Lines
- Each solid line shows this horse’s model score over its last 10 races: blue = Mod1, green = Mod2, amber = Mod3.
- Dashed Lines
- Dashed lines represent the current race’s field average for each model — a score below the dashed line indicates the horse ranked below average in this model’s assessment.
- Higher is Stronger
- All three model scores are 0–100: a higher number means the model rates this horse more favorably among the field.
Mod1(W): 82 (1/8) Mod2(W): 75 (2/8) Mod3(W): 79 (3/8) Mod1-LS: 55 (6/8) Win Prob: 18.4% Value Score: 1.35 ★
Performance vs. Peers Guide
- Bars (per post)
- Blue = avg career performance • Amber = avg last 3 races • Green = last race (improved vs. avg) • Red = last race (declined vs. avg)
- Trend Line
- Angled line above the bars: rising = improving form • falling = declining form.
- Horizontal Line
- Field average — the mean career performance of all horses in this race.
- Color Circles
- Standard post-position colors below each lane — same as the Total Pace chart.
- Border
- Thicker border = this horse’s post position.
Figure Comparison
- Rating
- The three Pick Pony algorithm ratings (Algo 1, Algo 2, Algo 3) that make up the overall PP AI Rating — higher is a stronger contender rating.
- Speed
- Career average speed, recent 3-race average, and last-race speed figure — spot horses in improving or declining form.
- Pace
- Average Early (E1), Mid (E2), and Stretch (LP) pace figures — reveals pace-setters vs. closers vs. all-the-way types.
- This horse
- The horse whose stats card is open is highlighted with a darker column background.
Winning Profiles
- Axes
- X: Win % from last 10 starts — Y: In-the-money % (top-3 finishes) from last 10 starts.
- Quadrants
- Consistent Winners (top-right): high win & ITM — reliable performers.
Place Threats (top-left): boards often but doesn’t win often — good exacta/trifecta angles.
Streaky (bottom-right): wins occasionally, misses the board often — all-or-nothing.
Developing (bottom-left): still finding form — longshot territory. - Reference Lines
- Dashed lines mark field averages. Dots to the right win more; dots higher board more.
- This horse
- Highlighted with a gold border and larger dot.
AI Model Comparison
- Winner Models (green)
- Mod1(W), Mod2(W), and Mod3(W) trained to predict race winners. Higher score = stronger contender.
- Longshot Models (red)
- Mod1-LS, Mod2-LS, and Mod3-LS trained to find high-value longshots. Higher score = stronger longshot candidate.
- Form Model (blue)
- Mod4 sequence model trained on recent form patterns. Higher score = stronger recent form profile.
- This horse
- Highlighted with a darker column background.
Race Pace Simulation Guide
- Slider
- Drag left→right to advance from gate to finish. Drag all the way back to reset the race.
- Predicted Finish Order
- Factors in contested pace burn, each horse’s effort curve (peaked-early vs. peaked-late), and wide trip cost from outside posts. Updated live when Track Bias changes.
- Pace Scenario
- Lone Speed: single E horse likely rates and holds. Contested: two E horses burn each other — closers benefit. Hot Pace: speed meltdown, deep closers thrive. Soft: no early speed, moderate fractions throughout.
- Track Bias
- Slider below canvas. −2 = strong closer/wet bias; +2 = strong speed/rail bias. Recomputes the predicted finish order.
- Boxed Indicator
- Dashed orange ring = horse is surrounded (rival ahead, rival behind, wall outside). In a real race this horse must find a clear path to run.
- Running Styles
- E/EE = early speed (rushes to rail). P = presser (stalks the pace). S = stalker. SS = slow starter / closer.
| Stat | vs. Current Card | vs. All Horses |
|---|---|---|
| Averages
Career-average metrics across all AI race analysis. Performance and pace averages reflect estimated historical performance; trainer and jockey grades score in-the-money percentages. Grading scale: A = elite • B = above average • C = average • D = below average • F = poor • — = no data |
||
| Pick Pony AI Rating | A | A |
| Pace Trip Longshot | — | — |
| Connections Longshot | — | — |
| Situational Longshot | — | — |
| Speed | A | A |
| Early Pace | A | A |
| Mid Pace | A | A |
| Late Pace | D | A |
| Finish Pos | A | D |
| Dirt Speed | F | F |
| Turf Speed | A | A |
| Distance Speed | A | A |
| Trainer Effectiveness | B | C |
| Jockey Effectiveness | A | A |
| 3rd Party Ratings | B | A |
| Recent
Performance analysis from the horse's recent races, weighted to reflect current form. Sprint and Route FPS (Foot Per Second) measure pace efficiency over the horse's recent sprints and routes respectively. Grading scale: A = elite • B = above average • C = average • D = below average • F = poor • — = no data |
||
| Speed | A | A |
| Early Pace | A | A |
| Mid Pace | A | A |
| Late Pace | B | A |
| Sprint FPS | C | C |
| Route FPS | B | B |
| Trainer Effectiveness | B | C |
| Jockey Effectiveness | A | A |
| 3rd Party Ratings | B | A |
| Predictions
AI-generated projections for the upcoming race, derived from prior AI analysis for speed and pace trends, surface and distance suitability, and current conditions. Grading scale: A = elite • B = above average • C = average • D = below average • F = poor • — = no data |
||
| Speed | A | A |
| Early Pace | A | A |
| Mid Pace | A | A |
| Late Pace | C | C |
Chart Guide (2.0.36)
- Bubbles
- Color = surface: green (turf), brown (dirt), blue (synthetic)
- Top number = finishing position; bottom number in parentheses = starting post position
- Height above line = beaten lengths — closer means a smaller margin
- Border = track conditions: green (FST/GD/FM), yellow (WF/SL/YLD), red (SY/MY/FRZ/SFT/HVY)
- Connecting Line
- Solid = good conditions; dashed = bad conditions
- Line Symbol
- ▲ Triangle = sprint (7f or less); ● Circle = route (more than 7f)
- Days Between Races
- Small number above each bubble (e.g. 19d) = days since the previous race — helps spot freshness, layoffs, and tight scheduling.
- Shaded Band (Bollinger)
- Highlights volatility — a wider band means more variation in recent performance
- Performance Trend
- Straight line showing the overall performance direction — angled up = improving, angled down = declining
- Dashed Reference Line
- AI Opponent = AI analysis class-level par for the race
AI Model History Guide
- Lines
- Each solid line shows this horse’s model score over its last 10 races: blue = Mod1, green = Mod2, amber = Mod3.
- Dashed Lines
- Dashed lines represent the current race’s field average for each model — a score below the dashed line indicates the horse ranked below average in this model’s assessment.
- Higher is Stronger
- All three model scores are 0–100: a higher number means the model rates this horse more favorably among the field.
Mod1(W): 82 (1/8) Mod2(W): 75 (2/8) Mod3(W): 79 (3/8) Mod1-LS: 55 (6/8) Win Prob: 18.4% Value Score: 1.35 ★
Performance vs. Peers Guide
- Bars (per post)
- Blue = avg career performance • Amber = avg last 3 races • Green = last race (improved vs. avg) • Red = last race (declined vs. avg)
- Trend Line
- Angled line above the bars: rising = improving form • falling = declining form.
- Horizontal Line
- Field average — the mean career performance of all horses in this race.
- Color Circles
- Standard post-position colors below each lane — same as the Total Pace chart.
- Border
- Thicker border = this horse’s post position.
Figure Comparison
- Rating
- The three Pick Pony algorithm ratings (Algo 1, Algo 2, Algo 3) that make up the overall PP AI Rating — higher is a stronger contender rating.
- Speed
- Career average speed, recent 3-race average, and last-race speed figure — spot horses in improving or declining form.
- Pace
- Average Early (E1), Mid (E2), and Stretch (LP) pace figures — reveals pace-setters vs. closers vs. all-the-way types.
- This horse
- The horse whose stats card is open is highlighted with a darker column background.
Winning Profiles
- Axes
- X: Win % from last 10 starts — Y: In-the-money % (top-3 finishes) from last 10 starts.
- Quadrants
- Consistent Winners (top-right): high win & ITM — reliable performers.
Place Threats (top-left): boards often but doesn’t win often — good exacta/trifecta angles.
Streaky (bottom-right): wins occasionally, misses the board often — all-or-nothing.
Developing (bottom-left): still finding form — longshot territory. - Reference Lines
- Dashed lines mark field averages. Dots to the right win more; dots higher board more.
- This horse
- Highlighted with a gold border and larger dot.
AI Model Comparison
- Winner Models (green)
- Mod1(W), Mod2(W), and Mod3(W) trained to predict race winners. Higher score = stronger contender.
- Longshot Models (red)
- Mod1-LS, Mod2-LS, and Mod3-LS trained to find high-value longshots. Higher score = stronger longshot candidate.
- Form Model (blue)
- Mod4 sequence model trained on recent form patterns. Higher score = stronger recent form profile.
- This horse
- Highlighted with a darker column background.
Race Pace Simulation Guide
- Slider
- Drag left→right to advance from gate to finish. Drag all the way back to reset the race.
- Predicted Finish Order
- Factors in contested pace burn, each horse’s effort curve (peaked-early vs. peaked-late), and wide trip cost from outside posts. Updated live when Track Bias changes.
- Pace Scenario
- Lone Speed: single E horse likely rates and holds. Contested: two E horses burn each other — closers benefit. Hot Pace: speed meltdown, deep closers thrive. Soft: no early speed, moderate fractions throughout.
- Track Bias
- Slider below canvas. −2 = strong closer/wet bias; +2 = strong speed/rail bias. Recomputes the predicted finish order.
- Boxed Indicator
- Dashed orange ring = horse is surrounded (rival ahead, rival behind, wall outside). In a real race this horse must find a clear path to run.
- Running Styles
- E/EE = early speed (rushes to rail). P = presser (stalks the pace). S = stalker. SS = slow starter / closer.
| Stat | vs. Current Card | vs. All Horses |
|---|---|---|
| Averages
Career-average metrics across all AI race analysis. Performance and pace averages reflect estimated historical performance; trainer and jockey grades score in-the-money percentages. Grading scale: A = elite • B = above average • C = average • D = below average • F = poor • — = no data |
||
| Pick Pony AI Rating | C | C |
| Pace Trip Longshot | — | — |
| Connections Longshot | — | — |
| Situational Longshot | — | — |
| Speed | D | B |
| Early Pace | A | A |
| Mid Pace | D | B |
| Late Pace | F | B |
| Finish Pos | D | F |
| Dirt Speed | D | D |
| Turf Speed | C | A |
| Distance Speed | D | F |
| Trainer Effectiveness | A | B |
| Jockey Effectiveness | A | A |
| 3rd Party Ratings | A | A |
| Recent
Performance analysis from the horse's recent races, weighted to reflect current form. Sprint and Route FPS (Foot Per Second) measure pace efficiency over the horse's recent sprints and routes respectively. Grading scale: A = elite • B = above average • C = average • D = below average • F = poor • — = no data |
||
| Speed | C | B |
| Early Pace | A | B |
| Mid Pace | B | B |
| Late Pace | F | B |
| Sprint FPS | A | B |
| Route FPS | A | B |
| Trainer Effectiveness | A | B |
| Jockey Effectiveness | A | A |
| 3rd Party Ratings | A | A |
| Predictions
AI-generated projections for the upcoming race, derived from prior AI analysis for speed and pace trends, surface and distance suitability, and current conditions. Grading scale: A = elite • B = above average • C = average • D = below average • F = poor • — = no data |
||
| Speed | D | B |
| Early Pace | A | A |
| Mid Pace | D | B |
| Late Pace | C | C |
Chart Guide (2.0.36)
- Bubbles
- Color = surface: green (turf), brown (dirt), blue (synthetic)
- Top number = finishing position; bottom number in parentheses = starting post position
- Height above line = beaten lengths — closer means a smaller margin
- Border = track conditions: green (FST/GD/FM), yellow (WF/SL/YLD), red (SY/MY/FRZ/SFT/HVY)
- Connecting Line
- Solid = good conditions; dashed = bad conditions
- Line Symbol
- ▲ Triangle = sprint (7f or less); ● Circle = route (more than 7f)
- Days Between Races
- Small number above each bubble (e.g. 19d) = days since the previous race — helps spot freshness, layoffs, and tight scheduling.
- Shaded Band (Bollinger)
- Highlights volatility — a wider band means more variation in recent performance
- Performance Trend
- Straight line showing the overall performance direction — angled up = improving, angled down = declining
- Dashed Reference Line
- AI Opponent = AI analysis class-level par for the race
AI Model History Guide
- Lines
- Each solid line shows this horse’s model score over its last 10 races: blue = Mod1, green = Mod2, amber = Mod3.
- Dashed Lines
- Dashed lines represent the current race’s field average for each model — a score below the dashed line indicates the horse ranked below average in this model’s assessment.
- Higher is Stronger
- All three model scores are 0–100: a higher number means the model rates this horse more favorably among the field.
Mod1(W): 82 (1/8) Mod2(W): 75 (2/8) Mod3(W): 79 (3/8) Mod1-LS: 55 (6/8) Win Prob: 18.4% Value Score: 1.35 ★
Performance vs. Peers Guide
- Bars (per post)
- Blue = avg career performance • Amber = avg last 3 races • Green = last race (improved vs. avg) • Red = last race (declined vs. avg)
- Trend Line
- Angled line above the bars: rising = improving form • falling = declining form.
- Horizontal Line
- Field average — the mean career performance of all horses in this race.
- Color Circles
- Standard post-position colors below each lane — same as the Total Pace chart.
- Border
- Thicker border = this horse’s post position.
Figure Comparison
- Rating
- The three Pick Pony algorithm ratings (Algo 1, Algo 2, Algo 3) that make up the overall PP AI Rating — higher is a stronger contender rating.
- Speed
- Career average speed, recent 3-race average, and last-race speed figure — spot horses in improving or declining form.
- Pace
- Average Early (E1), Mid (E2), and Stretch (LP) pace figures — reveals pace-setters vs. closers vs. all-the-way types.
- This horse
- The horse whose stats card is open is highlighted with a darker column background.
Winning Profiles
- Axes
- X: Win % from last 10 starts — Y: In-the-money % (top-3 finishes) from last 10 starts.
- Quadrants
- Consistent Winners (top-right): high win & ITM — reliable performers.
Place Threats (top-left): boards often but doesn’t win often — good exacta/trifecta angles.
Streaky (bottom-right): wins occasionally, misses the board often — all-or-nothing.
Developing (bottom-left): still finding form — longshot territory. - Reference Lines
- Dashed lines mark field averages. Dots to the right win more; dots higher board more.
- This horse
- Highlighted with a gold border and larger dot.
AI Model Comparison
- Winner Models (green)
- Mod1(W), Mod2(W), and Mod3(W) trained to predict race winners. Higher score = stronger contender.
- Longshot Models (red)
- Mod1-LS, Mod2-LS, and Mod3-LS trained to find high-value longshots. Higher score = stronger longshot candidate.
- Form Model (blue)
- Mod4 sequence model trained on recent form patterns. Higher score = stronger recent form profile.
- This horse
- Highlighted with a darker column background.
Race Pace Simulation Guide
- Slider
- Drag left→right to advance from gate to finish. Drag all the way back to reset the race.
- Predicted Finish Order
- Factors in contested pace burn, each horse’s effort curve (peaked-early vs. peaked-late), and wide trip cost from outside posts. Updated live when Track Bias changes.
- Pace Scenario
- Lone Speed: single E horse likely rates and holds. Contested: two E horses burn each other — closers benefit. Hot Pace: speed meltdown, deep closers thrive. Soft: no early speed, moderate fractions throughout.
- Track Bias
- Slider below canvas. −2 = strong closer/wet bias; +2 = strong speed/rail bias. Recomputes the predicted finish order.
- Boxed Indicator
- Dashed orange ring = horse is surrounded (rival ahead, rival behind, wall outside). In a real race this horse must find a clear path to run.
- Running Styles
- E/EE = early speed (rushes to rail). P = presser (stalks the pace). S = stalker. SS = slow starter / closer.
| Stat | vs. Current Card | vs. All Horses |
|---|---|---|
| Averages
Career-average metrics across all AI race analysis. Performance and pace averages reflect estimated historical performance; trainer and jockey grades score in-the-money percentages. Grading scale: A = elite • B = above average • C = average • D = below average • F = poor • — = no data |
||
| Pick Pony AI Rating | F | D |
| Pace Trip Longshot | — | — |
| Connections Longshot | — | — |
| Situational Longshot | — | — |
| Speed | D | B |
| Early Pace | F | C |
| Mid Pace | C | B |
| Late Pace | B | A |
| Finish Pos | D | F |
| Dirt Speed | C | C |
| Turf Speed | A | A |
| Distance Speed | C | C |
| Trainer Effectiveness | D | D |
| Jockey Effectiveness | F | D |
| 3rd Party Ratings | D | C |
| Recent
Performance analysis from the horse's recent races, weighted to reflect current form. Sprint and Route FPS (Foot Per Second) measure pace efficiency over the horse's recent sprints and routes respectively. Grading scale: A = elite • B = above average • C = average • D = below average • F = poor • — = no data |
||
| Speed | D | B |
| Early Pace | D | C |
| Mid Pace | B | B |
| Late Pace | D | B |
| Sprint FPS | F | D |
| Route FPS | D | C |
| Trainer Effectiveness | D | D |
| Jockey Effectiveness | F | D |
| 3rd Party Ratings | D | C |
| Predictions
AI-generated projections for the upcoming race, derived from prior AI analysis for speed and pace trends, surface and distance suitability, and current conditions. Grading scale: A = elite • B = above average • C = average • D = below average • F = poor • — = no data |
||
| Speed | D | B |
| Early Pace | D | C |
| Mid Pace | C | B |
| Late Pace | C | C |
Chart Guide (2.0.36)
- Bubbles
- Color = surface: green (turf), brown (dirt), blue (synthetic)
- Top number = finishing position; bottom number in parentheses = starting post position
- Height above line = beaten lengths — closer means a smaller margin
- Border = track conditions: green (FST/GD/FM), yellow (WF/SL/YLD), red (SY/MY/FRZ/SFT/HVY)
- Connecting Line
- Solid = good conditions; dashed = bad conditions
- Line Symbol
- ▲ Triangle = sprint (7f or less); ● Circle = route (more than 7f)
- Days Between Races
- Small number above each bubble (e.g. 19d) = days since the previous race — helps spot freshness, layoffs, and tight scheduling.
- Shaded Band (Bollinger)
- Highlights volatility — a wider band means more variation in recent performance
- Performance Trend
- Straight line showing the overall performance direction — angled up = improving, angled down = declining
- Dashed Reference Line
- AI Opponent = AI analysis class-level par for the race
AI Model History Guide
- Lines
- Each solid line shows this horse’s model score over its last 10 races: blue = Mod1, green = Mod2, amber = Mod3.
- Dashed Lines
- Dashed lines represent the current race’s field average for each model — a score below the dashed line indicates the horse ranked below average in this model’s assessment.
- Higher is Stronger
- All three model scores are 0–100: a higher number means the model rates this horse more favorably among the field.
Mod1(W): 82 (1/8) Mod2(W): 75 (2/8) Mod3(W): 79 (3/8) Mod1-LS: 55 (6/8) Win Prob: 18.4% Value Score: 1.35 ★
Performance vs. Peers Guide
- Bars (per post)
- Blue = avg career performance • Amber = avg last 3 races • Green = last race (improved vs. avg) • Red = last race (declined vs. avg)
- Trend Line
- Angled line above the bars: rising = improving form • falling = declining form.
- Horizontal Line
- Field average — the mean career performance of all horses in this race.
- Color Circles
- Standard post-position colors below each lane — same as the Total Pace chart.
- Border
- Thicker border = this horse’s post position.
Figure Comparison
- Rating
- The three Pick Pony algorithm ratings (Algo 1, Algo 2, Algo 3) that make up the overall PP AI Rating — higher is a stronger contender rating.
- Speed
- Career average speed, recent 3-race average, and last-race speed figure — spot horses in improving or declining form.
- Pace
- Average Early (E1), Mid (E2), and Stretch (LP) pace figures — reveals pace-setters vs. closers vs. all-the-way types.
- This horse
- The horse whose stats card is open is highlighted with a darker column background.
Winning Profiles
- Axes
- X: Win % from last 10 starts — Y: In-the-money % (top-3 finishes) from last 10 starts.
- Quadrants
- Consistent Winners (top-right): high win & ITM — reliable performers.
Place Threats (top-left): boards often but doesn’t win often — good exacta/trifecta angles.
Streaky (bottom-right): wins occasionally, misses the board often — all-or-nothing.
Developing (bottom-left): still finding form — longshot territory. - Reference Lines
- Dashed lines mark field averages. Dots to the right win more; dots higher board more.
- This horse
- Highlighted with a gold border and larger dot.
AI Model Comparison
- Winner Models (green)
- Mod1(W), Mod2(W), and Mod3(W) trained to predict race winners. Higher score = stronger contender.
- Longshot Models (red)
- Mod1-LS, Mod2-LS, and Mod3-LS trained to find high-value longshots. Higher score = stronger longshot candidate.
- Form Model (blue)
- Mod4 sequence model trained on recent form patterns. Higher score = stronger recent form profile.
- This horse
- Highlighted with a darker column background.
Race Pace Simulation Guide
- Slider
- Drag left→right to advance from gate to finish. Drag all the way back to reset the race.
- Predicted Finish Order
- Factors in contested pace burn, each horse’s effort curve (peaked-early vs. peaked-late), and wide trip cost from outside posts. Updated live when Track Bias changes.
- Pace Scenario
- Lone Speed: single E horse likely rates and holds. Contested: two E horses burn each other — closers benefit. Hot Pace: speed meltdown, deep closers thrive. Soft: no early speed, moderate fractions throughout.
- Track Bias
- Slider below canvas. −2 = strong closer/wet bias; +2 = strong speed/rail bias. Recomputes the predicted finish order.
- Boxed Indicator
- Dashed orange ring = horse is surrounded (rival ahead, rival behind, wall outside). In a real race this horse must find a clear path to run.
- Running Styles
- E/EE = early speed (rushes to rail). P = presser (stalks the pace). S = stalker. SS = slow starter / closer.
| Stat | vs. Current Card | vs. All Horses |
|---|---|---|
| Averages
Career-average metrics across all AI race analysis. Performance and pace averages reflect estimated historical performance; trainer and jockey grades score in-the-money percentages. Grading scale: A = elite • B = above average • C = average • D = below average • F = poor • — = no data |
||
| Pick Pony AI Rating | B | B |
| Pace Trip Longshot | — | — |
| Connections Longshot | — | — |
| Situational Longshot | — | — |
| Speed | A | A |
| Early Pace | D | C |
| Mid Pace | D | B |
| Late Pace | A | A |
| Finish Pos | A | C |
| Dirt Speed | A | A |
| Turf Speed | F | D |
| Distance Speed | D | F |
| Trainer Effectiveness | A | A |
| Jockey Effectiveness | B | C |
| 3rd Party Ratings | B | A |
| Recent
Performance analysis from the horse's recent races, weighted to reflect current form. Sprint and Route FPS (Foot Per Second) measure pace efficiency over the horse's recent sprints and routes respectively. Grading scale: A = elite • B = above average • C = average • D = below average • F = poor • — = no data |
||
| Speed | A | A |
| Early Pace | C | C |
| Mid Pace | A | B |
| Late Pace | A | A |
| Sprint FPS | A | B |
| Route FPS | A | A |
| Trainer Effectiveness | A | A |
| Jockey Effectiveness | B | C |
| 3rd Party Ratings | B | A |
| Predictions
AI-generated projections for the upcoming race, derived from prior AI analysis for speed and pace trends, surface and distance suitability, and current conditions. Grading scale: A = elite • B = above average • C = average • D = below average • F = poor • — = no data |
||
| Speed | A | A |
| Early Pace | D | C |
| Mid Pace | B | B |
| Late Pace | C | C |
Chart Guide (2.0.36)
- Bubbles
- Color = surface: green (turf), brown (dirt), blue (synthetic)
- Top number = finishing position; bottom number in parentheses = starting post position
- Height above line = beaten lengths — closer means a smaller margin
- Border = track conditions: green (FST/GD/FM), yellow (WF/SL/YLD), red (SY/MY/FRZ/SFT/HVY)
- Connecting Line
- Solid = good conditions; dashed = bad conditions
- Line Symbol
- ▲ Triangle = sprint (7f or less); ● Circle = route (more than 7f)
- Days Between Races
- Small number above each bubble (e.g. 19d) = days since the previous race — helps spot freshness, layoffs, and tight scheduling.
- Shaded Band (Bollinger)
- Highlights volatility — a wider band means more variation in recent performance
- Performance Trend
- Straight line showing the overall performance direction — angled up = improving, angled down = declining
- Dashed Reference Line
- AI Opponent = AI analysis class-level par for the race
AI Model History Guide
- Lines
- Each solid line shows this horse’s model score over its last 10 races: blue = Mod1, green = Mod2, amber = Mod3.
- Dashed Lines
- Dashed lines represent the current race’s field average for each model — a score below the dashed line indicates the horse ranked below average in this model’s assessment.
- Higher is Stronger
- All three model scores are 0–100: a higher number means the model rates this horse more favorably among the field.
Mod1(W): 82 (1/8) Mod2(W): 75 (2/8) Mod3(W): 79 (3/8) Mod1-LS: 55 (6/8) Win Prob: 18.4% Value Score: 1.35 ★
Performance vs. Peers Guide
- Bars (per post)
- Blue = avg career performance • Amber = avg last 3 races • Green = last race (improved vs. avg) • Red = last race (declined vs. avg)
- Trend Line
- Angled line above the bars: rising = improving form • falling = declining form.
- Horizontal Line
- Field average — the mean career performance of all horses in this race.
- Color Circles
- Standard post-position colors below each lane — same as the Total Pace chart.
- Border
- Thicker border = this horse’s post position.
Figure Comparison
- Rating
- The three Pick Pony algorithm ratings (Algo 1, Algo 2, Algo 3) that make up the overall PP AI Rating — higher is a stronger contender rating.
- Speed
- Career average speed, recent 3-race average, and last-race speed figure — spot horses in improving or declining form.
- Pace
- Average Early (E1), Mid (E2), and Stretch (LP) pace figures — reveals pace-setters vs. closers vs. all-the-way types.
- This horse
- The horse whose stats card is open is highlighted with a darker column background.
Winning Profiles
- Axes
- X: Win % from last 10 starts — Y: In-the-money % (top-3 finishes) from last 10 starts.
- Quadrants
- Consistent Winners (top-right): high win & ITM — reliable performers.
Place Threats (top-left): boards often but doesn’t win often — good exacta/trifecta angles.
Streaky (bottom-right): wins occasionally, misses the board often — all-or-nothing.
Developing (bottom-left): still finding form — longshot territory. - Reference Lines
- Dashed lines mark field averages. Dots to the right win more; dots higher board more.
- This horse
- Highlighted with a gold border and larger dot.
AI Model Comparison
- Winner Models (green)
- Mod1(W), Mod2(W), and Mod3(W) trained to predict race winners. Higher score = stronger contender.
- Longshot Models (red)
- Mod1-LS, Mod2-LS, and Mod3-LS trained to find high-value longshots. Higher score = stronger longshot candidate.
- Form Model (blue)
- Mod4 sequence model trained on recent form patterns. Higher score = stronger recent form profile.
- This horse
- Highlighted with a darker column background.
Race Pace Simulation Guide
- Slider
- Drag left→right to advance from gate to finish. Drag all the way back to reset the race.
- Predicted Finish Order
- Factors in contested pace burn, each horse’s effort curve (peaked-early vs. peaked-late), and wide trip cost from outside posts. Updated live when Track Bias changes.
- Pace Scenario
- Lone Speed: single E horse likely rates and holds. Contested: two E horses burn each other — closers benefit. Hot Pace: speed meltdown, deep closers thrive. Soft: no early speed, moderate fractions throughout.
- Track Bias
- Slider below canvas. −2 = strong closer/wet bias; +2 = strong speed/rail bias. Recomputes the predicted finish order.
- Boxed Indicator
- Dashed orange ring = horse is surrounded (rival ahead, rival behind, wall outside). In a real race this horse must find a clear path to run.
- Running Styles
- E/EE = early speed (rushes to rail). P = presser (stalks the pace). S = stalker. SS = slow starter / closer.
| Stat | vs. Current Card | vs. All Horses |
|---|---|---|
| Averages
Career-average metrics across all AI race analysis. Performance and pace averages reflect estimated historical performance; trainer and jockey grades score in-the-money percentages. Grading scale: A = elite • B = above average • C = average • D = below average • F = poor • — = no data |
||
| Pick Pony AI Rating | D | C |
| Pace Trip Longshot | — | — |
| Connections Longshot | — | — |
| Situational Longshot | — | — |
| Speed | B | A |
| Early Pace | A | B |
| Mid Pace | A | A |
| Late Pace | B | A |
| Finish Pos | B | D |
| Dirt Speed | A | A |
| Turf Speed | A | A |
| Distance Speed | A | A |
| Trainer Effectiveness | B | B |
| Jockey Effectiveness | C | C |
| 3rd Party Ratings | D | A |
| Recent
Performance analysis from the horse's recent races, weighted to reflect current form. Sprint and Route FPS (Foot Per Second) measure pace efficiency over the horse's recent sprints and routes respectively. Grading scale: A = elite • B = above average • C = average • D = below average • F = poor • — = no data |
||
| Speed | D | A |
| Early Pace | A | C |
| Mid Pace | A | A |
| Late Pace | D | B |
| Sprint FPS | A | B |
| Route FPS | A | B |
| Trainer Effectiveness | B | B |
| Jockey Effectiveness | C | C |
| 3rd Party Ratings | D | A |
| Predictions
AI-generated projections for the upcoming race, derived from prior AI analysis for speed and pace trends, surface and distance suitability, and current conditions. Grading scale: A = elite • B = above average • C = average • D = below average • F = poor • — = no data |
||
| Speed | B | A |
| Early Pace | A | C |
| Mid Pace | A | B |
| Late Pace | B | C |
Chart Guide (2.0.36)
- Bubbles
- Color = surface: green (turf), brown (dirt), blue (synthetic)
- Top number = finishing position; bottom number in parentheses = starting post position
- Height above line = beaten lengths — closer means a smaller margin
- Border = track conditions: green (FST/GD/FM), yellow (WF/SL/YLD), red (SY/MY/FRZ/SFT/HVY)
- Connecting Line
- Solid = good conditions; dashed = bad conditions
- Line Symbol
- ▲ Triangle = sprint (7f or less); ● Circle = route (more than 7f)
- Days Between Races
- Small number above each bubble (e.g. 19d) = days since the previous race — helps spot freshness, layoffs, and tight scheduling.
- Shaded Band (Bollinger)
- Highlights volatility — a wider band means more variation in recent performance
- Performance Trend
- Straight line showing the overall performance direction — angled up = improving, angled down = declining
- Dashed Reference Line
- AI Opponent = AI analysis class-level par for the race
AI Model History Guide
- Lines
- Each solid line shows this horse’s model score over its last 10 races: blue = Mod1, green = Mod2, amber = Mod3.
- Dashed Lines
- Dashed lines represent the current race’s field average for each model — a score below the dashed line indicates the horse ranked below average in this model’s assessment.
- Higher is Stronger
- All three model scores are 0–100: a higher number means the model rates this horse more favorably among the field.
Mod1(W): 82 (1/8) Mod2(W): 75 (2/8) Mod3(W): 79 (3/8) Mod1-LS: 55 (6/8) Win Prob: 18.4% Value Score: 1.35 ★
Performance vs. Peers Guide
- Bars (per post)
- Blue = avg career performance • Amber = avg last 3 races • Green = last race (improved vs. avg) • Red = last race (declined vs. avg)
- Trend Line
- Angled line above the bars: rising = improving form • falling = declining form.
- Horizontal Line
- Field average — the mean career performance of all horses in this race.
- Color Circles
- Standard post-position colors below each lane — same as the Total Pace chart.
- Border
- Thicker border = this horse’s post position.
Figure Comparison
- Rating
- The three Pick Pony algorithm ratings (Algo 1, Algo 2, Algo 3) that make up the overall PP AI Rating — higher is a stronger contender rating.
- Speed
- Career average speed, recent 3-race average, and last-race speed figure — spot horses in improving or declining form.
- Pace
- Average Early (E1), Mid (E2), and Stretch (LP) pace figures — reveals pace-setters vs. closers vs. all-the-way types.
- This horse
- The horse whose stats card is open is highlighted with a darker column background.
Winning Profiles
- Axes
- X: Win % from last 10 starts — Y: In-the-money % (top-3 finishes) from last 10 starts.
- Quadrants
- Consistent Winners (top-right): high win & ITM — reliable performers.
Place Threats (top-left): boards often but doesn’t win often — good exacta/trifecta angles.
Streaky (bottom-right): wins occasionally, misses the board often — all-or-nothing.
Developing (bottom-left): still finding form — longshot territory. - Reference Lines
- Dashed lines mark field averages. Dots to the right win more; dots higher board more.
- This horse
- Highlighted with a gold border and larger dot.
AI Model Comparison
- Winner Models (green)
- Mod1(W), Mod2(W), and Mod3(W) trained to predict race winners. Higher score = stronger contender.
- Longshot Models (red)
- Mod1-LS, Mod2-LS, and Mod3-LS trained to find high-value longshots. Higher score = stronger longshot candidate.
- Form Model (blue)
- Mod4 sequence model trained on recent form patterns. Higher score = stronger recent form profile.
- This horse
- Highlighted with a darker column background.
Race Pace Simulation Guide
- Slider
- Drag left→right to advance from gate to finish. Drag all the way back to reset the race.
- Predicted Finish Order
- Factors in contested pace burn, each horse’s effort curve (peaked-early vs. peaked-late), and wide trip cost from outside posts. Updated live when Track Bias changes.
- Pace Scenario
- Lone Speed: single E horse likely rates and holds. Contested: two E horses burn each other — closers benefit. Hot Pace: speed meltdown, deep closers thrive. Soft: no early speed, moderate fractions throughout.
- Track Bias
- Slider below canvas. −2 = strong closer/wet bias; +2 = strong speed/rail bias. Recomputes the predicted finish order.
- Boxed Indicator
- Dashed orange ring = horse is surrounded (rival ahead, rival behind, wall outside). In a real race this horse must find a clear path to run.
- Running Styles
- E/EE = early speed (rushes to rail). P = presser (stalks the pace). S = stalker. SS = slow starter / closer.
| Stat | vs. Current Card | vs. All Horses |
|---|---|---|
| Averages
Career-average metrics across all AI race analysis. Performance and pace averages reflect estimated historical performance; trainer and jockey grades score in-the-money percentages. Grading scale: A = elite • B = above average • C = average • D = below average • F = poor • — = no data |
||
| Pick Pony AI Rating | B | A |
| Pace Trip Longshot | — | — |
| Connections Longshot | — | — |
| Situational Longshot | — | — |
| Speed | C | A |
| Early Pace | B | D |
| Mid Pace | B | B |
| Late Pace | A | A |
| Finish Pos | D | D |
| Dirt Speed | D | F |
| Turf Speed | B | A |
| Distance Speed | C | F |
| Trainer Effectiveness | D | C |
| Jockey Effectiveness | A | A |
| 3rd Party Ratings | A | A |
| Recent
Performance analysis from the horse's recent races, weighted to reflect current form. Sprint and Route FPS (Foot Per Second) measure pace efficiency over the horse's recent sprints and routes respectively. Grading scale: A = elite • B = above average • C = average • D = below average • F = poor • — = no data |
||
| Speed | C | A |
| Early Pace | B | C |
| Mid Pace | B | B |
| Late Pace | B | A |
| Sprint FPS | D | F |
| Route FPS | D | F |
| Trainer Effectiveness | D | C |
| Jockey Effectiveness | A | A |
| 3rd Party Ratings | A | A |
| Predictions
AI-generated projections for the upcoming race, derived from prior AI analysis for speed and pace trends, surface and distance suitability, and current conditions. Grading scale: A = elite • B = above average • C = average • D = below average • F = poor • — = no data |
||
| Speed | C | A |
| Early Pace | D | D |
| Mid Pace | D | C |
| Late Pace | B | C |
Chart Guide (2.0.36)
- Bubbles
- Color = surface: green (turf), brown (dirt), blue (synthetic)
- Top number = finishing position; bottom number in parentheses = starting post position
- Height above line = beaten lengths — closer means a smaller margin
- Border = track conditions: green (FST/GD/FM), yellow (WF/SL/YLD), red (SY/MY/FRZ/SFT/HVY)
- Connecting Line
- Solid = good conditions; dashed = bad conditions
- Line Symbol
- ▲ Triangle = sprint (7f or less); ● Circle = route (more than 7f)
- Days Between Races
- Small number above each bubble (e.g. 19d) = days since the previous race — helps spot freshness, layoffs, and tight scheduling.
- Shaded Band (Bollinger)
- Highlights volatility — a wider band means more variation in recent performance
- Performance Trend
- Straight line showing the overall performance direction — angled up = improving, angled down = declining
- Dashed Reference Line
- AI Opponent = AI analysis class-level par for the race
AI Model History Guide
- Lines
- Each solid line shows this horse’s model score over its last 10 races: blue = Mod1, green = Mod2, amber = Mod3.
- Dashed Lines
- Dashed lines represent the current race’s field average for each model — a score below the dashed line indicates the horse ranked below average in this model’s assessment.
- Higher is Stronger
- All three model scores are 0–100: a higher number means the model rates this horse more favorably among the field.
Mod1(W): 82 (1/8) Mod2(W): 75 (2/8) Mod3(W): 79 (3/8) Mod1-LS: 55 (6/8) Win Prob: 18.4% Value Score: 1.35 ★
Performance vs. Peers Guide
- Bars (per post)
- Blue = avg career performance • Amber = avg last 3 races • Green = last race (improved vs. avg) • Red = last race (declined vs. avg)
- Trend Line
- Angled line above the bars: rising = improving form • falling = declining form.
- Horizontal Line
- Field average — the mean career performance of all horses in this race.
- Color Circles
- Standard post-position colors below each lane — same as the Total Pace chart.
- Border
- Thicker border = this horse’s post position.
Figure Comparison
- Rating
- The three Pick Pony algorithm ratings (Algo 1, Algo 2, Algo 3) that make up the overall PP AI Rating — higher is a stronger contender rating.
- Speed
- Career average speed, recent 3-race average, and last-race speed figure — spot horses in improving or declining form.
- Pace
- Average Early (E1), Mid (E2), and Stretch (LP) pace figures — reveals pace-setters vs. closers vs. all-the-way types.
- This horse
- The horse whose stats card is open is highlighted with a darker column background.
Winning Profiles
- Axes
- X: Win % from last 10 starts — Y: In-the-money % (top-3 finishes) from last 10 starts.
- Quadrants
- Consistent Winners (top-right): high win & ITM — reliable performers.
Place Threats (top-left): boards often but doesn’t win often — good exacta/trifecta angles.
Streaky (bottom-right): wins occasionally, misses the board often — all-or-nothing.
Developing (bottom-left): still finding form — longshot territory. - Reference Lines
- Dashed lines mark field averages. Dots to the right win more; dots higher board more.
- This horse
- Highlighted with a gold border and larger dot.
AI Model Comparison
- Winner Models (green)
- Mod1(W), Mod2(W), and Mod3(W) trained to predict race winners. Higher score = stronger contender.
- Longshot Models (red)
- Mod1-LS, Mod2-LS, and Mod3-LS trained to find high-value longshots. Higher score = stronger longshot candidate.
- Form Model (blue)
- Mod4 sequence model trained on recent form patterns. Higher score = stronger recent form profile.
- This horse
- Highlighted with a darker column background.
Race Pace Simulation Guide
- Slider
- Drag left→right to advance from gate to finish. Drag all the way back to reset the race.
- Predicted Finish Order
- Factors in contested pace burn, each horse’s effort curve (peaked-early vs. peaked-late), and wide trip cost from outside posts. Updated live when Track Bias changes.
- Pace Scenario
- Lone Speed: single E horse likely rates and holds. Contested: two E horses burn each other — closers benefit. Hot Pace: speed meltdown, deep closers thrive. Soft: no early speed, moderate fractions throughout.
- Track Bias
- Slider below canvas. −2 = strong closer/wet bias; +2 = strong speed/rail bias. Recomputes the predicted finish order.
- Boxed Indicator
- Dashed orange ring = horse is surrounded (rival ahead, rival behind, wall outside). In a real race this horse must find a clear path to run.
- Running Styles
- E/EE = early speed (rushes to rail). P = presser (stalks the pace). S = stalker. SS = slow starter / closer.
| Stat | vs. Current Card | vs. All Horses |
|---|---|---|
| Averages
Career-average metrics across all AI race analysis. Performance and pace averages reflect estimated historical performance; trainer and jockey grades score in-the-money percentages. Grading scale: A = elite • B = above average • C = average • D = below average • F = poor • — = no data |
||
| Pick Pony AI Rating | C | C |
| Pace Trip Longshot | — | — |
| Connections Longshot | — | — |
| Situational Longshot | — | — |
| Speed | D | A |
| Early Pace | D | D |
| Mid Pace | D | C |
| Late Pace | C | A |
| Finish Pos | C | D |
| Dirt Speed | C | A |
| Turf Speed | A | A |
| Distance Speed | C | F |
| Trainer Effectiveness | C | C |
| Jockey Effectiveness | B | C |
| 3rd Party Ratings | C | A |
| Recent
Performance analysis from the horse's recent races, weighted to reflect current form. Sprint and Route FPS (Foot Per Second) measure pace efficiency over the horse's recent sprints and routes respectively. Grading scale: A = elite • B = above average • C = average • D = below average • F = poor • — = no data |
||
| Speed | A | A |
| Early Pace | D | D |
| Mid Pace | D | C |
| Late Pace | A | A |
| Sprint FPS | C | D |
| Route FPS | B | C |
| Trainer Effectiveness | C | C |
| Jockey Effectiveness | B | C |
| 3rd Party Ratings | C | A |
| Predictions
AI-generated projections for the upcoming race, derived from prior AI analysis for speed and pace trends, surface and distance suitability, and current conditions. Grading scale: A = elite • B = above average • C = average • D = below average • F = poor • — = no data |
||
| Speed | D | A |
| Early Pace | C | D |
| Mid Pace | C | C |
| Late Pace | B | C |
Chart Guide (2.0.36)
- Bubbles
- Color = surface: green (turf), brown (dirt), blue (synthetic)
- Top number = finishing position; bottom number in parentheses = starting post position
- Height above line = beaten lengths — closer means a smaller margin
- Border = track conditions: green (FST/GD/FM), yellow (WF/SL/YLD), red (SY/MY/FRZ/SFT/HVY)
- Connecting Line
- Solid = good conditions; dashed = bad conditions
- Line Symbol
- ▲ Triangle = sprint (7f or less); ● Circle = route (more than 7f)
- Days Between Races
- Small number above each bubble (e.g. 19d) = days since the previous race — helps spot freshness, layoffs, and tight scheduling.
- Shaded Band (Bollinger)
- Highlights volatility — a wider band means more variation in recent performance
- Performance Trend
- Straight line showing the overall performance direction — angled up = improving, angled down = declining
- Dashed Reference Line
- AI Opponent = AI analysis class-level par for the race
AI Model History Guide
- Lines
- Each solid line shows this horse’s model score over its last 10 races: blue = Mod1, green = Mod2, amber = Mod3.
- Dashed Lines
- Dashed lines represent the current race’s field average for each model — a score below the dashed line indicates the horse ranked below average in this model’s assessment.
- Higher is Stronger
- All three model scores are 0–100: a higher number means the model rates this horse more favorably among the field.
Mod1(W): 82 (1/8) Mod2(W): 75 (2/8) Mod3(W): 79 (3/8) Mod1-LS: 55 (6/8) Win Prob: 18.4% Value Score: 1.35 ★
Performance vs. Peers Guide
- Bars (per post)
- Blue = avg career performance • Amber = avg last 3 races • Green = last race (improved vs. avg) • Red = last race (declined vs. avg)
- Trend Line
- Angled line above the bars: rising = improving form • falling = declining form.
- Horizontal Line
- Field average — the mean career performance of all horses in this race.
- Color Circles
- Standard post-position colors below each lane — same as the Total Pace chart.
- Border
- Thicker border = this horse’s post position.
Figure Comparison
- Rating
- The three Pick Pony algorithm ratings (Algo 1, Algo 2, Algo 3) that make up the overall PP AI Rating — higher is a stronger contender rating.
- Speed
- Career average speed, recent 3-race average, and last-race speed figure — spot horses in improving or declining form.
- Pace
- Average Early (E1), Mid (E2), and Stretch (LP) pace figures — reveals pace-setters vs. closers vs. all-the-way types.
- This horse
- The horse whose stats card is open is highlighted with a darker column background.
Winning Profiles
- Axes
- X: Win % from last 10 starts — Y: In-the-money % (top-3 finishes) from last 10 starts.
- Quadrants
- Consistent Winners (top-right): high win & ITM — reliable performers.
Place Threats (top-left): boards often but doesn’t win often — good exacta/trifecta angles.
Streaky (bottom-right): wins occasionally, misses the board often — all-or-nothing.
Developing (bottom-left): still finding form — longshot territory. - Reference Lines
- Dashed lines mark field averages. Dots to the right win more; dots higher board more.
- This horse
- Highlighted with a gold border and larger dot.
AI Model Comparison
- Winner Models (green)
- Mod1(W), Mod2(W), and Mod3(W) trained to predict race winners. Higher score = stronger contender.
- Longshot Models (red)
- Mod1-LS, Mod2-LS, and Mod3-LS trained to find high-value longshots. Higher score = stronger longshot candidate.
- Form Model (blue)
- Mod4 sequence model trained on recent form patterns. Higher score = stronger recent form profile.
- This horse
- Highlighted with a darker column background.
Race Pace Simulation Guide
- Slider
- Drag left→right to advance from gate to finish. Drag all the way back to reset the race.
- Predicted Finish Order
- Factors in contested pace burn, each horse’s effort curve (peaked-early vs. peaked-late), and wide trip cost from outside posts. Updated live when Track Bias changes.
- Pace Scenario
- Lone Speed: single E horse likely rates and holds. Contested: two E horses burn each other — closers benefit. Hot Pace: speed meltdown, deep closers thrive. Soft: no early speed, moderate fractions throughout.
- Track Bias
- Slider below canvas. −2 = strong closer/wet bias; +2 = strong speed/rail bias. Recomputes the predicted finish order.
- Boxed Indicator
- Dashed orange ring = horse is surrounded (rival ahead, rival behind, wall outside). In a real race this horse must find a clear path to run.
- Running Styles
- E/EE = early speed (rushes to rail). P = presser (stalks the pace). S = stalker. SS = slow starter / closer.
| Stat | vs. Current Card | vs. All Horses |
|---|---|---|
| Averages
Career-average metrics across all AI race analysis. Performance and pace averages reflect estimated historical performance; trainer and jockey grades score in-the-money percentages. Grading scale: A = elite • B = above average • C = average • D = below average • F = poor • — = no data |
||
| Pick Pony AI Rating | A | A |
| Pace Trip Longshot | — | — |
| Connections Longshot | — | — |
| Situational Longshot | — | — |
| Speed | A | A |
| Early Pace | A | A |
| Mid Pace | A | A |
| Late Pace | D | A |
| Finish Pos | A | B |
| Dirt Speed | C | A |
| Turf Speed | D | D |
| Distance Speed | A | A |
| Trainer Effectiveness | A | A |
| Jockey Effectiveness | A | A |
| 3rd Party Ratings | A | A |
| Recent
Performance analysis from the horse's recent races, weighted to reflect current form. Sprint and Route FPS (Foot Per Second) measure pace efficiency over the horse's recent sprints and routes respectively. Grading scale: A = elite • B = above average • C = average • D = below average • F = poor • — = no data |
||
| Speed | B | A |
| Early Pace | A | A |
| Mid Pace | A | A |
| Late Pace | C | B |
| Sprint FPS | A | A |
| Route FPS | A | A |
| Trainer Effectiveness | A | A |
| Jockey Effectiveness | A | A |
| 3rd Party Ratings | A | A |
| Predictions
AI-generated projections for the upcoming race, derived from prior AI analysis for speed and pace trends, surface and distance suitability, and current conditions. Grading scale: A = elite • B = above average • C = average • D = below average • F = poor • — = no data |
||
| Speed | A | A |
| Early Pace | A | A |
| Mid Pace | A | A |
| Late Pace | B | C |
Chart Guide (2.0.36)
- Bubbles
- Color = surface: green (turf), brown (dirt), blue (synthetic)
- Top number = finishing position; bottom number in parentheses = starting post position
- Height above line = beaten lengths — closer means a smaller margin
- Border = track conditions: green (FST/GD/FM), yellow (WF/SL/YLD), red (SY/MY/FRZ/SFT/HVY)
- Connecting Line
- Solid = good conditions; dashed = bad conditions
- Line Symbol
- ▲ Triangle = sprint (7f or less); ● Circle = route (more than 7f)
- Days Between Races
- Small number above each bubble (e.g. 19d) = days since the previous race — helps spot freshness, layoffs, and tight scheduling.
- Shaded Band (Bollinger)
- Highlights volatility — a wider band means more variation in recent performance
- Performance Trend
- Straight line showing the overall performance direction — angled up = improving, angled down = declining
- Dashed Reference Line
- AI Opponent = AI analysis class-level par for the race
AI Model History Guide
- Lines
- Each solid line shows this horse’s model score over its last 10 races: blue = Mod1, green = Mod2, amber = Mod3.
- Dashed Lines
- Dashed lines represent the current race’s field average for each model — a score below the dashed line indicates the horse ranked below average in this model’s assessment.
- Higher is Stronger
- All three model scores are 0–100: a higher number means the model rates this horse more favorably among the field.
Mod1(W): 82 (1/8) Mod2(W): 75 (2/8) Mod3(W): 79 (3/8) Mod1-LS: 55 (6/8) Win Prob: 18.4% Value Score: 1.35 ★
Performance vs. Peers Guide
- Bars (per post)
- Blue = avg career performance • Amber = avg last 3 races • Green = last race (improved vs. avg) • Red = last race (declined vs. avg)
- Trend Line
- Angled line above the bars: rising = improving form • falling = declining form.
- Horizontal Line
- Field average — the mean career performance of all horses in this race.
- Color Circles
- Standard post-position colors below each lane — same as the Total Pace chart.
- Border
- Thicker border = this horse’s post position.
Figure Comparison
- Rating
- The three Pick Pony algorithm ratings (Algo 1, Algo 2, Algo 3) that make up the overall PP AI Rating — higher is a stronger contender rating.
- Speed
- Career average speed, recent 3-race average, and last-race speed figure — spot horses in improving or declining form.
- Pace
- Average Early (E1), Mid (E2), and Stretch (LP) pace figures — reveals pace-setters vs. closers vs. all-the-way types.
- This horse
- The horse whose stats card is open is highlighted with a darker column background.
Winning Profiles
- Axes
- X: Win % from last 10 starts — Y: In-the-money % (top-3 finishes) from last 10 starts.
- Quadrants
- Consistent Winners (top-right): high win & ITM — reliable performers.
Place Threats (top-left): boards often but doesn’t win often — good exacta/trifecta angles.
Streaky (bottom-right): wins occasionally, misses the board often — all-or-nothing.
Developing (bottom-left): still finding form — longshot territory. - Reference Lines
- Dashed lines mark field averages. Dots to the right win more; dots higher board more.
- This horse
- Highlighted with a gold border and larger dot.
AI Model Comparison
- Winner Models (green)
- Mod1(W), Mod2(W), and Mod3(W) trained to predict race winners. Higher score = stronger contender.
- Longshot Models (red)
- Mod1-LS, Mod2-LS, and Mod3-LS trained to find high-value longshots. Higher score = stronger longshot candidate.
- Form Model (blue)
- Mod4 sequence model trained on recent form patterns. Higher score = stronger recent form profile.
- This horse
- Highlighted with a darker column background.
Race Pace Simulation Guide
- Slider
- Drag left→right to advance from gate to finish. Drag all the way back to reset the race.
- Predicted Finish Order
- Factors in contested pace burn, each horse’s effort curve (peaked-early vs. peaked-late), and wide trip cost from outside posts. Updated live when Track Bias changes.
- Pace Scenario
- Lone Speed: single E horse likely rates and holds. Contested: two E horses burn each other — closers benefit. Hot Pace: speed meltdown, deep closers thrive. Soft: no early speed, moderate fractions throughout.
- Track Bias
- Slider below canvas. −2 = strong closer/wet bias; +2 = strong speed/rail bias. Recomputes the predicted finish order.
- Boxed Indicator
- Dashed orange ring = horse is surrounded (rival ahead, rival behind, wall outside). In a real race this horse must find a clear path to run.
- Running Styles
- E/EE = early speed (rushes to rail). P = presser (stalks the pace). S = stalker. SS = slow starter / closer.
| Stat | vs. Current Card | vs. All Horses |
|---|---|---|
| Averages
Career-average metrics across all AI race analysis. Performance and pace averages reflect estimated historical performance; trainer and jockey grades score in-the-money percentages. Grading scale: A = elite • B = above average • C = average • D = below average • F = poor • — = no data |
||
| Pick Pony AI Rating | A | B |
| Pace Trip Longshot | — | — |
| Connections Longshot | — | — |
| Situational Longshot | — | — |
| Speed | B | C |
| Early Pace | A | A |
| Mid Pace | A | A |
| Late Pace | C | C |
| Finish Pos | F | F |
| Dirt Speed | D | F |
| Turf Speed | B | B |
| Distance Speed | C | F |
| Trainer Effectiveness | D | D |
| Jockey Effectiveness | B | C |
| 3rd Party Ratings | A | B |
| Recent
Performance analysis from the horse's recent races, weighted to reflect current form. Sprint and Route FPS (Foot Per Second) measure pace efficiency over the horse's recent sprints and routes respectively. Grading scale: A = elite • B = above average • C = average • D = below average • F = poor • — = no data |
||
| Speed | B | C |
| Early Pace | A | A |
| Mid Pace | A | A |
| Late Pace | C | C |
| Sprint FPS | B | B |
| Route FPS | A | A |
| Trainer Effectiveness | D | D |
| Jockey Effectiveness | B | C |
| 3rd Party Ratings | A | B |
| Predictions
AI-generated projections for the upcoming race, derived from prior AI analysis for speed and pace trends, surface and distance suitability, and current conditions. Grading scale: A = elite • B = above average • C = average • D = below average • F = poor • — = no data |
||
| Speed | A | A |
| Early Pace | A | A |
| Mid Pace | D | F |
| Late Pace | C | C |
AI Model History Guide
- Lines
- Each solid line shows this horse’s model score over its last 10 races: blue = Mod1, green = Mod2, amber = Mod3.
- Dashed Lines
- Dashed lines represent the current race’s field average for each model — a score below the dashed line indicates the horse ranked below average in this model’s assessment.
- Higher is Stronger
- All three model scores are 0–100: a higher number means the model rates this horse more favorably among the field.
Mod1(W): 82 (1/8) Mod2(W): 75 (2/8) Mod3(W): 79 (3/8) Mod1-LS: 55 (6/8) Win Prob: 18.4% Value Score: 1.35 ★
Performance vs. Peers Guide
- Bars (per post)
- Blue = avg career performance • Amber = avg last 3 races • Green = last race (improved vs. avg) • Red = last race (declined vs. avg)
- Trend Line
- Angled line above the bars: rising = improving form • falling = declining form.
- Horizontal Line
- Field average — the mean career performance of all horses in this race.
- Color Circles
- Standard post-position colors below each lane — same as the Total Pace chart.
- Border
- Thicker border = this horse’s post position.
Figure Comparison
- Rating
- The three Pick Pony algorithm ratings (Algo 1, Algo 2, Algo 3) that make up the overall PP AI Rating — higher is a stronger contender rating.
- Speed
- Career average speed, recent 3-race average, and last-race speed figure — spot horses in improving or declining form.
- Pace
- Average Early (E1), Mid (E2), and Stretch (LP) pace figures — reveals pace-setters vs. closers vs. all-the-way types.
- This horse
- The horse whose stats card is open is highlighted with a darker column background.
Winning Profiles
- Axes
- X: Win % from last 10 starts — Y: In-the-money % (top-3 finishes) from last 10 starts.
- Quadrants
- Consistent Winners (top-right): high win & ITM — reliable performers.
Place Threats (top-left): boards often but doesn’t win often — good exacta/trifecta angles.
Streaky (bottom-right): wins occasionally, misses the board often — all-or-nothing.
Developing (bottom-left): still finding form — longshot territory. - Reference Lines
- Dashed lines mark field averages. Dots to the right win more; dots higher board more.
- This horse
- Highlighted with a gold border and larger dot.
AI Model Comparison
- Winner Models (green)
- Mod1(W), Mod2(W), and Mod3(W) trained to predict race winners. Higher score = stronger contender.
- Longshot Models (red)
- Mod1-LS, Mod2-LS, and Mod3-LS trained to find high-value longshots. Higher score = stronger longshot candidate.
- Form Model (blue)
- Mod4 sequence model trained on recent form patterns. Higher score = stronger recent form profile.
- This horse
- Highlighted with a darker column background.
Race Pace Simulation Guide
- Slider
- Drag left→right to advance from gate to finish. Drag all the way back to reset the race.
- Predicted Finish Order
- Factors in contested pace burn, each horse’s effort curve (peaked-early vs. peaked-late), and wide trip cost from outside posts. Updated live when Track Bias changes.
- Pace Scenario
- Lone Speed: single E horse likely rates and holds. Contested: two E horses burn each other — closers benefit. Hot Pace: speed meltdown, deep closers thrive. Soft: no early speed, moderate fractions throughout.
- Track Bias
- Slider below canvas. −2 = strong closer/wet bias; +2 = strong speed/rail bias. Recomputes the predicted finish order.
- Boxed Indicator
- Dashed orange ring = horse is surrounded (rival ahead, rival behind, wall outside). In a real race this horse must find a clear path to run.
- Running Styles
- E/EE = early speed (rushes to rail). P = presser (stalks the pace). S = stalker. SS = slow starter / closer.
| Stat | vs. Current Card | vs. All Horses |
|---|---|---|
| Averages
Career-average metrics across all AI race analysis. Performance and pace averages reflect estimated historical performance; trainer and jockey grades score in-the-money percentages. Grading scale: A = elite • B = above average • C = average • D = below average • F = poor • — = no data |
||
| Pick Pony AI Rating | B | C |
| Pace Trip Longshot | — | — |
| Connections Longshot | — | — |
| Situational Longshot | — | — |
| Speed | F | F |
| Early Pace | F | F |
| Mid Pace | F | F |
| Late Pace | F | F |
| Finish Pos | B | A |
| Dirt Speed | D | F |
| Turf Speed | D | D |
| Distance Speed | C | F |
| Trainer Effectiveness | A | A |
| Jockey Effectiveness | A | A |
| 3rd Party Ratings | F | F |
| Recent
Performance analysis from the horse's recent races, weighted to reflect current form. Sprint and Route FPS (Foot Per Second) measure pace efficiency over the horse's recent sprints and routes respectively. Grading scale: A = elite • B = above average • C = average • D = below average • F = poor • — = no data |
||
| Speed | F | F |
| Early Pace | F | F |
| Mid Pace | F | F |
| Late Pace | F | F |
| Sprint FPS | F | F |
| Route FPS | F | F |
| Trainer Effectiveness | A | A |
| Jockey Effectiveness | A | A |
| 3rd Party Ratings | F | F |
| Predictions
AI-generated projections for the upcoming race, derived from prior AI analysis for speed and pace trends, surface and distance suitability, and current conditions. Grading scale: A = elite • B = above average • C = average • D = below average • F = poor • — = no data |
||
| Speed | F | F |
| Early Pace | D | F |
| Mid Pace | D | F |
| Late Pace | C | C |
Chart Guide (2.0.36)
- Bubbles
- Color = surface: green (turf), brown (dirt), blue (synthetic)
- Top number = finishing position; bottom number in parentheses = starting post position
- Height above line = beaten lengths — closer means a smaller margin
- Border = track conditions: green (FST/GD/FM), yellow (WF/SL/YLD), red (SY/MY/FRZ/SFT/HVY)
- Connecting Line
- Solid = good conditions; dashed = bad conditions
- Line Symbol
- ▲ Triangle = sprint (7f or less); ● Circle = route (more than 7f)
- Days Between Races
- Small number above each bubble (e.g. 19d) = days since the previous race — helps spot freshness, layoffs, and tight scheduling.
- Shaded Band (Bollinger)
- Highlights volatility — a wider band means more variation in recent performance
- Performance Trend
- Straight line showing the overall performance direction — angled up = improving, angled down = declining
- Dashed Reference Line
- AI Opponent = AI analysis class-level par for the race
AI Model History Guide
- Lines
- Each solid line shows this horse’s model score over its last 10 races: blue = Mod1, green = Mod2, amber = Mod3.
- Dashed Lines
- Dashed lines represent the current race’s field average for each model — a score below the dashed line indicates the horse ranked below average in this model’s assessment.
- Higher is Stronger
- All three model scores are 0–100: a higher number means the model rates this horse more favorably among the field.
Mod1(W): 82 (1/8) Mod2(W): 75 (2/8) Mod3(W): 79 (3/8) Mod1-LS: 55 (6/8) Win Prob: 18.4% Value Score: 1.35 ★
Performance vs. Peers Guide
- Bars (per post)
- Blue = avg career performance • Amber = avg last 3 races • Green = last race (improved vs. avg) • Red = last race (declined vs. avg)
- Trend Line
- Angled line above the bars: rising = improving form • falling = declining form.
- Horizontal Line
- Field average — the mean career performance of all horses in this race.
- Color Circles
- Standard post-position colors below each lane — same as the Total Pace chart.
- Border
- Thicker border = this horse’s post position.
Figure Comparison
- Rating
- The three Pick Pony algorithm ratings (Algo 1, Algo 2, Algo 3) that make up the overall PP AI Rating — higher is a stronger contender rating.
- Speed
- Career average speed, recent 3-race average, and last-race speed figure — spot horses in improving or declining form.
- Pace
- Average Early (E1), Mid (E2), and Stretch (LP) pace figures — reveals pace-setters vs. closers vs. all-the-way types.
- This horse
- The horse whose stats card is open is highlighted with a darker column background.
Winning Profiles
- Axes
- X: Win % from last 10 starts — Y: In-the-money % (top-3 finishes) from last 10 starts.
- Quadrants
- Consistent Winners (top-right): high win & ITM — reliable performers.
Place Threats (top-left): boards often but doesn’t win often — good exacta/trifecta angles.
Streaky (bottom-right): wins occasionally, misses the board often — all-or-nothing.
Developing (bottom-left): still finding form — longshot territory. - Reference Lines
- Dashed lines mark field averages. Dots to the right win more; dots higher board more.
- This horse
- Highlighted with a gold border and larger dot.
AI Model Comparison
- Winner Models (green)
- Mod1(W), Mod2(W), and Mod3(W) trained to predict race winners. Higher score = stronger contender.
- Longshot Models (red)
- Mod1-LS, Mod2-LS, and Mod3-LS trained to find high-value longshots. Higher score = stronger longshot candidate.
- Form Model (blue)
- Mod4 sequence model trained on recent form patterns. Higher score = stronger recent form profile.
- This horse
- Highlighted with a darker column background.
Race Pace Simulation Guide
- Slider
- Drag left→right to advance from gate to finish. Drag all the way back to reset the race.
- Predicted Finish Order
- Factors in contested pace burn, each horse’s effort curve (peaked-early vs. peaked-late), and wide trip cost from outside posts. Updated live when Track Bias changes.
- Pace Scenario
- Lone Speed: single E horse likely rates and holds. Contested: two E horses burn each other — closers benefit. Hot Pace: speed meltdown, deep closers thrive. Soft: no early speed, moderate fractions throughout.
- Track Bias
- Slider below canvas. −2 = strong closer/wet bias; +2 = strong speed/rail bias. Recomputes the predicted finish order.
- Boxed Indicator
- Dashed orange ring = horse is surrounded (rival ahead, rival behind, wall outside). In a real race this horse must find a clear path to run.
- Running Styles
- E/EE = early speed (rushes to rail). P = presser (stalks the pace). S = stalker. SS = slow starter / closer.
| Stat | vs. Current Card | vs. All Horses |
|---|---|---|
| Averages
Career-average metrics across all AI race analysis. Performance and pace averages reflect estimated historical performance; trainer and jockey grades score in-the-money percentages. Grading scale: A = elite • B = above average • C = average • D = below average • F = poor • — = no data |
||
| Pick Pony AI Rating | A | A |
| Pace Trip Longshot | — | — |
| Connections Longshot | — | — |
| Situational Longshot | — | — |
| Speed | A | A |
| Early Pace | A | A |
| Mid Pace | A | A |
| Late Pace | A | A |
| Finish Pos | B | A |
| Dirt Speed | B | C |
| Turf Speed | A | A |
| Distance Speed | C | F |
| Trainer Effectiveness | A | B |
| Jockey Effectiveness | A | A |
| 3rd Party Ratings | A | A |
| Recent
Performance analysis from the horse's recent races, weighted to reflect current form. Sprint and Route FPS (Foot Per Second) measure pace efficiency over the horse's recent sprints and routes respectively. Grading scale: A = elite • B = above average • C = average • D = below average • F = poor • — = no data |
||
| Speed | A | B |
| Early Pace | B | A |
| Mid Pace | A | B |
| Late Pace | A | A |
| Sprint FPS | B | B |
| Route FPS | B | B |
| Trainer Effectiveness | A | B |
| Jockey Effectiveness | A | A |
| 3rd Party Ratings | A | A |
| Predictions
AI-generated projections for the upcoming race, derived from prior AI analysis for speed and pace trends, surface and distance suitability, and current conditions. Grading scale: A = elite • B = above average • C = average • D = below average • F = poor • — = no data |
||
| Speed | A | A |
| Early Pace | B | A |
| Mid Pace | A | A |
| Late Pace | C | C |
AI Model History Guide
- Lines
- Each solid line shows this horse’s model score over its last 10 races: blue = Mod1, green = Mod2, amber = Mod3.
- Dashed Lines
- Dashed lines represent the current race’s field average for each model — a score below the dashed line indicates the horse ranked below average in this model’s assessment.
- Higher is Stronger
- All three model scores are 0–100: a higher number means the model rates this horse more favorably among the field.
Mod1(W): 82 (1/8) Mod2(W): 75 (2/8) Mod3(W): 79 (3/8) Mod1-LS: 55 (6/8) Win Prob: 18.4% Value Score: 1.35 ★
Performance vs. Peers Guide
- Bars (per post)
- Blue = avg career performance • Amber = avg last 3 races • Green = last race (improved vs. avg) • Red = last race (declined vs. avg)
- Trend Line
- Angled line above the bars: rising = improving form • falling = declining form.
- Horizontal Line
- Field average — the mean career performance of all horses in this race.
- Color Circles
- Standard post-position colors below each lane — same as the Total Pace chart.
- Border
- Thicker border = this horse’s post position.
Figure Comparison
- Rating
- The three Pick Pony algorithm ratings (Algo 1, Algo 2, Algo 3) that make up the overall PP AI Rating — higher is a stronger contender rating.
- Speed
- Career average speed, recent 3-race average, and last-race speed figure — spot horses in improving or declining form.
- Pace
- Average Early (E1), Mid (E2), and Stretch (LP) pace figures — reveals pace-setters vs. closers vs. all-the-way types.
- This horse
- The horse whose stats card is open is highlighted with a darker column background.
Winning Profiles
- Axes
- X: Win % from last 10 starts — Y: In-the-money % (top-3 finishes) from last 10 starts.
- Quadrants
- Consistent Winners (top-right): high win & ITM — reliable performers.
Place Threats (top-left): boards often but doesn’t win often — good exacta/trifecta angles.
Streaky (bottom-right): wins occasionally, misses the board often — all-or-nothing.
Developing (bottom-left): still finding form — longshot territory. - Reference Lines
- Dashed lines mark field averages. Dots to the right win more; dots higher board more.
- This horse
- Highlighted with a gold border and larger dot.
AI Model Comparison
- Winner Models (green)
- Mod1(W), Mod2(W), and Mod3(W) trained to predict race winners. Higher score = stronger contender.
- Longshot Models (red)
- Mod1-LS, Mod2-LS, and Mod3-LS trained to find high-value longshots. Higher score = stronger longshot candidate.
- Form Model (blue)
- Mod4 sequence model trained on recent form patterns. Higher score = stronger recent form profile.
- This horse
- Highlighted with a darker column background.
Race Pace Simulation Guide
- Slider
- Drag left→right to advance from gate to finish. Drag all the way back to reset the race.
- Predicted Finish Order
- Factors in contested pace burn, each horse’s effort curve (peaked-early vs. peaked-late), and wide trip cost from outside posts. Updated live when Track Bias changes.
- Pace Scenario
- Lone Speed: single E horse likely rates and holds. Contested: two E horses burn each other — closers benefit. Hot Pace: speed meltdown, deep closers thrive. Soft: no early speed, moderate fractions throughout.
- Track Bias
- Slider below canvas. −2 = strong closer/wet bias; +2 = strong speed/rail bias. Recomputes the predicted finish order.
- Boxed Indicator
- Dashed orange ring = horse is surrounded (rival ahead, rival behind, wall outside). In a real race this horse must find a clear path to run.
- Running Styles
- E/EE = early speed (rushes to rail). P = presser (stalks the pace). S = stalker. SS = slow starter / closer.
| Stat | vs. Current Card | vs. All Horses |
|---|---|---|
| Averages
Career-average metrics across all AI race analysis. Performance and pace averages reflect estimated historical performance; trainer and jockey grades score in-the-money percentages. Grading scale: A = elite • B = above average • C = average • D = below average • F = poor • — = no data |
||
| Pick Pony AI Rating | D | D |
| Pace Trip Longshot | — | — |
| Connections Longshot | — | — |
| Situational Longshot | — | — |
| Speed | F | F |
| Early Pace | F | F |
| Mid Pace | F | F |
| Late Pace | F | F |
| Finish Pos | B | A |
| Dirt Speed | D | F |
| Turf Speed | D | D |
| Distance Speed | C | F |
| Trainer Effectiveness | C | D |
| Jockey Effectiveness | D | D |
| 3rd Party Ratings | F | F |
| Recent
Performance analysis from the horse's recent races, weighted to reflect current form. Sprint and Route FPS (Foot Per Second) measure pace efficiency over the horse's recent sprints and routes respectively. Grading scale: A = elite • B = above average • C = average • D = below average • F = poor • — = no data |
||
| Speed | F | F |
| Early Pace | F | F |
| Mid Pace | F | F |
| Late Pace | F | F |
| Sprint FPS | F | F |
| Route FPS | F | F |
| Trainer Effectiveness | C | D |
| Jockey Effectiveness | D | D |
| 3rd Party Ratings | F | F |
| Predictions
AI-generated projections for the upcoming race, derived from prior AI analysis for speed and pace trends, surface and distance suitability, and current conditions. Grading scale: A = elite • B = above average • C = average • D = below average • F = poor • — = no data |
||
| Speed | F | F |
| Early Pace | D | F |
| Mid Pace | D | F |
| Late Pace | C | C |
AI Model History Guide
- Lines
- Each solid line shows this horse’s model score over its last 10 races: blue = Mod1, green = Mod2, amber = Mod3.
- Dashed Lines
- Dashed lines represent the current race’s field average for each model — a score below the dashed line indicates the horse ranked below average in this model’s assessment.
- Higher is Stronger
- All three model scores are 0–100: a higher number means the model rates this horse more favorably among the field.
Mod1(W): 82 (1/8) Mod2(W): 75 (2/8) Mod3(W): 79 (3/8) Mod1-LS: 55 (6/8) Win Prob: 18.4% Value Score: 1.35 ★
Performance vs. Peers Guide
- Bars (per post)
- Blue = avg career performance • Amber = avg last 3 races • Green = last race (improved vs. avg) • Red = last race (declined vs. avg)
- Trend Line
- Angled line above the bars: rising = improving form • falling = declining form.
- Horizontal Line
- Field average — the mean career performance of all horses in this race.
- Color Circles
- Standard post-position colors below each lane — same as the Total Pace chart.
- Border
- Thicker border = this horse’s post position.
Figure Comparison
- Rating
- The three Pick Pony algorithm ratings (Algo 1, Algo 2, Algo 3) that make up the overall PP AI Rating — higher is a stronger contender rating.
- Speed
- Career average speed, recent 3-race average, and last-race speed figure — spot horses in improving or declining form.
- Pace
- Average Early (E1), Mid (E2), and Stretch (LP) pace figures — reveals pace-setters vs. closers vs. all-the-way types.
- This horse
- The horse whose stats card is open is highlighted with a darker column background.
Winning Profiles
- Axes
- X: Win % from last 10 starts — Y: In-the-money % (top-3 finishes) from last 10 starts.
- Quadrants
- Consistent Winners (top-right): high win & ITM — reliable performers.
Place Threats (top-left): boards often but doesn’t win often — good exacta/trifecta angles.
Streaky (bottom-right): wins occasionally, misses the board often — all-or-nothing.
Developing (bottom-left): still finding form — longshot territory. - Reference Lines
- Dashed lines mark field averages. Dots to the right win more; dots higher board more.
- This horse
- Highlighted with a gold border and larger dot.
AI Model Comparison
- Winner Models (green)
- Mod1(W), Mod2(W), and Mod3(W) trained to predict race winners. Higher score = stronger contender.
- Longshot Models (red)
- Mod1-LS, Mod2-LS, and Mod3-LS trained to find high-value longshots. Higher score = stronger longshot candidate.
- Form Model (blue)
- Mod4 sequence model trained on recent form patterns. Higher score = stronger recent form profile.
- This horse
- Highlighted with a darker column background.
Race Pace Simulation Guide
- Slider
- Drag left→right to advance from gate to finish. Drag all the way back to reset the race.
- Predicted Finish Order
- Factors in contested pace burn, each horse’s effort curve (peaked-early vs. peaked-late), and wide trip cost from outside posts. Updated live when Track Bias changes.
- Pace Scenario
- Lone Speed: single E horse likely rates and holds. Contested: two E horses burn each other — closers benefit. Hot Pace: speed meltdown, deep closers thrive. Soft: no early speed, moderate fractions throughout.
- Track Bias
- Slider below canvas. −2 = strong closer/wet bias; +2 = strong speed/rail bias. Recomputes the predicted finish order.
- Boxed Indicator
- Dashed orange ring = horse is surrounded (rival ahead, rival behind, wall outside). In a real race this horse must find a clear path to run.
- Running Styles
- E/EE = early speed (rushes to rail). P = presser (stalks the pace). S = stalker. SS = slow starter / closer.
| Stat | vs. Current Card | vs. All Horses |
|---|---|---|
| Averages
Career-average metrics across all AI race analysis. Performance and pace averages reflect estimated historical performance; trainer and jockey grades score in-the-money percentages. Grading scale: A = elite • B = above average • C = average • D = below average • F = poor • — = no data |
||
| Pick Pony AI Rating | B | C |
| Pace Trip Longshot | — | — |
| Connections Longshot | — | — |
| Situational Longshot | — | — |
| Speed | F | F |
| Early Pace | F | F |
| Mid Pace | F | F |
| Late Pace | F | F |
| Finish Pos | B | A |
| Dirt Speed | D | F |
| Turf Speed | D | D |
| Distance Speed | C | F |
| Trainer Effectiveness | C | C |
| Jockey Effectiveness | F | D |
| 3rd Party Ratings | F | F |
| Recent
Performance analysis from the horse's recent races, weighted to reflect current form. Sprint and Route FPS (Foot Per Second) measure pace efficiency over the horse's recent sprints and routes respectively. Grading scale: A = elite • B = above average • C = average • D = below average • F = poor • — = no data |
||
| Speed | F | F |
| Early Pace | F | F |
| Mid Pace | F | F |
| Late Pace | F | F |
| Sprint FPS | F | F |
| Route FPS | F | F |
| Trainer Effectiveness | C | C |
| Jockey Effectiveness | F | D |
| 3rd Party Ratings | F | F |
| Predictions
AI-generated projections for the upcoming race, derived from prior AI analysis for speed and pace trends, surface and distance suitability, and current conditions. Grading scale: A = elite • B = above average • C = average • D = below average • F = poor • — = no data |
||
| Speed | F | F |
| Early Pace | D | F |
| Mid Pace | D | F |
| Late Pace | C | C |
Chart Guide (2.0.36)
- Bubbles
- Color = surface: green (turf), brown (dirt), blue (synthetic)
- Top number = finishing position; bottom number in parentheses = starting post position
- Height above line = beaten lengths — closer means a smaller margin
- Border = track conditions: green (FST/GD/FM), yellow (WF/SL/YLD), red (SY/MY/FRZ/SFT/HVY)
- Connecting Line
- Solid = good conditions; dashed = bad conditions
- Line Symbol
- ▲ Triangle = sprint (7f or less); ● Circle = route (more than 7f)
- Days Between Races
- Small number above each bubble (e.g. 19d) = days since the previous race — helps spot freshness, layoffs, and tight scheduling.
- Shaded Band (Bollinger)
- Highlights volatility — a wider band means more variation in recent performance
- Performance Trend
- Straight line showing the overall performance direction — angled up = improving, angled down = declining
- Dashed Reference Line
- AI Opponent = AI analysis class-level par for the race
AI Model History Guide
- Lines
- Each solid line shows this horse’s model score over its last 10 races: blue = Mod1, green = Mod2, amber = Mod3.
- Dashed Lines
- Dashed lines represent the current race’s field average for each model — a score below the dashed line indicates the horse ranked below average in this model’s assessment.
- Higher is Stronger
- All three model scores are 0–100: a higher number means the model rates this horse more favorably among the field.
Mod1(W): 82 (1/8) Mod2(W): 75 (2/8) Mod3(W): 79 (3/8) Mod1-LS: 55 (6/8) Win Prob: 18.4% Value Score: 1.35 ★
Performance vs. Peers Guide
- Bars (per post)
- Blue = avg career performance • Amber = avg last 3 races • Green = last race (improved vs. avg) • Red = last race (declined vs. avg)
- Trend Line
- Angled line above the bars: rising = improving form • falling = declining form.
- Horizontal Line
- Field average — the mean career performance of all horses in this race.
- Color Circles
- Standard post-position colors below each lane — same as the Total Pace chart.
- Border
- Thicker border = this horse’s post position.
Figure Comparison
- Rating
- The three Pick Pony algorithm ratings (Algo 1, Algo 2, Algo 3) that make up the overall PP AI Rating — higher is a stronger contender rating.
- Speed
- Career average speed, recent 3-race average, and last-race speed figure — spot horses in improving or declining form.
- Pace
- Average Early (E1), Mid (E2), and Stretch (LP) pace figures — reveals pace-setters vs. closers vs. all-the-way types.
- This horse
- The horse whose stats card is open is highlighted with a darker column background.
Winning Profiles
- Axes
- X: Win % from last 10 starts — Y: In-the-money % (top-3 finishes) from last 10 starts.
- Quadrants
- Consistent Winners (top-right): high win & ITM — reliable performers.
Place Threats (top-left): boards often but doesn’t win often — good exacta/trifecta angles.
Streaky (bottom-right): wins occasionally, misses the board often — all-or-nothing.
Developing (bottom-left): still finding form — longshot territory. - Reference Lines
- Dashed lines mark field averages. Dots to the right win more; dots higher board more.
- This horse
- Highlighted with a gold border and larger dot.
AI Model Comparison
- Winner Models (green)
- Mod1(W), Mod2(W), and Mod3(W) trained to predict race winners. Higher score = stronger contender.
- Longshot Models (red)
- Mod1-LS, Mod2-LS, and Mod3-LS trained to find high-value longshots. Higher score = stronger longshot candidate.
- Form Model (blue)
- Mod4 sequence model trained on recent form patterns. Higher score = stronger recent form profile.
- This horse
- Highlighted with a darker column background.
Race Pace Simulation Guide
- Slider
- Drag left→right to advance from gate to finish. Drag all the way back to reset the race.
- Predicted Finish Order
- Factors in contested pace burn, each horse’s effort curve (peaked-early vs. peaked-late), and wide trip cost from outside posts. Updated live when Track Bias changes.
- Pace Scenario
- Lone Speed: single E horse likely rates and holds. Contested: two E horses burn each other — closers benefit. Hot Pace: speed meltdown, deep closers thrive. Soft: no early speed, moderate fractions throughout.
- Track Bias
- Slider below canvas. −2 = strong closer/wet bias; +2 = strong speed/rail bias. Recomputes the predicted finish order.
- Boxed Indicator
- Dashed orange ring = horse is surrounded (rival ahead, rival behind, wall outside). In a real race this horse must find a clear path to run.
- Running Styles
- E/EE = early speed (rushes to rail). P = presser (stalks the pace). S = stalker. SS = slow starter / closer.
| Stat | vs. Current Card | vs. All Horses |
|---|---|---|
| Averages
Career-average metrics across all AI race analysis. Performance and pace averages reflect estimated historical performance; trainer and jockey grades score in-the-money percentages. Grading scale: A = elite • B = above average • C = average • D = below average • F = poor • — = no data |
||
| Pick Pony AI Rating | A | A |
| Pace Trip Longshot | — | — |
| Connections Longshot | — | — |
| Situational Longshot | — | — |
| Speed | A | A |
| Early Pace | F | B |
| Mid Pace | D | A |
| Late Pace | C | A |
| Finish Pos | D | D |
| Dirt Speed | C | D |
| Turf Speed | B | A |
| Distance Speed | D | F |
| Trainer Effectiveness | D | C |
| Jockey Effectiveness | A | A |
| 3rd Party Ratings | A | A |
| Recent
Performance analysis from the horse's recent races, weighted to reflect current form. Sprint and Route FPS (Foot Per Second) measure pace efficiency over the horse's recent sprints and routes respectively. Grading scale: A = elite • B = above average • C = average • D = below average • F = poor • — = no data |
||
| Speed | A | A |
| Early Pace | F | A |
| Mid Pace | B | A |
| Late Pace | C | A |
| Sprint FPS | D | B |
| Route FPS | A | A |
| Trainer Effectiveness | D | C |
| Jockey Effectiveness | A | A |
| 3rd Party Ratings | A | A |
| Predictions
AI-generated projections for the upcoming race, derived from prior AI analysis for speed and pace trends, surface and distance suitability, and current conditions. Grading scale: A = elite • B = above average • C = average • D = below average • F = poor • — = no data |
||
| Speed | B | A |
| Early Pace | F | A |
| Mid Pace | C | A |
| Late Pace | C | C |
Chart Guide (2.0.36)
- Bubbles
- Color = surface: green (turf), brown (dirt), blue (synthetic)
- Top number = finishing position; bottom number in parentheses = starting post position
- Height above line = beaten lengths — closer means a smaller margin
- Border = track conditions: green (FST/GD/FM), yellow (WF/SL/YLD), red (SY/MY/FRZ/SFT/HVY)
- Connecting Line
- Solid = good conditions; dashed = bad conditions
- Line Symbol
- ▲ Triangle = sprint (7f or less); ● Circle = route (more than 7f)
- Days Between Races
- Small number above each bubble (e.g. 19d) = days since the previous race — helps spot freshness, layoffs, and tight scheduling.
- Shaded Band (Bollinger)
- Highlights volatility — a wider band means more variation in recent performance
- Performance Trend
- Straight line showing the overall performance direction — angled up = improving, angled down = declining
- Dashed Reference Line
- AI Opponent = AI analysis class-level par for the race
AI Model History Guide
- Lines
- Each solid line shows this horse’s model score over its last 10 races: blue = Mod1, green = Mod2, amber = Mod3.
- Dashed Lines
- Dashed lines represent the current race’s field average for each model — a score below the dashed line indicates the horse ranked below average in this model’s assessment.
- Higher is Stronger
- All three model scores are 0–100: a higher number means the model rates this horse more favorably among the field.
Mod1(W): 82 (1/8) Mod2(W): 75 (2/8) Mod3(W): 79 (3/8) Mod1-LS: 55 (6/8) Win Prob: 18.4% Value Score: 1.35 ★
Performance vs. Peers Guide
- Bars (per post)
- Blue = avg career performance • Amber = avg last 3 races • Green = last race (improved vs. avg) • Red = last race (declined vs. avg)
- Trend Line
- Angled line above the bars: rising = improving form • falling = declining form.
- Horizontal Line
- Field average — the mean career performance of all horses in this race.
- Color Circles
- Standard post-position colors below each lane — same as the Total Pace chart.
- Border
- Thicker border = this horse’s post position.
Figure Comparison
- Rating
- The three Pick Pony algorithm ratings (Algo 1, Algo 2, Algo 3) that make up the overall PP AI Rating — higher is a stronger contender rating.
- Speed
- Career average speed, recent 3-race average, and last-race speed figure — spot horses in improving or declining form.
- Pace
- Average Early (E1), Mid (E2), and Stretch (LP) pace figures — reveals pace-setters vs. closers vs. all-the-way types.
- This horse
- The horse whose stats card is open is highlighted with a darker column background.
Winning Profiles
- Axes
- X: Win % from last 10 starts — Y: In-the-money % (top-3 finishes) from last 10 starts.
- Quadrants
- Consistent Winners (top-right): high win & ITM — reliable performers.
Place Threats (top-left): boards often but doesn’t win often — good exacta/trifecta angles.
Streaky (bottom-right): wins occasionally, misses the board often — all-or-nothing.
Developing (bottom-left): still finding form — longshot territory. - Reference Lines
- Dashed lines mark field averages. Dots to the right win more; dots higher board more.
- This horse
- Highlighted with a gold border and larger dot.
AI Model Comparison
- Winner Models (green)
- Mod1(W), Mod2(W), and Mod3(W) trained to predict race winners. Higher score = stronger contender.
- Longshot Models (red)
- Mod1-LS, Mod2-LS, and Mod3-LS trained to find high-value longshots. Higher score = stronger longshot candidate.
- Form Model (blue)
- Mod4 sequence model trained on recent form patterns. Higher score = stronger recent form profile.
- This horse
- Highlighted with a darker column background.
Race Pace Simulation Guide
- Slider
- Drag left→right to advance from gate to finish. Drag all the way back to reset the race.
- Predicted Finish Order
- Factors in contested pace burn, each horse’s effort curve (peaked-early vs. peaked-late), and wide trip cost from outside posts. Updated live when Track Bias changes.
- Pace Scenario
- Lone Speed: single E horse likely rates and holds. Contested: two E horses burn each other — closers benefit. Hot Pace: speed meltdown, deep closers thrive. Soft: no early speed, moderate fractions throughout.
- Track Bias
- Slider below canvas. −2 = strong closer/wet bias; +2 = strong speed/rail bias. Recomputes the predicted finish order.
- Boxed Indicator
- Dashed orange ring = horse is surrounded (rival ahead, rival behind, wall outside). In a real race this horse must find a clear path to run.
- Running Styles
- E/EE = early speed (rushes to rail). P = presser (stalks the pace). S = stalker. SS = slow starter / closer.
| Stat | vs. Current Card | vs. All Horses |
|---|---|---|
| Averages
Career-average metrics across all AI race analysis. Performance and pace averages reflect estimated historical performance; trainer and jockey grades score in-the-money percentages. Grading scale: A = elite • B = above average • C = average • D = below average • F = poor • — = no data |
||
| Pick Pony AI Rating | A | A |
| Pace Trip Longshot | — | — |
| Connections Longshot | — | — |
| Situational Longshot | — | — |
| Speed | A | A |
| Early Pace | F | D |
| Mid Pace | D | B |
| Late Pace | B | A |
| Finish Pos | C | C |
| Dirt Speed | C | B |
| Turf Speed | A | A |
| Distance Speed | C | A |
| Trainer Effectiveness | B | D |
| Jockey Effectiveness | A | B |
| 3rd Party Ratings | A | A |
| Recent
Performance analysis from the horse's recent races, weighted to reflect current form. Sprint and Route FPS (Foot Per Second) measure pace efficiency over the horse's recent sprints and routes respectively. Grading scale: A = elite • B = above average • C = average • D = below average • F = poor • — = no data |
||
| Speed | A | A |
| Early Pace | C | C |
| Mid Pace | A | B |
| Late Pace | C | A |
| Sprint FPS | C | C |
| Route FPS | B | C |
| Trainer Effectiveness | B | D |
| Jockey Effectiveness | A | B |
| 3rd Party Ratings | A | A |
| Predictions
AI-generated projections for the upcoming race, derived from prior AI analysis for speed and pace trends, surface and distance suitability, and current conditions. Grading scale: A = elite • B = above average • C = average • D = below average • F = poor • — = no data |
||
| Speed | B | B |
| Early Pace | F | D |
| Mid Pace | F | B |
| Late Pace | C | C |
Chart Guide (2.0.36)
- Bubbles
- Color = surface: green (turf), brown (dirt), blue (synthetic)
- Top number = finishing position; bottom number in parentheses = starting post position
- Height above line = beaten lengths — closer means a smaller margin
- Border = track conditions: green (FST/GD/FM), yellow (WF/SL/YLD), red (SY/MY/FRZ/SFT/HVY)
- Connecting Line
- Solid = good conditions; dashed = bad conditions
- Line Symbol
- ▲ Triangle = sprint (7f or less); ● Circle = route (more than 7f)
- Days Between Races
- Small number above each bubble (e.g. 19d) = days since the previous race — helps spot freshness, layoffs, and tight scheduling.
- Shaded Band (Bollinger)
- Highlights volatility — a wider band means more variation in recent performance
- Performance Trend
- Straight line showing the overall performance direction — angled up = improving, angled down = declining
- Dashed Reference Line
- AI Opponent = AI analysis class-level par for the race
AI Model History Guide
- Lines
- Each solid line shows this horse’s model score over its last 10 races: blue = Mod1, green = Mod2, amber = Mod3.
- Dashed Lines
- Dashed lines represent the current race’s field average for each model — a score below the dashed line indicates the horse ranked below average in this model’s assessment.
- Higher is Stronger
- All three model scores are 0–100: a higher number means the model rates this horse more favorably among the field.
Mod1(W): 82 (1/8) Mod2(W): 75 (2/8) Mod3(W): 79 (3/8) Mod1-LS: 55 (6/8) Win Prob: 18.4% Value Score: 1.35 ★
Performance vs. Peers Guide
- Bars (per post)
- Blue = avg career performance • Amber = avg last 3 races • Green = last race (improved vs. avg) • Red = last race (declined vs. avg)
- Trend Line
- Angled line above the bars: rising = improving form • falling = declining form.
- Horizontal Line
- Field average — the mean career performance of all horses in this race.
- Color Circles
- Standard post-position colors below each lane — same as the Total Pace chart.
- Border
- Thicker border = this horse’s post position.
Figure Comparison
- Rating
- The three Pick Pony algorithm ratings (Algo 1, Algo 2, Algo 3) that make up the overall PP AI Rating — higher is a stronger contender rating.
- Speed
- Career average speed, recent 3-race average, and last-race speed figure — spot horses in improving or declining form.
- Pace
- Average Early (E1), Mid (E2), and Stretch (LP) pace figures — reveals pace-setters vs. closers vs. all-the-way types.
- This horse
- The horse whose stats card is open is highlighted with a darker column background.
Winning Profiles
- Axes
- X: Win % from last 10 starts — Y: In-the-money % (top-3 finishes) from last 10 starts.
- Quadrants
- Consistent Winners (top-right): high win & ITM — reliable performers.
Place Threats (top-left): boards often but doesn’t win often — good exacta/trifecta angles.
Streaky (bottom-right): wins occasionally, misses the board often — all-or-nothing.
Developing (bottom-left): still finding form — longshot territory. - Reference Lines
- Dashed lines mark field averages. Dots to the right win more; dots higher board more.
- This horse
- Highlighted with a gold border and larger dot.
AI Model Comparison
- Winner Models (green)
- Mod1(W), Mod2(W), and Mod3(W) trained to predict race winners. Higher score = stronger contender.
- Longshot Models (red)
- Mod1-LS, Mod2-LS, and Mod3-LS trained to find high-value longshots. Higher score = stronger longshot candidate.
- Form Model (blue)
- Mod4 sequence model trained on recent form patterns. Higher score = stronger recent form profile.
- This horse
- Highlighted with a darker column background.
Race Pace Simulation Guide
- Slider
- Drag left→right to advance from gate to finish. Drag all the way back to reset the race.
- Predicted Finish Order
- Factors in contested pace burn, each horse’s effort curve (peaked-early vs. peaked-late), and wide trip cost from outside posts. Updated live when Track Bias changes.
- Pace Scenario
- Lone Speed: single E horse likely rates and holds. Contested: two E horses burn each other — closers benefit. Hot Pace: speed meltdown, deep closers thrive. Soft: no early speed, moderate fractions throughout.
- Track Bias
- Slider below canvas. −2 = strong closer/wet bias; +2 = strong speed/rail bias. Recomputes the predicted finish order.
- Boxed Indicator
- Dashed orange ring = horse is surrounded (rival ahead, rival behind, wall outside). In a real race this horse must find a clear path to run.
- Running Styles
- E/EE = early speed (rushes to rail). P = presser (stalks the pace). S = stalker. SS = slow starter / closer.
| Stat | vs. Current Card | vs. All Horses |
|---|---|---|
| Averages
Career-average metrics across all AI race analysis. Performance and pace averages reflect estimated historical performance; trainer and jockey grades score in-the-money percentages. Grading scale: A = elite • B = above average • C = average • D = below average • F = poor • — = no data |
||
| Pick Pony AI Rating | A | A |
| Pace Trip Longshot | — | — |
| Connections Longshot | — | — |
| Situational Longshot | — | — |
| Speed | C | A |
| Early Pace | C | A |
| Mid Pace | C | A |
| Late Pace | A | A |
| Finish Pos | A | B |
| Dirt Speed | B | A |
| Turf Speed | A | A |
| Distance Speed | D | F |
| Trainer Effectiveness | C | C |
| Jockey Effectiveness | C | B |
| 3rd Party Ratings | A | A |
| Recent
Performance analysis from the horse's recent races, weighted to reflect current form. Sprint and Route FPS (Foot Per Second) measure pace efficiency over the horse's recent sprints and routes respectively. Grading scale: A = elite • B = above average • C = average • D = below average • F = poor • — = no data |
||
| Speed | A | A |
| Early Pace | B | A |
| Mid Pace | A | A |
| Late Pace | A | A |
| Sprint FPS | C | A |
| Route FPS | C | B |
| Trainer Effectiveness | C | C |
| Jockey Effectiveness | C | B |
| 3rd Party Ratings | A | A |
| Predictions
AI-generated projections for the upcoming race, derived from prior AI analysis for speed and pace trends, surface and distance suitability, and current conditions. Grading scale: A = elite • B = above average • C = average • D = below average • F = poor • — = no data |
||
| Speed | C | A |
| Early Pace | A | A |
| Mid Pace | D | A |
| Late Pace | C | C |
Chart Guide (2.0.36)
- Bubbles
- Color = surface: green (turf), brown (dirt), blue (synthetic)
- Top number = finishing position; bottom number in parentheses = starting post position
- Height above line = beaten lengths — closer means a smaller margin
- Border = track conditions: green (FST/GD/FM), yellow (WF/SL/YLD), red (SY/MY/FRZ/SFT/HVY)
- Connecting Line
- Solid = good conditions; dashed = bad conditions
- Line Symbol
- ▲ Triangle = sprint (7f or less); ● Circle = route (more than 7f)
- Days Between Races
- Small number above each bubble (e.g. 19d) = days since the previous race — helps spot freshness, layoffs, and tight scheduling.
- Shaded Band (Bollinger)
- Highlights volatility — a wider band means more variation in recent performance
- Performance Trend
- Straight line showing the overall performance direction — angled up = improving, angled down = declining
- Dashed Reference Line
- AI Opponent = AI analysis class-level par for the race
AI Model History Guide
- Lines
- Each solid line shows this horse’s model score over its last 10 races: blue = Mod1, green = Mod2, amber = Mod3.
- Dashed Lines
- Dashed lines represent the current race’s field average for each model — a score below the dashed line indicates the horse ranked below average in this model’s assessment.
- Higher is Stronger
- All three model scores are 0–100: a higher number means the model rates this horse more favorably among the field.
Mod1(W): 82 (1/8) Mod2(W): 75 (2/8) Mod3(W): 79 (3/8) Mod1-LS: 55 (6/8) Win Prob: 18.4% Value Score: 1.35 ★
Performance vs. Peers Guide
- Bars (per post)
- Blue = avg career performance • Amber = avg last 3 races • Green = last race (improved vs. avg) • Red = last race (declined vs. avg)
- Trend Line
- Angled line above the bars: rising = improving form • falling = declining form.
- Horizontal Line
- Field average — the mean career performance of all horses in this race.
- Color Circles
- Standard post-position colors below each lane — same as the Total Pace chart.
- Border
- Thicker border = this horse’s post position.
Figure Comparison
- Rating
- The three Pick Pony algorithm ratings (Algo 1, Algo 2, Algo 3) that make up the overall PP AI Rating — higher is a stronger contender rating.
- Speed
- Career average speed, recent 3-race average, and last-race speed figure — spot horses in improving or declining form.
- Pace
- Average Early (E1), Mid (E2), and Stretch (LP) pace figures — reveals pace-setters vs. closers vs. all-the-way types.
- This horse
- The horse whose stats card is open is highlighted with a darker column background.
Winning Profiles
- Axes
- X: Win % from last 10 starts — Y: In-the-money % (top-3 finishes) from last 10 starts.
- Quadrants
- Consistent Winners (top-right): high win & ITM — reliable performers.
Place Threats (top-left): boards often but doesn’t win often — good exacta/trifecta angles.
Streaky (bottom-right): wins occasionally, misses the board often — all-or-nothing.
Developing (bottom-left): still finding form — longshot territory. - Reference Lines
- Dashed lines mark field averages. Dots to the right win more; dots higher board more.
- This horse
- Highlighted with a gold border and larger dot.
AI Model Comparison
- Winner Models (green)
- Mod1(W), Mod2(W), and Mod3(W) trained to predict race winners. Higher score = stronger contender.
- Longshot Models (red)
- Mod1-LS, Mod2-LS, and Mod3-LS trained to find high-value longshots. Higher score = stronger longshot candidate.
- Form Model (blue)
- Mod4 sequence model trained on recent form patterns. Higher score = stronger recent form profile.
- This horse
- Highlighted with a darker column background.
Race Pace Simulation Guide
- Slider
- Drag left→right to advance from gate to finish. Drag all the way back to reset the race.
- Predicted Finish Order
- Factors in contested pace burn, each horse’s effort curve (peaked-early vs. peaked-late), and wide trip cost from outside posts. Updated live when Track Bias changes.
- Pace Scenario
- Lone Speed: single E horse likely rates and holds. Contested: two E horses burn each other — closers benefit. Hot Pace: speed meltdown, deep closers thrive. Soft: no early speed, moderate fractions throughout.
- Track Bias
- Slider below canvas. −2 = strong closer/wet bias; +2 = strong speed/rail bias. Recomputes the predicted finish order.
- Boxed Indicator
- Dashed orange ring = horse is surrounded (rival ahead, rival behind, wall outside). In a real race this horse must find a clear path to run.
- Running Styles
- E/EE = early speed (rushes to rail). P = presser (stalks the pace). S = stalker. SS = slow starter / closer.
| Stat | vs. Current Card | vs. All Horses |
|---|---|---|
| Averages
Career-average metrics across all AI race analysis. Performance and pace averages reflect estimated historical performance; trainer and jockey grades score in-the-money percentages. Grading scale: A = elite • B = above average • C = average • D = below average • F = poor • — = no data |
||
| Pick Pony AI Rating | B | B |
| Pace Trip Longshot | — | — |
| Connections Longshot | — | — |
| Situational Longshot | — | — |
| Speed | D | B |
| Early Pace | A | B |
| Mid Pace | B | B |
| Late Pace | C | B |
| Finish Pos | A | C |
| Dirt Speed | F | B |
| Turf Speed | D | D |
| Distance Speed | F | B |
| Trainer Effectiveness | A | C |
| Jockey Effectiveness | C | C |
| 3rd Party Ratings | B | B |
| Recent
Performance analysis from the horse's recent races, weighted to reflect current form. Sprint and Route FPS (Foot Per Second) measure pace efficiency over the horse's recent sprints and routes respectively. Grading scale: A = elite • B = above average • C = average • D = below average • F = poor • — = no data |
||
| Speed | B | B |
| Early Pace | D | C |
| Mid Pace | C | C |
| Late Pace | C | A |
| Sprint FPS | D | C |
| Route FPS | C | C |
| Trainer Effectiveness | A | C |
| Jockey Effectiveness | C | C |
| 3rd Party Ratings | B | B |
| Predictions
AI-generated projections for the upcoming race, derived from prior AI analysis for speed and pace trends, surface and distance suitability, and current conditions. Grading scale: A = elite • B = above average • C = average • D = below average • F = poor • — = no data |
||
| Speed | D | C |
| Early Pace | A | B |
| Mid Pace | B | B |
| Late Pace | C | C |
Chart Guide (2.0.36)
- Bubbles
- Color = surface: green (turf), brown (dirt), blue (synthetic)
- Top number = finishing position; bottom number in parentheses = starting post position
- Height above line = beaten lengths — closer means a smaller margin
- Border = track conditions: green (FST/GD/FM), yellow (WF/SL/YLD), red (SY/MY/FRZ/SFT/HVY)
- Connecting Line
- Solid = good conditions; dashed = bad conditions
- Line Symbol
- ▲ Triangle = sprint (7f or less); ● Circle = route (more than 7f)
- Days Between Races
- Small number above each bubble (e.g. 19d) = days since the previous race — helps spot freshness, layoffs, and tight scheduling.
- Shaded Band (Bollinger)
- Highlights volatility — a wider band means more variation in recent performance
- Performance Trend
- Straight line showing the overall performance direction — angled up = improving, angled down = declining
- Dashed Reference Line
- AI Opponent = AI analysis class-level par for the race
AI Model History Guide
- Lines
- Each solid line shows this horse’s model score over its last 10 races: blue = Mod1, green = Mod2, amber = Mod3.
- Dashed Lines
- Dashed lines represent the current race’s field average for each model — a score below the dashed line indicates the horse ranked below average in this model’s assessment.
- Higher is Stronger
- All three model scores are 0–100: a higher number means the model rates this horse more favorably among the field.
Mod1(W): 82 (1/8) Mod2(W): 75 (2/8) Mod3(W): 79 (3/8) Mod1-LS: 55 (6/8) Win Prob: 18.4% Value Score: 1.35 ★
Performance vs. Peers Guide
- Bars (per post)
- Blue = avg career performance • Amber = avg last 3 races • Green = last race (improved vs. avg) • Red = last race (declined vs. avg)
- Trend Line
- Angled line above the bars: rising = improving form • falling = declining form.
- Horizontal Line
- Field average — the mean career performance of all horses in this race.
- Color Circles
- Standard post-position colors below each lane — same as the Total Pace chart.
- Border
- Thicker border = this horse’s post position.
Figure Comparison
- Rating
- The three Pick Pony algorithm ratings (Algo 1, Algo 2, Algo 3) that make up the overall PP AI Rating — higher is a stronger contender rating.
- Speed
- Career average speed, recent 3-race average, and last-race speed figure — spot horses in improving or declining form.
- Pace
- Average Early (E1), Mid (E2), and Stretch (LP) pace figures — reveals pace-setters vs. closers vs. all-the-way types.
- This horse
- The horse whose stats card is open is highlighted with a darker column background.
Winning Profiles
- Axes
- X: Win % from last 10 starts — Y: In-the-money % (top-3 finishes) from last 10 starts.
- Quadrants
- Consistent Winners (top-right): high win & ITM — reliable performers.
Place Threats (top-left): boards often but doesn’t win often — good exacta/trifecta angles.
Streaky (bottom-right): wins occasionally, misses the board often — all-or-nothing.
Developing (bottom-left): still finding form — longshot territory. - Reference Lines
- Dashed lines mark field averages. Dots to the right win more; dots higher board more.
- This horse
- Highlighted with a gold border and larger dot.
AI Model Comparison
- Winner Models (green)
- Mod1(W), Mod2(W), and Mod3(W) trained to predict race winners. Higher score = stronger contender.
- Longshot Models (red)
- Mod1-LS, Mod2-LS, and Mod3-LS trained to find high-value longshots. Higher score = stronger longshot candidate.
- Form Model (blue)
- Mod4 sequence model trained on recent form patterns. Higher score = stronger recent form profile.
- This horse
- Highlighted with a darker column background.
Race Pace Simulation Guide
- Slider
- Drag left→right to advance from gate to finish. Drag all the way back to reset the race.
- Predicted Finish Order
- Factors in contested pace burn, each horse’s effort curve (peaked-early vs. peaked-late), and wide trip cost from outside posts. Updated live when Track Bias changes.
- Pace Scenario
- Lone Speed: single E horse likely rates and holds. Contested: two E horses burn each other — closers benefit. Hot Pace: speed meltdown, deep closers thrive. Soft: no early speed, moderate fractions throughout.
- Track Bias
- Slider below canvas. −2 = strong closer/wet bias; +2 = strong speed/rail bias. Recomputes the predicted finish order.
- Boxed Indicator
- Dashed orange ring = horse is surrounded (rival ahead, rival behind, wall outside). In a real race this horse must find a clear path to run.
- Running Styles
- E/EE = early speed (rushes to rail). P = presser (stalks the pace). S = stalker. SS = slow starter / closer.
| Stat | vs. Current Card | vs. All Horses |
|---|---|---|
| Averages
Career-average metrics across all AI race analysis. Performance and pace averages reflect estimated historical performance; trainer and jockey grades score in-the-money percentages. Grading scale: A = elite • B = above average • C = average • D = below average • F = poor • — = no data |
||
| Pick Pony AI Rating | F | F |
| Pace Trip Longshot | — | — |
| Connections Longshot | — | — |
| Situational Longshot | — | — |
| Speed | F | D |
| Early Pace | C | C |
| Mid Pace | F | C |
| Late Pace | F | C |
| Finish Pos | F | D |
| Dirt Speed | D | B |
| Turf Speed | D | D |
| Distance Speed | D | B |
| Trainer Effectiveness | D | D |
| Jockey Effectiveness | D | D |
| 3rd Party Ratings | F | C |
| Recent
Performance analysis from the horse's recent races, weighted to reflect current form. Sprint and Route FPS (Foot Per Second) measure pace efficiency over the horse's recent sprints and routes respectively. Grading scale: A = elite • B = above average • C = average • D = below average • F = poor • — = no data |
||
| Speed | D | B |
| Early Pace | A | C |
| Mid Pace | D | C |
| Late Pace | D | B |
| Sprint FPS | B | C |
| Route FPS | D | C |
| Trainer Effectiveness | D | D |
| Jockey Effectiveness | D | D |
| 3rd Party Ratings | F | C |
| Predictions
AI-generated projections for the upcoming race, derived from prior AI analysis for speed and pace trends, surface and distance suitability, and current conditions. Grading scale: A = elite • B = above average • C = average • D = below average • F = poor • — = no data |
||
| Speed | F | D |
| Early Pace | C | B |
| Mid Pace | D | B |
| Late Pace | C | C |
Chart Guide (2.0.36)
- Bubbles
- Color = surface: green (turf), brown (dirt), blue (synthetic)
- Top number = finishing position; bottom number in parentheses = starting post position
- Height above line = beaten lengths — closer means a smaller margin
- Border = track conditions: green (FST/GD/FM), yellow (WF/SL/YLD), red (SY/MY/FRZ/SFT/HVY)
- Connecting Line
- Solid = good conditions; dashed = bad conditions
- Line Symbol
- ▲ Triangle = sprint (7f or less); ● Circle = route (more than 7f)
- Days Between Races
- Small number above each bubble (e.g. 19d) = days since the previous race — helps spot freshness, layoffs, and tight scheduling.
- Shaded Band (Bollinger)
- Highlights volatility — a wider band means more variation in recent performance
- Performance Trend
- Straight line showing the overall performance direction — angled up = improving, angled down = declining
- Dashed Reference Line
- AI Opponent = AI analysis class-level par for the race
AI Model History Guide
- Lines
- Each solid line shows this horse’s model score over its last 10 races: blue = Mod1, green = Mod2, amber = Mod3.
- Dashed Lines
- Dashed lines represent the current race’s field average for each model — a score below the dashed line indicates the horse ranked below average in this model’s assessment.
- Higher is Stronger
- All three model scores are 0–100: a higher number means the model rates this horse more favorably among the field.
Mod1(W): 82 (1/8) Mod2(W): 75 (2/8) Mod3(W): 79 (3/8) Mod1-LS: 55 (6/8) Win Prob: 18.4% Value Score: 1.35 ★
Performance vs. Peers Guide
- Bars (per post)
- Blue = avg career performance • Amber = avg last 3 races • Green = last race (improved vs. avg) • Red = last race (declined vs. avg)
- Trend Line
- Angled line above the bars: rising = improving form • falling = declining form.
- Horizontal Line
- Field average — the mean career performance of all horses in this race.
- Color Circles
- Standard post-position colors below each lane — same as the Total Pace chart.
- Border
- Thicker border = this horse’s post position.
Figure Comparison
- Rating
- The three Pick Pony algorithm ratings (Algo 1, Algo 2, Algo 3) that make up the overall PP AI Rating — higher is a stronger contender rating.
- Speed
- Career average speed, recent 3-race average, and last-race speed figure — spot horses in improving or declining form.
- Pace
- Average Early (E1), Mid (E2), and Stretch (LP) pace figures — reveals pace-setters vs. closers vs. all-the-way types.
- This horse
- The horse whose stats card is open is highlighted with a darker column background.
Winning Profiles
- Axes
- X: Win % from last 10 starts — Y: In-the-money % (top-3 finishes) from last 10 starts.
- Quadrants
- Consistent Winners (top-right): high win & ITM — reliable performers.
Place Threats (top-left): boards often but doesn’t win often — good exacta/trifecta angles.
Streaky (bottom-right): wins occasionally, misses the board often — all-or-nothing.
Developing (bottom-left): still finding form — longshot territory. - Reference Lines
- Dashed lines mark field averages. Dots to the right win more; dots higher board more.
- This horse
- Highlighted with a gold border and larger dot.
AI Model Comparison
- Winner Models (green)
- Mod1(W), Mod2(W), and Mod3(W) trained to predict race winners. Higher score = stronger contender.
- Longshot Models (red)
- Mod1-LS, Mod2-LS, and Mod3-LS trained to find high-value longshots. Higher score = stronger longshot candidate.
- Form Model (blue)
- Mod4 sequence model trained on recent form patterns. Higher score = stronger recent form profile.
- This horse
- Highlighted with a darker column background.
Race Pace Simulation Guide
- Slider
- Drag left→right to advance from gate to finish. Drag all the way back to reset the race.
- Predicted Finish Order
- Factors in contested pace burn, each horse’s effort curve (peaked-early vs. peaked-late), and wide trip cost from outside posts. Updated live when Track Bias changes.
- Pace Scenario
- Lone Speed: single E horse likely rates and holds. Contested: two E horses burn each other — closers benefit. Hot Pace: speed meltdown, deep closers thrive. Soft: no early speed, moderate fractions throughout.
- Track Bias
- Slider below canvas. −2 = strong closer/wet bias; +2 = strong speed/rail bias. Recomputes the predicted finish order.
- Boxed Indicator
- Dashed orange ring = horse is surrounded (rival ahead, rival behind, wall outside). In a real race this horse must find a clear path to run.
- Running Styles
- E/EE = early speed (rushes to rail). P = presser (stalks the pace). S = stalker. SS = slow starter / closer.
| Stat | vs. Current Card | vs. All Horses |
|---|---|---|
| Averages
Career-average metrics across all AI race analysis. Performance and pace averages reflect estimated historical performance; trainer and jockey grades score in-the-money percentages. Grading scale: A = elite • B = above average • C = average • D = below average • F = poor • — = no data |
||
| Pick Pony AI Rating | B | A |
| Pace Trip Longshot | — | — |
| Connections Longshot | — | — |
| Situational Longshot | — | — |
| Speed | C | A |
| Early Pace | B | A |
| Mid Pace | A | A |
| Late Pace | D | A |
| Finish Pos | D | D |
| Dirt Speed | A | A |
| Turf Speed | F | A |
| Distance Speed | D | F |
| Trainer Effectiveness | A | A |
| Jockey Effectiveness | A | A |
| 3rd Party Ratings | C | A |
| Recent
Performance analysis from the horse's recent races, weighted to reflect current form. Sprint and Route FPS (Foot Per Second) measure pace efficiency over the horse's recent sprints and routes respectively. Grading scale: A = elite • B = above average • C = average • D = below average • F = poor • — = no data |
||
| Speed | F | A |
| Early Pace | C | A |
| Mid Pace | C | A |
| Late Pace | F | C |
| Sprint FPS | A | A |
| Route FPS | B | A |
| Trainer Effectiveness | A | A |
| Jockey Effectiveness | A | A |
| 3rd Party Ratings | C | A |
| Predictions
AI-generated projections for the upcoming race, derived from prior AI analysis for speed and pace trends, surface and distance suitability, and current conditions. Grading scale: A = elite • B = above average • C = average • D = below average • F = poor • — = no data |
||
| Speed | C | A |
| Early Pace | C | A |
| Mid Pace | A | A |
| Late Pace | C | C |
Chart Guide (2.0.36)
- Bubbles
- Color = surface: green (turf), brown (dirt), blue (synthetic)
- Top number = finishing position; bottom number in parentheses = starting post position
- Height above line = beaten lengths — closer means a smaller margin
- Border = track conditions: green (FST/GD/FM), yellow (WF/SL/YLD), red (SY/MY/FRZ/SFT/HVY)
- Connecting Line
- Solid = good conditions; dashed = bad conditions
- Line Symbol
- ▲ Triangle = sprint (7f or less); ● Circle = route (more than 7f)
- Days Between Races
- Small number above each bubble (e.g. 19d) = days since the previous race — helps spot freshness, layoffs, and tight scheduling.
- Shaded Band (Bollinger)
- Highlights volatility — a wider band means more variation in recent performance
- Performance Trend
- Straight line showing the overall performance direction — angled up = improving, angled down = declining
- Dashed Reference Line
- AI Opponent = AI analysis class-level par for the race
AI Model History Guide
- Lines
- Each solid line shows this horse’s model score over its last 10 races: blue = Mod1, green = Mod2, amber = Mod3.
- Dashed Lines
- Dashed lines represent the current race’s field average for each model — a score below the dashed line indicates the horse ranked below average in this model’s assessment.
- Higher is Stronger
- All three model scores are 0–100: a higher number means the model rates this horse more favorably among the field.
Mod1(W): 82 (1/8) Mod2(W): 75 (2/8) Mod3(W): 79 (3/8) Mod1-LS: 55 (6/8) Win Prob: 18.4% Value Score: 1.35 ★
Performance vs. Peers Guide
- Bars (per post)
- Blue = avg career performance • Amber = avg last 3 races • Green = last race (improved vs. avg) • Red = last race (declined vs. avg)
- Trend Line
- Angled line above the bars: rising = improving form • falling = declining form.
- Horizontal Line
- Field average — the mean career performance of all horses in this race.
- Color Circles
- Standard post-position colors below each lane — same as the Total Pace chart.
- Border
- Thicker border = this horse’s post position.
Figure Comparison
- Rating
- The three Pick Pony algorithm ratings (Algo 1, Algo 2, Algo 3) that make up the overall PP AI Rating — higher is a stronger contender rating.
- Speed
- Career average speed, recent 3-race average, and last-race speed figure — spot horses in improving or declining form.
- Pace
- Average Early (E1), Mid (E2), and Stretch (LP) pace figures — reveals pace-setters vs. closers vs. all-the-way types.
- This horse
- The horse whose stats card is open is highlighted with a darker column background.
Winning Profiles
- Axes
- X: Win % from last 10 starts — Y: In-the-money % (top-3 finishes) from last 10 starts.
- Quadrants
- Consistent Winners (top-right): high win & ITM — reliable performers.
Place Threats (top-left): boards often but doesn’t win often — good exacta/trifecta angles.
Streaky (bottom-right): wins occasionally, misses the board often — all-or-nothing.
Developing (bottom-left): still finding form — longshot territory. - Reference Lines
- Dashed lines mark field averages. Dots to the right win more; dots higher board more.
- This horse
- Highlighted with a gold border and larger dot.
AI Model Comparison
- Winner Models (green)
- Mod1(W), Mod2(W), and Mod3(W) trained to predict race winners. Higher score = stronger contender.
- Longshot Models (red)
- Mod1-LS, Mod2-LS, and Mod3-LS trained to find high-value longshots. Higher score = stronger longshot candidate.
- Form Model (blue)
- Mod4 sequence model trained on recent form patterns. Higher score = stronger recent form profile.
- This horse
- Highlighted with a darker column background.
Race Pace Simulation Guide
- Slider
- Drag left→right to advance from gate to finish. Drag all the way back to reset the race.
- Predicted Finish Order
- Factors in contested pace burn, each horse’s effort curve (peaked-early vs. peaked-late), and wide trip cost from outside posts. Updated live when Track Bias changes.
- Pace Scenario
- Lone Speed: single E horse likely rates and holds. Contested: two E horses burn each other — closers benefit. Hot Pace: speed meltdown, deep closers thrive. Soft: no early speed, moderate fractions throughout.
- Track Bias
- Slider below canvas. −2 = strong closer/wet bias; +2 = strong speed/rail bias. Recomputes the predicted finish order.
- Boxed Indicator
- Dashed orange ring = horse is surrounded (rival ahead, rival behind, wall outside). In a real race this horse must find a clear path to run.
- Running Styles
- E/EE = early speed (rushes to rail). P = presser (stalks the pace). S = stalker. SS = slow starter / closer.
| Stat | vs. Current Card | vs. All Horses |
|---|---|---|
| Averages
Career-average metrics across all AI race analysis. Performance and pace averages reflect estimated historical performance; trainer and jockey grades score in-the-money percentages. Grading scale: A = elite • B = above average • C = average • D = below average • F = poor • — = no data |
||
| Pick Pony AI Rating | D | D |
| Pace Trip Longshot | — | — |
| Connections Longshot | — | — |
| Situational Longshot | — | — |
| Speed | B | A |
| Early Pace | B | B |
| Mid Pace | A | B |
| Late Pace | A | A |
| Finish Pos | C | C |
| Dirt Speed | B | A |
| Turf Speed | A | A |
| Distance Speed | A | A |
| Trainer Effectiveness | A | C |
| Jockey Effectiveness | B | C |
| 3rd Party Ratings | D | C |
| Recent
Performance analysis from the horse's recent races, weighted to reflect current form. Sprint and Route FPS (Foot Per Second) measure pace efficiency over the horse's recent sprints and routes respectively. Grading scale: A = elite • B = above average • C = average • D = below average • F = poor • — = no data |
||
| Speed | C | B |
| Early Pace | C | C |
| Mid Pace | B | C |
| Late Pace | A | A |
| Sprint FPS | F | D |
| Route FPS | F | D |
| Trainer Effectiveness | A | C |
| Jockey Effectiveness | B | C |
| 3rd Party Ratings | D | C |
| Predictions
AI-generated projections for the upcoming race, derived from prior AI analysis for speed and pace trends, surface and distance suitability, and current conditions. Grading scale: A = elite • B = above average • C = average • D = below average • F = poor • — = no data |
||
| Speed | C | B |
| Early Pace | A | B |
| Mid Pace | A | B |
| Late Pace | C | C |
Chart Guide (2.0.36)
- Bubbles
- Color = surface: green (turf), brown (dirt), blue (synthetic)
- Top number = finishing position; bottom number in parentheses = starting post position
- Height above line = beaten lengths — closer means a smaller margin
- Border = track conditions: green (FST/GD/FM), yellow (WF/SL/YLD), red (SY/MY/FRZ/SFT/HVY)
- Connecting Line
- Solid = good conditions; dashed = bad conditions
- Line Symbol
- ▲ Triangle = sprint (7f or less); ● Circle = route (more than 7f)
- Days Between Races
- Small number above each bubble (e.g. 19d) = days since the previous race — helps spot freshness, layoffs, and tight scheduling.
- Shaded Band (Bollinger)
- Highlights volatility — a wider band means more variation in recent performance
- Performance Trend
- Straight line showing the overall performance direction — angled up = improving, angled down = declining
- Dashed Reference Line
- AI Opponent = AI analysis class-level par for the race
AI Model History Guide
- Lines
- Each solid line shows this horse’s model score over its last 10 races: blue = Mod1, green = Mod2, amber = Mod3.
- Dashed Lines
- Dashed lines represent the current race’s field average for each model — a score below the dashed line indicates the horse ranked below average in this model’s assessment.
- Higher is Stronger
- All three model scores are 0–100: a higher number means the model rates this horse more favorably among the field.
Mod1(W): 82 (1/8) Mod2(W): 75 (2/8) Mod3(W): 79 (3/8) Mod1-LS: 55 (6/8) Win Prob: 18.4% Value Score: 1.35 ★
Performance vs. Peers Guide
- Bars (per post)
- Blue = avg career performance • Amber = avg last 3 races • Green = last race (improved vs. avg) • Red = last race (declined vs. avg)
- Trend Line
- Angled line above the bars: rising = improving form • falling = declining form.
- Horizontal Line
- Field average — the mean career performance of all horses in this race.
- Color Circles
- Standard post-position colors below each lane — same as the Total Pace chart.
- Border
- Thicker border = this horse’s post position.
Figure Comparison
- Rating
- The three Pick Pony algorithm ratings (Algo 1, Algo 2, Algo 3) that make up the overall PP AI Rating — higher is a stronger contender rating.
- Speed
- Career average speed, recent 3-race average, and last-race speed figure — spot horses in improving or declining form.
- Pace
- Average Early (E1), Mid (E2), and Stretch (LP) pace figures — reveals pace-setters vs. closers vs. all-the-way types.
- This horse
- The horse whose stats card is open is highlighted with a darker column background.
Winning Profiles
- Axes
- X: Win % from last 10 starts — Y: In-the-money % (top-3 finishes) from last 10 starts.
- Quadrants
- Consistent Winners (top-right): high win & ITM — reliable performers.
Place Threats (top-left): boards often but doesn’t win often — good exacta/trifecta angles.
Streaky (bottom-right): wins occasionally, misses the board often — all-or-nothing.
Developing (bottom-left): still finding form — longshot territory. - Reference Lines
- Dashed lines mark field averages. Dots to the right win more; dots higher board more.
- This horse
- Highlighted with a gold border and larger dot.
AI Model Comparison
- Winner Models (green)
- Mod1(W), Mod2(W), and Mod3(W) trained to predict race winners. Higher score = stronger contender.
- Longshot Models (red)
- Mod1-LS, Mod2-LS, and Mod3-LS trained to find high-value longshots. Higher score = stronger longshot candidate.
- Form Model (blue)
- Mod4 sequence model trained on recent form patterns. Higher score = stronger recent form profile.
- This horse
- Highlighted with a darker column background.
Race Pace Simulation Guide
- Slider
- Drag left→right to advance from gate to finish. Drag all the way back to reset the race.
- Predicted Finish Order
- Factors in contested pace burn, each horse’s effort curve (peaked-early vs. peaked-late), and wide trip cost from outside posts. Updated live when Track Bias changes.
- Pace Scenario
- Lone Speed: single E horse likely rates and holds. Contested: two E horses burn each other — closers benefit. Hot Pace: speed meltdown, deep closers thrive. Soft: no early speed, moderate fractions throughout.
- Track Bias
- Slider below canvas. −2 = strong closer/wet bias; +2 = strong speed/rail bias. Recomputes the predicted finish order.
- Boxed Indicator
- Dashed orange ring = horse is surrounded (rival ahead, rival behind, wall outside). In a real race this horse must find a clear path to run.
- Running Styles
- E/EE = early speed (rushes to rail). P = presser (stalks the pace). S = stalker. SS = slow starter / closer.
| Stat | vs. Current Card | vs. All Horses |
|---|---|---|
| Averages
Career-average metrics across all AI race analysis. Performance and pace averages reflect estimated historical performance; trainer and jockey grades score in-the-money percentages. Grading scale: A = elite • B = above average • C = average • D = below average • F = poor • — = no data |
||
| Pick Pony AI Rating | C | B |
| Pace Trip Longshot | — | — |
| Connections Longshot | — | — |
| Situational Longshot | — | — |
| Speed | B | A |
| Early Pace | A | A |
| Mid Pace | A | A |
| Late Pace | F | A |
| Finish Pos | B | B |
| Dirt Speed | D | F |
| Turf Speed | D | A |
| Distance Speed | B | A |
| Trainer Effectiveness | B | A |
| Jockey Effectiveness | D | C |
| 3rd Party Ratings | C | A |
| Recent
Performance analysis from the horse's recent races, weighted to reflect current form. Sprint and Route FPS (Foot Per Second) measure pace efficiency over the horse's recent sprints and routes respectively. Grading scale: A = elite • B = above average • C = average • D = below average • F = poor • — = no data |
||
| Speed | C | A |
| Early Pace | B | A |
| Mid Pace | A | A |
| Late Pace | D | A |
| Sprint FPS | A | A |
| Route FPS | C | A |
| Trainer Effectiveness | B | A |
| Jockey Effectiveness | D | C |
| 3rd Party Ratings | C | A |
| Predictions
AI-generated projections for the upcoming race, derived from prior AI analysis for speed and pace trends, surface and distance suitability, and current conditions. Grading scale: A = elite • B = above average • C = average • D = below average • F = poor • — = no data |
||
| Speed | A | A |
| Early Pace | A | A |
| Mid Pace | A | A |
| Late Pace | C | C |
Chart Guide (2.0.36)
- Bubbles
- Color = surface: green (turf), brown (dirt), blue (synthetic)
- Top number = finishing position; bottom number in parentheses = starting post position
- Height above line = beaten lengths — closer means a smaller margin
- Border = track conditions: green (FST/GD/FM), yellow (WF/SL/YLD), red (SY/MY/FRZ/SFT/HVY)
- Connecting Line
- Solid = good conditions; dashed = bad conditions
- Line Symbol
- ▲ Triangle = sprint (7f or less); ● Circle = route (more than 7f)
- Days Between Races
- Small number above each bubble (e.g. 19d) = days since the previous race — helps spot freshness, layoffs, and tight scheduling.
- Shaded Band (Bollinger)
- Highlights volatility — a wider band means more variation in recent performance
- Performance Trend
- Straight line showing the overall performance direction — angled up = improving, angled down = declining
- Dashed Reference Line
- AI Opponent = AI analysis class-level par for the race
AI Model History Guide
- Lines
- Each solid line shows this horse’s model score over its last 10 races: blue = Mod1, green = Mod2, amber = Mod3.
- Dashed Lines
- Dashed lines represent the current race’s field average for each model — a score below the dashed line indicates the horse ranked below average in this model’s assessment.
- Higher is Stronger
- All three model scores are 0–100: a higher number means the model rates this horse more favorably among the field.
Mod1(W): 82 (1/8) Mod2(W): 75 (2/8) Mod3(W): 79 (3/8) Mod1-LS: 55 (6/8) Win Prob: 18.4% Value Score: 1.35 ★
Performance vs. Peers Guide
- Bars (per post)
- Blue = avg career performance • Amber = avg last 3 races • Green = last race (improved vs. avg) • Red = last race (declined vs. avg)
- Trend Line
- Angled line above the bars: rising = improving form • falling = declining form.
- Horizontal Line
- Field average — the mean career performance of all horses in this race.
- Color Circles
- Standard post-position colors below each lane — same as the Total Pace chart.
- Border
- Thicker border = this horse’s post position.
Figure Comparison
- Rating
- The three Pick Pony algorithm ratings (Algo 1, Algo 2, Algo 3) that make up the overall PP AI Rating — higher is a stronger contender rating.
- Speed
- Career average speed, recent 3-race average, and last-race speed figure — spot horses in improving or declining form.
- Pace
- Average Early (E1), Mid (E2), and Stretch (LP) pace figures — reveals pace-setters vs. closers vs. all-the-way types.
- This horse
- The horse whose stats card is open is highlighted with a darker column background.
Winning Profiles
- Axes
- X: Win % from last 10 starts — Y: In-the-money % (top-3 finishes) from last 10 starts.
- Quadrants
- Consistent Winners (top-right): high win & ITM — reliable performers.
Place Threats (top-left): boards often but doesn’t win often — good exacta/trifecta angles.
Streaky (bottom-right): wins occasionally, misses the board often — all-or-nothing.
Developing (bottom-left): still finding form — longshot territory. - Reference Lines
- Dashed lines mark field averages. Dots to the right win more; dots higher board more.
- This horse
- Highlighted with a gold border and larger dot.
AI Model Comparison
- Winner Models (green)
- Mod1(W), Mod2(W), and Mod3(W) trained to predict race winners. Higher score = stronger contender.
- Longshot Models (red)
- Mod1-LS, Mod2-LS, and Mod3-LS trained to find high-value longshots. Higher score = stronger longshot candidate.
- Form Model (blue)
- Mod4 sequence model trained on recent form patterns. Higher score = stronger recent form profile.
- This horse
- Highlighted with a darker column background.
Race Pace Simulation Guide
- Slider
- Drag left→right to advance from gate to finish. Drag all the way back to reset the race.
- Predicted Finish Order
- Factors in contested pace burn, each horse’s effort curve (peaked-early vs. peaked-late), and wide trip cost from outside posts. Updated live when Track Bias changes.
- Pace Scenario
- Lone Speed: single E horse likely rates and holds. Contested: two E horses burn each other — closers benefit. Hot Pace: speed meltdown, deep closers thrive. Soft: no early speed, moderate fractions throughout.
- Track Bias
- Slider below canvas. −2 = strong closer/wet bias; +2 = strong speed/rail bias. Recomputes the predicted finish order.
- Boxed Indicator
- Dashed orange ring = horse is surrounded (rival ahead, rival behind, wall outside). In a real race this horse must find a clear path to run.
- Running Styles
- E/EE = early speed (rushes to rail). P = presser (stalks the pace). S = stalker. SS = slow starter / closer.
| Stat | vs. Current Card | vs. All Horses |
|---|---|---|
| Averages
Career-average metrics across all AI race analysis. Performance and pace averages reflect estimated historical performance; trainer and jockey grades score in-the-money percentages. Grading scale: A = elite • B = above average • C = average • D = below average • F = poor • — = no data |
||
| Pick Pony AI Rating | D | C |
| Pace Trip Longshot | — | — |
| Connections Longshot | — | — |
| Situational Longshot | — | — |
| Speed | D | A |
| Early Pace | C | A |
| Mid Pace | C | A |
| Late Pace | C | A |
| Finish Pos | C | C |
| Dirt Speed | C | D |
| Turf Speed | C | A |
| Distance Speed | A | A |
| Trainer Effectiveness | A | A |
| Jockey Effectiveness | B | A |
| 3rd Party Ratings | D | A |
| Recent
Performance analysis from the horse's recent races, weighted to reflect current form. Sprint and Route FPS (Foot Per Second) measure pace efficiency over the horse's recent sprints and routes respectively. Grading scale: A = elite • B = above average • C = average • D = below average • F = poor • — = no data |
||
| Speed | C | A |
| Early Pace | A | A |
| Mid Pace | D | A |
| Late Pace | C | A |
| Sprint FPS | B | A |
| Route FPS | A | A |
| Trainer Effectiveness | A | A |
| Jockey Effectiveness | B | A |
| 3rd Party Ratings | D | A |
| Predictions
AI-generated projections for the upcoming race, derived from prior AI analysis for speed and pace trends, surface and distance suitability, and current conditions. Grading scale: A = elite • B = above average • C = average • D = below average • F = poor • — = no data |
||
| Speed | D | A |
| Early Pace | C | A |
| Mid Pace | C | A |
| Late Pace | C | C |
Chart Guide (2.0.36)
- Bubbles
- Color = surface: green (turf), brown (dirt), blue (synthetic)
- Top number = finishing position; bottom number in parentheses = starting post position
- Height above line = beaten lengths — closer means a smaller margin
- Border = track conditions: green (FST/GD/FM), yellow (WF/SL/YLD), red (SY/MY/FRZ/SFT/HVY)
- Connecting Line
- Solid = good conditions; dashed = bad conditions
- Line Symbol
- ▲ Triangle = sprint (7f or less); ● Circle = route (more than 7f)
- Days Between Races
- Small number above each bubble (e.g. 19d) = days since the previous race — helps spot freshness, layoffs, and tight scheduling.
- Shaded Band (Bollinger)
- Highlights volatility — a wider band means more variation in recent performance
- Performance Trend
- Straight line showing the overall performance direction — angled up = improving, angled down = declining
- Dashed Reference Line
- AI Opponent = AI analysis class-level par for the race
AI Model History Guide
- Lines
- Each solid line shows this horse’s model score over its last 10 races: blue = Mod1, green = Mod2, amber = Mod3.
- Dashed Lines
- Dashed lines represent the current race’s field average for each model — a score below the dashed line indicates the horse ranked below average in this model’s assessment.
- Higher is Stronger
- All three model scores are 0–100: a higher number means the model rates this horse more favorably among the field.
Mod1(W): 82 (1/8) Mod2(W): 75 (2/8) Mod3(W): 79 (3/8) Mod1-LS: 55 (6/8) Win Prob: 18.4% Value Score: 1.35 ★
Performance vs. Peers Guide
- Bars (per post)
- Blue = avg career performance • Amber = avg last 3 races • Green = last race (improved vs. avg) • Red = last race (declined vs. avg)
- Trend Line
- Angled line above the bars: rising = improving form • falling = declining form.
- Horizontal Line
- Field average — the mean career performance of all horses in this race.
- Color Circles
- Standard post-position colors below each lane — same as the Total Pace chart.
- Border
- Thicker border = this horse’s post position.
Figure Comparison
- Rating
- The three Pick Pony algorithm ratings (Algo 1, Algo 2, Algo 3) that make up the overall PP AI Rating — higher is a stronger contender rating.
- Speed
- Career average speed, recent 3-race average, and last-race speed figure — spot horses in improving or declining form.
- Pace
- Average Early (E1), Mid (E2), and Stretch (LP) pace figures — reveals pace-setters vs. closers vs. all-the-way types.
- This horse
- The horse whose stats card is open is highlighted with a darker column background.
Winning Profiles
- Axes
- X: Win % from last 10 starts — Y: In-the-money % (top-3 finishes) from last 10 starts.
- Quadrants
- Consistent Winners (top-right): high win & ITM — reliable performers.
Place Threats (top-left): boards often but doesn’t win often — good exacta/trifecta angles.
Streaky (bottom-right): wins occasionally, misses the board often — all-or-nothing.
Developing (bottom-left): still finding form — longshot territory. - Reference Lines
- Dashed lines mark field averages. Dots to the right win more; dots higher board more.
- This horse
- Highlighted with a gold border and larger dot.
AI Model Comparison
- Winner Models (green)
- Mod1(W), Mod2(W), and Mod3(W) trained to predict race winners. Higher score = stronger contender.
- Longshot Models (red)
- Mod1-LS, Mod2-LS, and Mod3-LS trained to find high-value longshots. Higher score = stronger longshot candidate.
- Form Model (blue)
- Mod4 sequence model trained on recent form patterns. Higher score = stronger recent form profile.
- This horse
- Highlighted with a darker column background.
Race Pace Simulation Guide
- Slider
- Drag left→right to advance from gate to finish. Drag all the way back to reset the race.
- Predicted Finish Order
- Factors in contested pace burn, each horse’s effort curve (peaked-early vs. peaked-late), and wide trip cost from outside posts. Updated live when Track Bias changes.
- Pace Scenario
- Lone Speed: single E horse likely rates and holds. Contested: two E horses burn each other — closers benefit. Hot Pace: speed meltdown, deep closers thrive. Soft: no early speed, moderate fractions throughout.
- Track Bias
- Slider below canvas. −2 = strong closer/wet bias; +2 = strong speed/rail bias. Recomputes the predicted finish order.
- Boxed Indicator
- Dashed orange ring = horse is surrounded (rival ahead, rival behind, wall outside). In a real race this horse must find a clear path to run.
- Running Styles
- E/EE = early speed (rushes to rail). P = presser (stalks the pace). S = stalker. SS = slow starter / closer.
| Stat | vs. Current Card | vs. All Horses |
|---|---|---|
| Averages
Career-average metrics across all AI race analysis. Performance and pace averages reflect estimated historical performance; trainer and jockey grades score in-the-money percentages. Grading scale: A = elite • B = above average • C = average • D = below average • F = poor • — = no data |
||
| Pick Pony AI Rating | A | A |
| Pace Trip Longshot | — | — |
| Connections Longshot | — | — |
| Situational Longshot | — | — |
| Speed | F | A |
| Early Pace | B | C |
| Mid Pace | C | B |
| Late Pace | D | A |
| Finish Pos | C | D |
| Dirt Speed | B | A |
| Turf Speed | C | A |
| Distance Speed | B | A |
| Trainer Effectiveness | A | A |
| Jockey Effectiveness | A | A |
| 3rd Party Ratings | A | A |
| Recent
Performance analysis from the horse's recent races, weighted to reflect current form. Sprint and Route FPS (Foot Per Second) measure pace efficiency over the horse's recent sprints and routes respectively. Grading scale: A = elite • B = above average • C = average • D = below average • F = poor • — = no data |
||
| Speed | F | A |
| Early Pace | D | D |
| Mid Pace | C | B |
| Late Pace | B | A |
| Sprint FPS | C | C |
| Route FPS | C | C |
| Trainer Effectiveness | A | A |
| Jockey Effectiveness | A | A |
| 3rd Party Ratings | A | A |
| Predictions
AI-generated projections for the upcoming race, derived from prior AI analysis for speed and pace trends, surface and distance suitability, and current conditions. Grading scale: A = elite • B = above average • C = average • D = below average • F = poor • — = no data |
||
| Speed | F | A |
| Early Pace | B | B |
| Mid Pace | C | B |
| Late Pace | C | C |
Chart Guide (2.0.36)
- Bubbles
- Color = surface: green (turf), brown (dirt), blue (synthetic)
- Top number = finishing position; bottom number in parentheses = starting post position
- Height above line = beaten lengths — closer means a smaller margin
- Border = track conditions: green (FST/GD/FM), yellow (WF/SL/YLD), red (SY/MY/FRZ/SFT/HVY)
- Connecting Line
- Solid = good conditions; dashed = bad conditions
- Line Symbol
- ▲ Triangle = sprint (7f or less); ● Circle = route (more than 7f)
- Days Between Races
- Small number above each bubble (e.g. 19d) = days since the previous race — helps spot freshness, layoffs, and tight scheduling.
- Shaded Band (Bollinger)
- Highlights volatility — a wider band means more variation in recent performance
- Performance Trend
- Straight line showing the overall performance direction — angled up = improving, angled down = declining
- Dashed Reference Line
- AI Opponent = AI analysis class-level par for the race
AI Model History Guide
- Lines
- Each solid line shows this horse’s model score over its last 10 races: blue = Mod1, green = Mod2, amber = Mod3.
- Dashed Lines
- Dashed lines represent the current race’s field average for each model — a score below the dashed line indicates the horse ranked below average in this model’s assessment.
- Higher is Stronger
- All three model scores are 0–100: a higher number means the model rates this horse more favorably among the field.
Mod1(W): 82 (1/8) Mod2(W): 75 (2/8) Mod3(W): 79 (3/8) Mod1-LS: 55 (6/8) Win Prob: 18.4% Value Score: 1.35 ★
Performance vs. Peers Guide
- Bars (per post)
- Blue = avg career performance • Amber = avg last 3 races • Green = last race (improved vs. avg) • Red = last race (declined vs. avg)
- Trend Line
- Angled line above the bars: rising = improving form • falling = declining form.
- Horizontal Line
- Field average — the mean career performance of all horses in this race.
- Color Circles
- Standard post-position colors below each lane — same as the Total Pace chart.
- Border
- Thicker border = this horse’s post position.
Figure Comparison
- Rating
- The three Pick Pony algorithm ratings (Algo 1, Algo 2, Algo 3) that make up the overall PP AI Rating — higher is a stronger contender rating.
- Speed
- Career average speed, recent 3-race average, and last-race speed figure — spot horses in improving or declining form.
- Pace
- Average Early (E1), Mid (E2), and Stretch (LP) pace figures — reveals pace-setters vs. closers vs. all-the-way types.
- This horse
- The horse whose stats card is open is highlighted with a darker column background.
Winning Profiles
- Axes
- X: Win % from last 10 starts — Y: In-the-money % (top-3 finishes) from last 10 starts.
- Quadrants
- Consistent Winners (top-right): high win & ITM — reliable performers.
Place Threats (top-left): boards often but doesn’t win often — good exacta/trifecta angles.
Streaky (bottom-right): wins occasionally, misses the board often — all-or-nothing.
Developing (bottom-left): still finding form — longshot territory. - Reference Lines
- Dashed lines mark field averages. Dots to the right win more; dots higher board more.
- This horse
- Highlighted with a gold border and larger dot.
AI Model Comparison
- Winner Models (green)
- Mod1(W), Mod2(W), and Mod3(W) trained to predict race winners. Higher score = stronger contender.
- Longshot Models (red)
- Mod1-LS, Mod2-LS, and Mod3-LS trained to find high-value longshots. Higher score = stronger longshot candidate.
- Form Model (blue)
- Mod4 sequence model trained on recent form patterns. Higher score = stronger recent form profile.
- This horse
- Highlighted with a darker column background.
Race Pace Simulation Guide
- Slider
- Drag left→right to advance from gate to finish. Drag all the way back to reset the race.
- Predicted Finish Order
- Factors in contested pace burn, each horse’s effort curve (peaked-early vs. peaked-late), and wide trip cost from outside posts. Updated live when Track Bias changes.
- Pace Scenario
- Lone Speed: single E horse likely rates and holds. Contested: two E horses burn each other — closers benefit. Hot Pace: speed meltdown, deep closers thrive. Soft: no early speed, moderate fractions throughout.
- Track Bias
- Slider below canvas. −2 = strong closer/wet bias; +2 = strong speed/rail bias. Recomputes the predicted finish order.
- Boxed Indicator
- Dashed orange ring = horse is surrounded (rival ahead, rival behind, wall outside). In a real race this horse must find a clear path to run.
- Running Styles
- E/EE = early speed (rushes to rail). P = presser (stalks the pace). S = stalker. SS = slow starter / closer.
| Stat | vs. Current Card | vs. All Horses |
|---|---|---|
| Averages
Career-average metrics across all AI race analysis. Performance and pace averages reflect estimated historical performance; trainer and jockey grades score in-the-money percentages. Grading scale: A = elite • B = above average • C = average • D = below average • F = poor • — = no data |
||
| Pick Pony AI Rating | C | A |
| Pace Trip Longshot | — | — |
| Connections Longshot | — | — |
| Situational Longshot | — | — |
| Speed | B | A |
| Early Pace | C | A |
| Mid Pace | C | A |
| Late Pace | C | A |
| Finish Pos | D | B |
| Dirt Speed | C | A |
| Turf Speed | B | D |
| Distance Speed | D | F |
| Trainer Effectiveness | C | C |
| Jockey Effectiveness | A | A |
| 3rd Party Ratings | C | A |
| Recent
Performance analysis from the horse's recent races, weighted to reflect current form. Sprint and Route FPS (Foot Per Second) measure pace efficiency over the horse's recent sprints and routes respectively. Grading scale: A = elite • B = above average • C = average • D = below average • F = poor • — = no data |
||
| Speed | C | A |
| Early Pace | C | A |
| Mid Pace | C | A |
| Late Pace | C | A |
| Sprint FPS | A | A |
| Route FPS | A | A |
| Trainer Effectiveness | C | C |
| Jockey Effectiveness | A | A |
| 3rd Party Ratings | C | A |
| Predictions
AI-generated projections for the upcoming race, derived from prior AI analysis for speed and pace trends, surface and distance suitability, and current conditions. Grading scale: A = elite • B = above average • C = average • D = below average • F = poor • — = no data |
||
| Speed | A | A |
| Early Pace | B | A |
| Mid Pace | A | A |
| Late Pace | B | C |
Chart Guide (2.0.36)
- Bubbles
- Color = surface: green (turf), brown (dirt), blue (synthetic)
- Top number = finishing position; bottom number in parentheses = starting post position
- Height above line = beaten lengths — closer means a smaller margin
- Border = track conditions: green (FST/GD/FM), yellow (WF/SL/YLD), red (SY/MY/FRZ/SFT/HVY)
- Connecting Line
- Solid = good conditions; dashed = bad conditions
- Line Symbol
- ▲ Triangle = sprint (7f or less); ● Circle = route (more than 7f)
- Days Between Races
- Small number above each bubble (e.g. 19d) = days since the previous race — helps spot freshness, layoffs, and tight scheduling.
- Shaded Band (Bollinger)
- Highlights volatility — a wider band means more variation in recent performance
- Performance Trend
- Straight line showing the overall performance direction — angled up = improving, angled down = declining
- Dashed Reference Line
- AI Opponent = AI analysis class-level par for the race
AI Model History Guide
- Lines
- Each solid line shows this horse’s model score over its last 10 races: blue = Mod1, green = Mod2, amber = Mod3.
- Dashed Lines
- Dashed lines represent the current race’s field average for each model — a score below the dashed line indicates the horse ranked below average in this model’s assessment.
- Higher is Stronger
- All three model scores are 0–100: a higher number means the model rates this horse more favorably among the field.
Mod1(W): 82 (1/8) Mod2(W): 75 (2/8) Mod3(W): 79 (3/8) Mod1-LS: 55 (6/8) Win Prob: 18.4% Value Score: 1.35 ★
Performance vs. Peers Guide
- Bars (per post)
- Blue = avg career performance • Amber = avg last 3 races • Green = last race (improved vs. avg) • Red = last race (declined vs. avg)
- Trend Line
- Angled line above the bars: rising = improving form • falling = declining form.
- Horizontal Line
- Field average — the mean career performance of all horses in this race.
- Color Circles
- Standard post-position colors below each lane — same as the Total Pace chart.
- Border
- Thicker border = this horse’s post position.
Figure Comparison
- Rating
- The three Pick Pony algorithm ratings (Algo 1, Algo 2, Algo 3) that make up the overall PP AI Rating — higher is a stronger contender rating.
- Speed
- Career average speed, recent 3-race average, and last-race speed figure — spot horses in improving or declining form.
- Pace
- Average Early (E1), Mid (E2), and Stretch (LP) pace figures — reveals pace-setters vs. closers vs. all-the-way types.
- This horse
- The horse whose stats card is open is highlighted with a darker column background.
Winning Profiles
- Axes
- X: Win % from last 10 starts — Y: In-the-money % (top-3 finishes) from last 10 starts.
- Quadrants
- Consistent Winners (top-right): high win & ITM — reliable performers.
Place Threats (top-left): boards often but doesn’t win often — good exacta/trifecta angles.
Streaky (bottom-right): wins occasionally, misses the board often — all-or-nothing.
Developing (bottom-left): still finding form — longshot territory. - Reference Lines
- Dashed lines mark field averages. Dots to the right win more; dots higher board more.
- This horse
- Highlighted with a gold border and larger dot.
AI Model Comparison
- Winner Models (green)
- Mod1(W), Mod2(W), and Mod3(W) trained to predict race winners. Higher score = stronger contender.
- Longshot Models (red)
- Mod1-LS, Mod2-LS, and Mod3-LS trained to find high-value longshots. Higher score = stronger longshot candidate.
- Form Model (blue)
- Mod4 sequence model trained on recent form patterns. Higher score = stronger recent form profile.
- This horse
- Highlighted with a darker column background.
Race Pace Simulation Guide
- Slider
- Drag left→right to advance from gate to finish. Drag all the way back to reset the race.
- Predicted Finish Order
- Factors in contested pace burn, each horse’s effort curve (peaked-early vs. peaked-late), and wide trip cost from outside posts. Updated live when Track Bias changes.
- Pace Scenario
- Lone Speed: single E horse likely rates and holds. Contested: two E horses burn each other — closers benefit. Hot Pace: speed meltdown, deep closers thrive. Soft: no early speed, moderate fractions throughout.
- Track Bias
- Slider below canvas. −2 = strong closer/wet bias; +2 = strong speed/rail bias. Recomputes the predicted finish order.
- Boxed Indicator
- Dashed orange ring = horse is surrounded (rival ahead, rival behind, wall outside). In a real race this horse must find a clear path to run.
- Running Styles
- E/EE = early speed (rushes to rail). P = presser (stalks the pace). S = stalker. SS = slow starter / closer.
| Stat | vs. Current Card | vs. All Horses |
|---|---|---|
| Averages
Career-average metrics across all AI race analysis. Performance and pace averages reflect estimated historical performance; trainer and jockey grades score in-the-money percentages. Grading scale: A = elite • B = above average • C = average • D = below average • F = poor • — = no data |
||
| Pick Pony AI Rating | B | A |
| Pace Trip Longshot | — | — |
| Connections Longshot | — | — |
| Situational Longshot | — | — |
| Speed | A | A |
| Early Pace | B | A |
| Mid Pace | A | A |
| Late Pace | A | A |
| Finish Pos | A | A |
| Dirt Speed | A | A |
| Turf Speed | B | D |
| Distance Speed | D | F |
| Trainer Effectiveness | A | A |
| Jockey Effectiveness | B | A |
| 3rd Party Ratings | A | A |
| Recent
Performance analysis from the horse's recent races, weighted to reflect current form. Sprint and Route FPS (Foot Per Second) measure pace efficiency over the horse's recent sprints and routes respectively. Grading scale: A = elite • B = above average • C = average • D = below average • F = poor • — = no data |
||
| Speed | A | A |
| Early Pace | B | A |
| Mid Pace | A | A |
| Late Pace | A | A |
| Sprint FPS | C | A |
| Route FPS | D | B |
| Trainer Effectiveness | A | A |
| Jockey Effectiveness | B | A |
| 3rd Party Ratings | A | A |
| Predictions
AI-generated projections for the upcoming race, derived from prior AI analysis for speed and pace trends, surface and distance suitability, and current conditions. Grading scale: A = elite • B = above average • C = average • D = below average • F = poor • — = no data |
||
| Speed | B | A |
| Early Pace | A | A |
| Mid Pace | B | A |
| Late Pace | B | C |
Chart Guide (2.0.36)
- Bubbles
- Color = surface: green (turf), brown (dirt), blue (synthetic)
- Top number = finishing position; bottom number in parentheses = starting post position
- Height above line = beaten lengths — closer means a smaller margin
- Border = track conditions: green (FST/GD/FM), yellow (WF/SL/YLD), red (SY/MY/FRZ/SFT/HVY)
- Connecting Line
- Solid = good conditions; dashed = bad conditions
- Line Symbol
- ▲ Triangle = sprint (7f or less); ● Circle = route (more than 7f)
- Days Between Races
- Small number above each bubble (e.g. 19d) = days since the previous race — helps spot freshness, layoffs, and tight scheduling.
- Shaded Band (Bollinger)
- Highlights volatility — a wider band means more variation in recent performance
- Performance Trend
- Straight line showing the overall performance direction — angled up = improving, angled down = declining
- Dashed Reference Line
- AI Opponent = AI analysis class-level par for the race
AI Model History Guide
- Lines
- Each solid line shows this horse’s model score over its last 10 races: blue = Mod1, green = Mod2, amber = Mod3.
- Dashed Lines
- Dashed lines represent the current race’s field average for each model — a score below the dashed line indicates the horse ranked below average in this model’s assessment.
- Higher is Stronger
- All three model scores are 0–100: a higher number means the model rates this horse more favorably among the field.
Mod1(W): 82 (1/8) Mod2(W): 75 (2/8) Mod3(W): 79 (3/8) Mod1-LS: 55 (6/8) Win Prob: 18.4% Value Score: 1.35 ★
Performance vs. Peers Guide
- Bars (per post)
- Blue = avg career performance • Amber = avg last 3 races • Green = last race (improved vs. avg) • Red = last race (declined vs. avg)
- Trend Line
- Angled line above the bars: rising = improving form • falling = declining form.
- Horizontal Line
- Field average — the mean career performance of all horses in this race.
- Color Circles
- Standard post-position colors below each lane — same as the Total Pace chart.
- Border
- Thicker border = this horse’s post position.
Figure Comparison
- Rating
- The three Pick Pony algorithm ratings (Algo 1, Algo 2, Algo 3) that make up the overall PP AI Rating — higher is a stronger contender rating.
- Speed
- Career average speed, recent 3-race average, and last-race speed figure — spot horses in improving or declining form.
- Pace
- Average Early (E1), Mid (E2), and Stretch (LP) pace figures — reveals pace-setters vs. closers vs. all-the-way types.
- This horse
- The horse whose stats card is open is highlighted with a darker column background.
Winning Profiles
- Axes
- X: Win % from last 10 starts — Y: In-the-money % (top-3 finishes) from last 10 starts.
- Quadrants
- Consistent Winners (top-right): high win & ITM — reliable performers.
Place Threats (top-left): boards often but doesn’t win often — good exacta/trifecta angles.
Streaky (bottom-right): wins occasionally, misses the board often — all-or-nothing.
Developing (bottom-left): still finding form — longshot territory. - Reference Lines
- Dashed lines mark field averages. Dots to the right win more; dots higher board more.
- This horse
- Highlighted with a gold border and larger dot.
AI Model Comparison
- Winner Models (green)
- Mod1(W), Mod2(W), and Mod3(W) trained to predict race winners. Higher score = stronger contender.
- Longshot Models (red)
- Mod1-LS, Mod2-LS, and Mod3-LS trained to find high-value longshots. Higher score = stronger longshot candidate.
- Form Model (blue)
- Mod4 sequence model trained on recent form patterns. Higher score = stronger recent form profile.
- This horse
- Highlighted with a darker column background.
Race Pace Simulation Guide
- Slider
- Drag left→right to advance from gate to finish. Drag all the way back to reset the race.
- Predicted Finish Order
- Factors in contested pace burn, each horse’s effort curve (peaked-early vs. peaked-late), and wide trip cost from outside posts. Updated live when Track Bias changes.
- Pace Scenario
- Lone Speed: single E horse likely rates and holds. Contested: two E horses burn each other — closers benefit. Hot Pace: speed meltdown, deep closers thrive. Soft: no early speed, moderate fractions throughout.
- Track Bias
- Slider below canvas. −2 = strong closer/wet bias; +2 = strong speed/rail bias. Recomputes the predicted finish order.
- Boxed Indicator
- Dashed orange ring = horse is surrounded (rival ahead, rival behind, wall outside). In a real race this horse must find a clear path to run.
- Running Styles
- E/EE = early speed (rushes to rail). P = presser (stalks the pace). S = stalker. SS = slow starter / closer.
| Stat | vs. Current Card | vs. All Horses |
|---|---|---|
| Averages
Career-average metrics across all AI race analysis. Performance and pace averages reflect estimated historical performance; trainer and jockey grades score in-the-money percentages. Grading scale: A = elite • B = above average • C = average • D = below average • F = poor • — = no data |
||
| Pick Pony AI Rating | A | A |
| Pace Trip Longshot | — | — |
| Connections Longshot | — | — |
| Situational Longshot | — | — |
| Speed | D | A |
| Early Pace | C | C |
| Mid Pace | A | A |
| Late Pace | F | C |
| Finish Pos | D | D |
| Dirt Speed | D | D |
| Turf Speed | A | A |
| Distance Speed | A | A |
| Trainer Effectiveness | F | D |
| Jockey Effectiveness | B | B |
| 3rd Party Ratings | D | A |
| Recent
Performance analysis from the horse's recent races, weighted to reflect current form. Sprint and Route FPS (Foot Per Second) measure pace efficiency over the horse's recent sprints and routes respectively. Grading scale: A = elite • B = above average • C = average • D = below average • F = poor • — = no data |
||
| Speed | F | B |
| Early Pace | B | C |
| Mid Pace | A | A |
| Late Pace | F | D |
| Sprint FPS | A | B |
| Route FPS | A | A |
| Trainer Effectiveness | F | D |
| Jockey Effectiveness | B | B |
| 3rd Party Ratings | D | A |
| Predictions
AI-generated projections for the upcoming race, derived from prior AI analysis for speed and pace trends, surface and distance suitability, and current conditions. Grading scale: A = elite • B = above average • C = average • D = below average • F = poor • — = no data |
||
| Speed | C | A |
| Early Pace | C | C |
| Mid Pace | A | A |
| Late Pace | C | C |
Chart Guide (2.0.36)
- Bubbles
- Color = surface: green (turf), brown (dirt), blue (synthetic)
- Top number = finishing position; bottom number in parentheses = starting post position
- Height above line = beaten lengths — closer means a smaller margin
- Border = track conditions: green (FST/GD/FM), yellow (WF/SL/YLD), red (SY/MY/FRZ/SFT/HVY)
- Connecting Line
- Solid = good conditions; dashed = bad conditions
- Line Symbol
- ▲ Triangle = sprint (7f or less); ● Circle = route (more than 7f)
- Days Between Races
- Small number above each bubble (e.g. 19d) = days since the previous race — helps spot freshness, layoffs, and tight scheduling.
- Shaded Band (Bollinger)
- Highlights volatility — a wider band means more variation in recent performance
- Performance Trend
- Straight line showing the overall performance direction — angled up = improving, angled down = declining
- Dashed Reference Line
- AI Opponent = AI analysis class-level par for the race
AI Model History Guide
- Lines
- Each solid line shows this horse’s model score over its last 10 races: blue = Mod1, green = Mod2, amber = Mod3.
- Dashed Lines
- Dashed lines represent the current race’s field average for each model — a score below the dashed line indicates the horse ranked below average in this model’s assessment.
- Higher is Stronger
- All three model scores are 0–100: a higher number means the model rates this horse more favorably among the field.
Mod1(W): 82 (1/8) Mod2(W): 75 (2/8) Mod3(W): 79 (3/8) Mod1-LS: 55 (6/8) Win Prob: 18.4% Value Score: 1.35 ★
Performance vs. Peers Guide
- Bars (per post)
- Blue = avg career performance • Amber = avg last 3 races • Green = last race (improved vs. avg) • Red = last race (declined vs. avg)
- Trend Line
- Angled line above the bars: rising = improving form • falling = declining form.
- Horizontal Line
- Field average — the mean career performance of all horses in this race.
- Color Circles
- Standard post-position colors below each lane — same as the Total Pace chart.
- Border
- Thicker border = this horse’s post position.
Figure Comparison
- Rating
- The three Pick Pony algorithm ratings (Algo 1, Algo 2, Algo 3) that make up the overall PP AI Rating — higher is a stronger contender rating.
- Speed
- Career average speed, recent 3-race average, and last-race speed figure — spot horses in improving or declining form.
- Pace
- Average Early (E1), Mid (E2), and Stretch (LP) pace figures — reveals pace-setters vs. closers vs. all-the-way types.
- This horse
- The horse whose stats card is open is highlighted with a darker column background.
Winning Profiles
- Axes
- X: Win % from last 10 starts — Y: In-the-money % (top-3 finishes) from last 10 starts.
- Quadrants
- Consistent Winners (top-right): high win & ITM — reliable performers.
Place Threats (top-left): boards often but doesn’t win often — good exacta/trifecta angles.
Streaky (bottom-right): wins occasionally, misses the board often — all-or-nothing.
Developing (bottom-left): still finding form — longshot territory. - Reference Lines
- Dashed lines mark field averages. Dots to the right win more; dots higher board more.
- This horse
- Highlighted with a gold border and larger dot.
AI Model Comparison
- Winner Models (green)
- Mod1(W), Mod2(W), and Mod3(W) trained to predict race winners. Higher score = stronger contender.
- Longshot Models (red)
- Mod1-LS, Mod2-LS, and Mod3-LS trained to find high-value longshots. Higher score = stronger longshot candidate.
- Form Model (blue)
- Mod4 sequence model trained on recent form patterns. Higher score = stronger recent form profile.
- This horse
- Highlighted with a darker column background.
Race Pace Simulation Guide
- Slider
- Drag left→right to advance from gate to finish. Drag all the way back to reset the race.
- Predicted Finish Order
- Factors in contested pace burn, each horse’s effort curve (peaked-early vs. peaked-late), and wide trip cost from outside posts. Updated live when Track Bias changes.
- Pace Scenario
- Lone Speed: single E horse likely rates and holds. Contested: two E horses burn each other — closers benefit. Hot Pace: speed meltdown, deep closers thrive. Soft: no early speed, moderate fractions throughout.
- Track Bias
- Slider below canvas. −2 = strong closer/wet bias; +2 = strong speed/rail bias. Recomputes the predicted finish order.
- Boxed Indicator
- Dashed orange ring = horse is surrounded (rival ahead, rival behind, wall outside). In a real race this horse must find a clear path to run.
- Running Styles
- E/EE = early speed (rushes to rail). P = presser (stalks the pace). S = stalker. SS = slow starter / closer.
| Stat | vs. Current Card | vs. All Horses |
|---|---|---|
| Averages
Career-average metrics across all AI race analysis. Performance and pace averages reflect estimated historical performance; trainer and jockey grades score in-the-money percentages. Grading scale: A = elite • B = above average • C = average • D = below average • F = poor • — = no data |
||
| Pick Pony AI Rating | D | C |
| Pace Trip Longshot | — | — |
| Connections Longshot | — | — |
| Situational Longshot | — | — |
| Speed | D | B |
| Early Pace | D | C |
| Mid Pace | D | B |
| Late Pace | D | B |
| Finish Pos | D | B |
| Dirt Speed | D | B |
| Turf Speed | B | D |
| Distance Speed | B | A |
| Trainer Effectiveness | D | D |
| Jockey Effectiveness | D | D |
| 3rd Party Ratings | D | A |
| Recent
Performance analysis from the horse's recent races, weighted to reflect current form. Sprint and Route FPS (Foot Per Second) measure pace efficiency over the horse's recent sprints and routes respectively. Grading scale: A = elite • B = above average • C = average • D = below average • F = poor • — = no data |
||
| Speed | D | B |
| Early Pace | D | C |
| Mid Pace | D | B |
| Late Pace | D | B |
| Sprint FPS | D | A |
| Route FPS | C | A |
| Trainer Effectiveness | D | D |
| Jockey Effectiveness | D | D |
| 3rd Party Ratings | D | A |
| Predictions
AI-generated projections for the upcoming race, derived from prior AI analysis for speed and pace trends, surface and distance suitability, and current conditions. Grading scale: A = elite • B = above average • C = average • D = below average • F = poor • — = no data |
||
| Speed | D | C |
| Early Pace | D | C |
| Mid Pace | D | C |
| Late Pace | B | C |
Chart Guide (2.0.36)
- Bubbles
- Color = surface: green (turf), brown (dirt), blue (synthetic)
- Top number = finishing position; bottom number in parentheses = starting post position
- Height above line = beaten lengths — closer means a smaller margin
- Border = track conditions: green (FST/GD/FM), yellow (WF/SL/YLD), red (SY/MY/FRZ/SFT/HVY)
- Connecting Line
- Solid = good conditions; dashed = bad conditions
- Line Symbol
- ▲ Triangle = sprint (7f or less); ● Circle = route (more than 7f)
- Days Between Races
- Small number above each bubble (e.g. 19d) = days since the previous race — helps spot freshness, layoffs, and tight scheduling.
- Shaded Band (Bollinger)
- Highlights volatility — a wider band means more variation in recent performance
- Performance Trend
- Straight line showing the overall performance direction — angled up = improving, angled down = declining
- Dashed Reference Line
- AI Opponent = AI analysis class-level par for the race
AI Model History Guide
- Lines
- Each solid line shows this horse’s model score over its last 10 races: blue = Mod1, green = Mod2, amber = Mod3.
- Dashed Lines
- Dashed lines represent the current race’s field average for each model — a score below the dashed line indicates the horse ranked below average in this model’s assessment.
- Higher is Stronger
- All three model scores are 0–100: a higher number means the model rates this horse more favorably among the field.
Mod1(W): 82 (1/8) Mod2(W): 75 (2/8) Mod3(W): 79 (3/8) Mod1-LS: 55 (6/8) Win Prob: 18.4% Value Score: 1.35 ★
Performance vs. Peers Guide
- Bars (per post)
- Blue = avg career performance • Amber = avg last 3 races • Green = last race (improved vs. avg) • Red = last race (declined vs. avg)
- Trend Line
- Angled line above the bars: rising = improving form • falling = declining form.
- Horizontal Line
- Field average — the mean career performance of all horses in this race.
- Color Circles
- Standard post-position colors below each lane — same as the Total Pace chart.
- Border
- Thicker border = this horse’s post position.
Figure Comparison
- Rating
- The three Pick Pony algorithm ratings (Algo 1, Algo 2, Algo 3) that make up the overall PP AI Rating — higher is a stronger contender rating.
- Speed
- Career average speed, recent 3-race average, and last-race speed figure — spot horses in improving or declining form.
- Pace
- Average Early (E1), Mid (E2), and Stretch (LP) pace figures — reveals pace-setters vs. closers vs. all-the-way types.
- This horse
- The horse whose stats card is open is highlighted with a darker column background.
Winning Profiles
- Axes
- X: Win % from last 10 starts — Y: In-the-money % (top-3 finishes) from last 10 starts.
- Quadrants
- Consistent Winners (top-right): high win & ITM — reliable performers.
Place Threats (top-left): boards often but doesn’t win often — good exacta/trifecta angles.
Streaky (bottom-right): wins occasionally, misses the board often — all-or-nothing.
Developing (bottom-left): still finding form — longshot territory. - Reference Lines
- Dashed lines mark field averages. Dots to the right win more; dots higher board more.
- This horse
- Highlighted with a gold border and larger dot.
AI Model Comparison
- Winner Models (green)
- Mod1(W), Mod2(W), and Mod3(W) trained to predict race winners. Higher score = stronger contender.
- Longshot Models (red)
- Mod1-LS, Mod2-LS, and Mod3-LS trained to find high-value longshots. Higher score = stronger longshot candidate.
- Form Model (blue)
- Mod4 sequence model trained on recent form patterns. Higher score = stronger recent form profile.
- This horse
- Highlighted with a darker column background.
Race Pace Simulation Guide
- Slider
- Drag left→right to advance from gate to finish. Drag all the way back to reset the race.
- Predicted Finish Order
- Factors in contested pace burn, each horse’s effort curve (peaked-early vs. peaked-late), and wide trip cost from outside posts. Updated live when Track Bias changes.
- Pace Scenario
- Lone Speed: single E horse likely rates and holds. Contested: two E horses burn each other — closers benefit. Hot Pace: speed meltdown, deep closers thrive. Soft: no early speed, moderate fractions throughout.
- Track Bias
- Slider below canvas. −2 = strong closer/wet bias; +2 = strong speed/rail bias. Recomputes the predicted finish order.
- Boxed Indicator
- Dashed orange ring = horse is surrounded (rival ahead, rival behind, wall outside). In a real race this horse must find a clear path to run.
- Running Styles
- E/EE = early speed (rushes to rail). P = presser (stalks the pace). S = stalker. SS = slow starter / closer.
| Stat | vs. Current Card | vs. All Horses |
|---|---|---|
| Averages
Career-average metrics across all AI race analysis. Performance and pace averages reflect estimated historical performance; trainer and jockey grades score in-the-money percentages. Grading scale: A = elite • B = above average • C = average • D = below average • F = poor • — = no data |
||
| Pick Pony AI Rating | B | B |
| Pace Trip Longshot | — | — |
| Connections Longshot | — | — |
| Situational Longshot | — | — |
| Speed | B | A |
| Early Pace | A | B |
| Mid Pace | A | A |
| Late Pace | F | B |
| Finish Pos | C | D |
| Dirt Speed | C | B |
| Turf Speed | A | A |
| Distance Speed | A | A |
| Trainer Effectiveness | D | C |
| Jockey Effectiveness | D | D |
| 3rd Party Ratings | B | A |
| Recent
Performance analysis from the horse's recent races, weighted to reflect current form. Sprint and Route FPS (Foot Per Second) measure pace efficiency over the horse's recent sprints and routes respectively. Grading scale: A = elite • B = above average • C = average • D = below average • F = poor • — = no data |
||
| Speed | C | A |
| Early Pace | A | B |
| Mid Pace | A | A |
| Late Pace | F | B |
| Sprint FPS | A | B |
| Route FPS | A | A |
| Trainer Effectiveness | D | C |
| Jockey Effectiveness | D | D |
| 3rd Party Ratings | B | A |
| Predictions
AI-generated projections for the upcoming race, derived from prior AI analysis for speed and pace trends, surface and distance suitability, and current conditions. Grading scale: A = elite • B = above average • C = average • D = below average • F = poor • — = no data |
||
| Speed | A | A |
| Early Pace | A | B |
| Mid Pace | A | A |
| Late Pace | C | C |
Chart Guide (2.0.36)
- Bubbles
- Color = surface: green (turf), brown (dirt), blue (synthetic)
- Top number = finishing position; bottom number in parentheses = starting post position
- Height above line = beaten lengths — closer means a smaller margin
- Border = track conditions: green (FST/GD/FM), yellow (WF/SL/YLD), red (SY/MY/FRZ/SFT/HVY)
- Connecting Line
- Solid = good conditions; dashed = bad conditions
- Line Symbol
- ▲ Triangle = sprint (7f or less); ● Circle = route (more than 7f)
- Days Between Races
- Small number above each bubble (e.g. 19d) = days since the previous race — helps spot freshness, layoffs, and tight scheduling.
- Shaded Band (Bollinger)
- Highlights volatility — a wider band means more variation in recent performance
- Performance Trend
- Straight line showing the overall performance direction — angled up = improving, angled down = declining
- Dashed Reference Line
- AI Opponent = AI analysis class-level par for the race
AI Model History Guide
- Lines
- Each solid line shows this horse’s model score over its last 10 races: blue = Mod1, green = Mod2, amber = Mod3.
- Dashed Lines
- Dashed lines represent the current race’s field average for each model — a score below the dashed line indicates the horse ranked below average in this model’s assessment.
- Higher is Stronger
- All three model scores are 0–100: a higher number means the model rates this horse more favorably among the field.
Mod1(W): 82 (1/8) Mod2(W): 75 (2/8) Mod3(W): 79 (3/8) Mod1-LS: 55 (6/8) Win Prob: 18.4% Value Score: 1.35 ★
Performance vs. Peers Guide
- Bars (per post)
- Blue = avg career performance • Amber = avg last 3 races • Green = last race (improved vs. avg) • Red = last race (declined vs. avg)
- Trend Line
- Angled line above the bars: rising = improving form • falling = declining form.
- Horizontal Line
- Field average — the mean career performance of all horses in this race.
- Color Circles
- Standard post-position colors below each lane — same as the Total Pace chart.
- Border
- Thicker border = this horse’s post position.
Figure Comparison
- Rating
- The three Pick Pony algorithm ratings (Algo 1, Algo 2, Algo 3) that make up the overall PP AI Rating — higher is a stronger contender rating.
- Speed
- Career average speed, recent 3-race average, and last-race speed figure — spot horses in improving or declining form.
- Pace
- Average Early (E1), Mid (E2), and Stretch (LP) pace figures — reveals pace-setters vs. closers vs. all-the-way types.
- This horse
- The horse whose stats card is open is highlighted with a darker column background.
Winning Profiles
- Axes
- X: Win % from last 10 starts — Y: In-the-money % (top-3 finishes) from last 10 starts.
- Quadrants
- Consistent Winners (top-right): high win & ITM — reliable performers.
Place Threats (top-left): boards often but doesn’t win often — good exacta/trifecta angles.
Streaky (bottom-right): wins occasionally, misses the board often — all-or-nothing.
Developing (bottom-left): still finding form — longshot territory. - Reference Lines
- Dashed lines mark field averages. Dots to the right win more; dots higher board more.
- This horse
- Highlighted with a gold border and larger dot.
AI Model Comparison
- Winner Models (green)
- Mod1(W), Mod2(W), and Mod3(W) trained to predict race winners. Higher score = stronger contender.
- Longshot Models (red)
- Mod1-LS, Mod2-LS, and Mod3-LS trained to find high-value longshots. Higher score = stronger longshot candidate.
- Form Model (blue)
- Mod4 sequence model trained on recent form patterns. Higher score = stronger recent form profile.
- This horse
- Highlighted with a darker column background.
Race Pace Simulation Guide
- Slider
- Drag left→right to advance from gate to finish. Drag all the way back to reset the race.
- Predicted Finish Order
- Factors in contested pace burn, each horse’s effort curve (peaked-early vs. peaked-late), and wide trip cost from outside posts. Updated live when Track Bias changes.
- Pace Scenario
- Lone Speed: single E horse likely rates and holds. Contested: two E horses burn each other — closers benefit. Hot Pace: speed meltdown, deep closers thrive. Soft: no early speed, moderate fractions throughout.
- Track Bias
- Slider below canvas. −2 = strong closer/wet bias; +2 = strong speed/rail bias. Recomputes the predicted finish order.
- Boxed Indicator
- Dashed orange ring = horse is surrounded (rival ahead, rival behind, wall outside). In a real race this horse must find a clear path to run.
- Running Styles
- E/EE = early speed (rushes to rail). P = presser (stalks the pace). S = stalker. SS = slow starter / closer.
| Stat | vs. Current Card | vs. All Horses |
|---|---|---|
| Averages
Career-average metrics across all AI race analysis. Performance and pace averages reflect estimated historical performance; trainer and jockey grades score in-the-money percentages. Grading scale: A = elite • B = above average • C = average • D = below average • F = poor • — = no data |
||
| Pick Pony AI Rating | A | A |
| Pace Trip Longshot | — | — |
| Connections Longshot | — | — |
| Situational Longshot | — | — |
| Speed | C | A |
| Early Pace | A | A |
| Mid Pace | B | A |
| Late Pace | B | A |
| Finish Pos | B | A |
| Dirt Speed | B | A |
| Turf Speed | B | D |
| Distance Speed | A | A |
| Trainer Effectiveness | B | A |
| Jockey Effectiveness | C | A |
| 3rd Party Ratings | B | A |
| Recent
Performance analysis from the horse's recent races, weighted to reflect current form. Sprint and Route FPS (Foot Per Second) measure pace efficiency over the horse's recent sprints and routes respectively. Grading scale: A = elite • B = above average • C = average • D = below average • F = poor • — = no data |
||
| Speed | B | A |
| Early Pace | A | A |
| Mid Pace | B | A |
| Late Pace | B | A |
| Sprint FPS | B | A |
| Route FPS | B | A |
| Trainer Effectiveness | B | A |
| Jockey Effectiveness | C | A |
| 3rd Party Ratings | B | A |
| Predictions
AI-generated projections for the upcoming race, derived from prior AI analysis for speed and pace trends, surface and distance suitability, and current conditions. Grading scale: A = elite • B = above average • C = average • D = below average • F = poor • — = no data |
||
| Speed | C | A |
| Early Pace | C | B |
| Mid Pace | C | A |
| Late Pace | B | C |
Chart Guide (2.0.36)
- Bubbles
- Color = surface: green (turf), brown (dirt), blue (synthetic)
- Top number = finishing position; bottom number in parentheses = starting post position
- Height above line = beaten lengths — closer means a smaller margin
- Border = track conditions: green (FST/GD/FM), yellow (WF/SL/YLD), red (SY/MY/FRZ/SFT/HVY)
- Connecting Line
- Solid = good conditions; dashed = bad conditions
- Line Symbol
- ▲ Triangle = sprint (7f or less); ● Circle = route (more than 7f)
- Days Between Races
- Small number above each bubble (e.g. 19d) = days since the previous race — helps spot freshness, layoffs, and tight scheduling.
- Shaded Band (Bollinger)
- Highlights volatility — a wider band means more variation in recent performance
- Performance Trend
- Straight line showing the overall performance direction — angled up = improving, angled down = declining
- Dashed Reference Line
- AI Opponent = AI analysis class-level par for the race
AI Model History Guide
- Lines
- Each solid line shows this horse’s model score over its last 10 races: blue = Mod1, green = Mod2, amber = Mod3.
- Dashed Lines
- Dashed lines represent the current race’s field average for each model — a score below the dashed line indicates the horse ranked below average in this model’s assessment.
- Higher is Stronger
- All three model scores are 0–100: a higher number means the model rates this horse more favorably among the field.
Mod1(W): 82 (1/8) Mod2(W): 75 (2/8) Mod3(W): 79 (3/8) Mod1-LS: 55 (6/8) Win Prob: 18.4% Value Score: 1.35 ★
Performance vs. Peers Guide
- Bars (per post)
- Blue = avg career performance • Amber = avg last 3 races • Green = last race (improved vs. avg) • Red = last race (declined vs. avg)
- Trend Line
- Angled line above the bars: rising = improving form • falling = declining form.
- Horizontal Line
- Field average — the mean career performance of all horses in this race.
- Color Circles
- Standard post-position colors below each lane — same as the Total Pace chart.
- Border
- Thicker border = this horse’s post position.
Figure Comparison
- Rating
- The three Pick Pony algorithm ratings (Algo 1, Algo 2, Algo 3) that make up the overall PP AI Rating — higher is a stronger contender rating.
- Speed
- Career average speed, recent 3-race average, and last-race speed figure — spot horses in improving or declining form.
- Pace
- Average Early (E1), Mid (E2), and Stretch (LP) pace figures — reveals pace-setters vs. closers vs. all-the-way types.
- This horse
- The horse whose stats card is open is highlighted with a darker column background.
Winning Profiles
- Axes
- X: Win % from last 10 starts — Y: In-the-money % (top-3 finishes) from last 10 starts.
- Quadrants
- Consistent Winners (top-right): high win & ITM — reliable performers.
Place Threats (top-left): boards often but doesn’t win often — good exacta/trifecta angles.
Streaky (bottom-right): wins occasionally, misses the board often — all-or-nothing.
Developing (bottom-left): still finding form — longshot territory. - Reference Lines
- Dashed lines mark field averages. Dots to the right win more; dots higher board more.
- This horse
- Highlighted with a gold border and larger dot.
AI Model Comparison
- Winner Models (green)
- Mod1(W), Mod2(W), and Mod3(W) trained to predict race winners. Higher score = stronger contender.
- Longshot Models (red)
- Mod1-LS, Mod2-LS, and Mod3-LS trained to find high-value longshots. Higher score = stronger longshot candidate.
- Form Model (blue)
- Mod4 sequence model trained on recent form patterns. Higher score = stronger recent form profile.
- This horse
- Highlighted with a darker column background.
Race Pace Simulation Guide
- Slider
- Drag left→right to advance from gate to finish. Drag all the way back to reset the race.
- Predicted Finish Order
- Factors in contested pace burn, each horse’s effort curve (peaked-early vs. peaked-late), and wide trip cost from outside posts. Updated live when Track Bias changes.
- Pace Scenario
- Lone Speed: single E horse likely rates and holds. Contested: two E horses burn each other — closers benefit. Hot Pace: speed meltdown, deep closers thrive. Soft: no early speed, moderate fractions throughout.
- Track Bias
- Slider below canvas. −2 = strong closer/wet bias; +2 = strong speed/rail bias. Recomputes the predicted finish order.
- Boxed Indicator
- Dashed orange ring = horse is surrounded (rival ahead, rival behind, wall outside). In a real race this horse must find a clear path to run.
- Running Styles
- E/EE = early speed (rushes to rail). P = presser (stalks the pace). S = stalker. SS = slow starter / closer.
| Stat | vs. Current Card | vs. All Horses |
|---|---|---|
| Averages
Career-average metrics across all AI race analysis. Performance and pace averages reflect estimated historical performance; trainer and jockey grades score in-the-money percentages. Grading scale: A = elite • B = above average • C = average • D = below average • F = poor • — = no data |
||
| Pick Pony AI Rating | A | A |
| Pace Trip Longshot | — | — |
| Connections Longshot | — | — |
| Situational Longshot | — | — |
| Speed | C | A |
| Early Pace | A | B |
| Mid Pace | C | B |
| Late Pace | C | A |
| Finish Pos | B | C |
| Dirt Speed | B | A |
| Turf Speed | B | A |
| Distance Speed | D | A |
| Trainer Effectiveness | C | C |
| Jockey Effectiveness | A | A |
| 3rd Party Ratings | A | A |
| Recent
Performance analysis from the horse's recent races, weighted to reflect current form. Sprint and Route FPS (Foot Per Second) measure pace efficiency over the horse's recent sprints and routes respectively. Grading scale: A = elite • B = above average • C = average • D = below average • F = poor • — = no data |
||
| Speed | C | A |
| Early Pace | C | C |
| Mid Pace | C | B |
| Late Pace | C | A |
| Sprint FPS | B | C |
| Route FPS | B | B |
| Trainer Effectiveness | C | C |
| Jockey Effectiveness | A | A |
| 3rd Party Ratings | A | A |
| Predictions
AI-generated projections for the upcoming race, derived from prior AI analysis for speed and pace trends, surface and distance suitability, and current conditions. Grading scale: A = elite • B = above average • C = average • D = below average • F = poor • — = no data |
||
| Speed | B | A |
| Early Pace | B | B |
| Mid Pace | B | B |
| Late Pace | C | C |
Chart Guide (2.0.36)
- Bubbles
- Color = surface: green (turf), brown (dirt), blue (synthetic)
- Top number = finishing position; bottom number in parentheses = starting post position
- Height above line = beaten lengths — closer means a smaller margin
- Border = track conditions: green (FST/GD/FM), yellow (WF/SL/YLD), red (SY/MY/FRZ/SFT/HVY)
- Connecting Line
- Solid = good conditions; dashed = bad conditions
- Line Symbol
- ▲ Triangle = sprint (7f or less); ● Circle = route (more than 7f)
- Days Between Races
- Small number above each bubble (e.g. 19d) = days since the previous race — helps spot freshness, layoffs, and tight scheduling.
- Shaded Band (Bollinger)
- Highlights volatility — a wider band means more variation in recent performance
- Performance Trend
- Straight line showing the overall performance direction — angled up = improving, angled down = declining
- Dashed Reference Line
- AI Opponent = AI analysis class-level par for the race
AI Model History Guide
- Lines
- Each solid line shows this horse’s model score over its last 10 races: blue = Mod1, green = Mod2, amber = Mod3.
- Dashed Lines
- Dashed lines represent the current race’s field average for each model — a score below the dashed line indicates the horse ranked below average in this model’s assessment.
- Higher is Stronger
- All three model scores are 0–100: a higher number means the model rates this horse more favorably among the field.
Mod1(W): 82 (1/8) Mod2(W): 75 (2/8) Mod3(W): 79 (3/8) Mod1-LS: 55 (6/8) Win Prob: 18.4% Value Score: 1.35 ★
Performance vs. Peers Guide
- Bars (per post)
- Blue = avg career performance • Amber = avg last 3 races • Green = last race (improved vs. avg) • Red = last race (declined vs. avg)
- Trend Line
- Angled line above the bars: rising = improving form • falling = declining form.
- Horizontal Line
- Field average — the mean career performance of all horses in this race.
- Color Circles
- Standard post-position colors below each lane — same as the Total Pace chart.
- Border
- Thicker border = this horse’s post position.
Figure Comparison
- Rating
- The three Pick Pony algorithm ratings (Algo 1, Algo 2, Algo 3) that make up the overall PP AI Rating — higher is a stronger contender rating.
- Speed
- Career average speed, recent 3-race average, and last-race speed figure — spot horses in improving or declining form.
- Pace
- Average Early (E1), Mid (E2), and Stretch (LP) pace figures — reveals pace-setters vs. closers vs. all-the-way types.
- This horse
- The horse whose stats card is open is highlighted with a darker column background.
Winning Profiles
- Axes
- X: Win % from last 10 starts — Y: In-the-money % (top-3 finishes) from last 10 starts.
- Quadrants
- Consistent Winners (top-right): high win & ITM — reliable performers.
Place Threats (top-left): boards often but doesn’t win often — good exacta/trifecta angles.
Streaky (bottom-right): wins occasionally, misses the board often — all-or-nothing.
Developing (bottom-left): still finding form — longshot territory. - Reference Lines
- Dashed lines mark field averages. Dots to the right win more; dots higher board more.
- This horse
- Highlighted with a gold border and larger dot.
AI Model Comparison
- Winner Models (green)
- Mod1(W), Mod2(W), and Mod3(W) trained to predict race winners. Higher score = stronger contender.
- Longshot Models (red)
- Mod1-LS, Mod2-LS, and Mod3-LS trained to find high-value longshots. Higher score = stronger longshot candidate.
- Form Model (blue)
- Mod4 sequence model trained on recent form patterns. Higher score = stronger recent form profile.
- This horse
- Highlighted with a darker column background.
Race Pace Simulation Guide
- Slider
- Drag left→right to advance from gate to finish. Drag all the way back to reset the race.
- Predicted Finish Order
- Factors in contested pace burn, each horse’s effort curve (peaked-early vs. peaked-late), and wide trip cost from outside posts. Updated live when Track Bias changes.
- Pace Scenario
- Lone Speed: single E horse likely rates and holds. Contested: two E horses burn each other — closers benefit. Hot Pace: speed meltdown, deep closers thrive. Soft: no early speed, moderate fractions throughout.
- Track Bias
- Slider below canvas. −2 = strong closer/wet bias; +2 = strong speed/rail bias. Recomputes the predicted finish order.
- Boxed Indicator
- Dashed orange ring = horse is surrounded (rival ahead, rival behind, wall outside). In a real race this horse must find a clear path to run.
- Running Styles
- E/EE = early speed (rushes to rail). P = presser (stalks the pace). S = stalker. SS = slow starter / closer.
| Stat | vs. Current Card | vs. All Horses |
|---|---|---|
| Averages
Career-average metrics across all AI race analysis. Performance and pace averages reflect estimated historical performance; trainer and jockey grades score in-the-money percentages. Grading scale: A = elite • B = above average • C = average • D = below average • F = poor • — = no data |
||
| Pick Pony AI Rating | C | B |
| Pace Trip Longshot | — | — |
| Connections Longshot | — | — |
| Situational Longshot | — | — |
| Speed | B | A |
| Early Pace | C | C |
| Mid Pace | B | B |
| Late Pace | C | A |
| Finish Pos | F | F |
| Dirt Speed | F | F |
| Turf Speed | D | A |
| Distance Speed | D | A |
| Trainer Effectiveness | B | B |
| Jockey Effectiveness | A | A |
| 3rd Party Ratings | C | A |
| Recent
Performance analysis from the horse's recent races, weighted to reflect current form. Sprint and Route FPS (Foot Per Second) measure pace efficiency over the horse's recent sprints and routes respectively. Grading scale: A = elite • B = above average • C = average • D = below average • F = poor • — = no data |
||
| Speed | B | A |
| Early Pace | B | C |
| Mid Pace | B | B |
| Late Pace | D | B |
| Sprint FPS | D | D |
| Route FPS | D | C |
| Trainer Effectiveness | B | B |
| Jockey Effectiveness | A | A |
| 3rd Party Ratings | C | A |
| Predictions
AI-generated projections for the upcoming race, derived from prior AI analysis for speed and pace trends, surface and distance suitability, and current conditions. Grading scale: A = elite • B = above average • C = average • D = below average • F = poor • — = no data |
||
| Speed | A | A |
| Early Pace | C | C |
| Mid Pace | D | B |
| Late Pace | C | C |
Chart Guide (2.0.36)
- Bubbles
- Color = surface: green (turf), brown (dirt), blue (synthetic)
- Top number = finishing position; bottom number in parentheses = starting post position
- Height above line = beaten lengths — closer means a smaller margin
- Border = track conditions: green (FST/GD/FM), yellow (WF/SL/YLD), red (SY/MY/FRZ/SFT/HVY)
- Connecting Line
- Solid = good conditions; dashed = bad conditions
- Line Symbol
- ▲ Triangle = sprint (7f or less); ● Circle = route (more than 7f)
- Days Between Races
- Small number above each bubble (e.g. 19d) = days since the previous race — helps spot freshness, layoffs, and tight scheduling.
- Shaded Band (Bollinger)
- Highlights volatility — a wider band means more variation in recent performance
- Performance Trend
- Straight line showing the overall performance direction — angled up = improving, angled down = declining
- Dashed Reference Line
- AI Opponent = AI analysis class-level par for the race
AI Model History Guide
- Lines
- Each solid line shows this horse’s model score over its last 10 races: blue = Mod1, green = Mod2, amber = Mod3.
- Dashed Lines
- Dashed lines represent the current race’s field average for each model — a score below the dashed line indicates the horse ranked below average in this model’s assessment.
- Higher is Stronger
- All three model scores are 0–100: a higher number means the model rates this horse more favorably among the field.
Mod1(W): 82 (1/8) Mod2(W): 75 (2/8) Mod3(W): 79 (3/8) Mod1-LS: 55 (6/8) Win Prob: 18.4% Value Score: 1.35 ★
Performance vs. Peers Guide
- Bars (per post)
- Blue = avg career performance • Amber = avg last 3 races • Green = last race (improved vs. avg) • Red = last race (declined vs. avg)
- Trend Line
- Angled line above the bars: rising = improving form • falling = declining form.
- Horizontal Line
- Field average — the mean career performance of all horses in this race.
- Color Circles
- Standard post-position colors below each lane — same as the Total Pace chart.
- Border
- Thicker border = this horse’s post position.
Figure Comparison
- Rating
- The three Pick Pony algorithm ratings (Algo 1, Algo 2, Algo 3) that make up the overall PP AI Rating — higher is a stronger contender rating.
- Speed
- Career average speed, recent 3-race average, and last-race speed figure — spot horses in improving or declining form.
- Pace
- Average Early (E1), Mid (E2), and Stretch (LP) pace figures — reveals pace-setters vs. closers vs. all-the-way types.
- This horse
- The horse whose stats card is open is highlighted with a darker column background.
Winning Profiles
- Axes
- X: Win % from last 10 starts — Y: In-the-money % (top-3 finishes) from last 10 starts.
- Quadrants
- Consistent Winners (top-right): high win & ITM — reliable performers.
Place Threats (top-left): boards often but doesn’t win often — good exacta/trifecta angles.
Streaky (bottom-right): wins occasionally, misses the board often — all-or-nothing.
Developing (bottom-left): still finding form — longshot territory. - Reference Lines
- Dashed lines mark field averages. Dots to the right win more; dots higher board more.
- This horse
- Highlighted with a gold border and larger dot.
AI Model Comparison
- Winner Models (green)
- Mod1(W), Mod2(W), and Mod3(W) trained to predict race winners. Higher score = stronger contender.
- Longshot Models (red)
- Mod1-LS, Mod2-LS, and Mod3-LS trained to find high-value longshots. Higher score = stronger longshot candidate.
- Form Model (blue)
- Mod4 sequence model trained on recent form patterns. Higher score = stronger recent form profile.
- This horse
- Highlighted with a darker column background.
Race Pace Simulation Guide
- Slider
- Drag left→right to advance from gate to finish. Drag all the way back to reset the race.
- Predicted Finish Order
- Factors in contested pace burn, each horse’s effort curve (peaked-early vs. peaked-late), and wide trip cost from outside posts. Updated live when Track Bias changes.
- Pace Scenario
- Lone Speed: single E horse likely rates and holds. Contested: two E horses burn each other — closers benefit. Hot Pace: speed meltdown, deep closers thrive. Soft: no early speed, moderate fractions throughout.
- Track Bias
- Slider below canvas. −2 = strong closer/wet bias; +2 = strong speed/rail bias. Recomputes the predicted finish order.
- Boxed Indicator
- Dashed orange ring = horse is surrounded (rival ahead, rival behind, wall outside). In a real race this horse must find a clear path to run.
- Running Styles
- E/EE = early speed (rushes to rail). P = presser (stalks the pace). S = stalker. SS = slow starter / closer.
| Stat | vs. Current Card | vs. All Horses |
|---|---|---|
| Averages
Career-average metrics across all AI race analysis. Performance and pace averages reflect estimated historical performance; trainer and jockey grades score in-the-money percentages. Grading scale: A = elite • B = above average • C = average • D = below average • F = poor • — = no data |
||
| Pick Pony AI Rating | A | B |
| Pace Trip Longshot | — | — |
| Connections Longshot | — | — |
| Situational Longshot | — | — |
| Speed | B | C |
| Early Pace | B | C |
| Mid Pace | C | C |
| Late Pace | A | B |
| Finish Pos | A | D |
| Dirt Speed | A | B |
| Turf Speed | D | B |
| Distance Speed | A | B |
| Trainer Effectiveness | C | C |
| Jockey Effectiveness | A | C |
| 3rd Party Ratings | A | B |
| Recent
Performance analysis from the horse's recent races, weighted to reflect current form. Sprint and Route FPS (Foot Per Second) measure pace efficiency over the horse's recent sprints and routes respectively. Grading scale: A = elite • B = above average • C = average • D = below average • F = poor • — = no data |
||
| Speed | C | C |
| Early Pace | F | D |
| Mid Pace | D | C |
| Late Pace | A | B |
| Sprint FPS | B | C |
| Route FPS | B | C |
| Trainer Effectiveness | C | C |
| Jockey Effectiveness | A | C |
| 3rd Party Ratings | A | B |
| Predictions
AI-generated projections for the upcoming race, derived from prior AI analysis for speed and pace trends, surface and distance suitability, and current conditions. Grading scale: A = elite • B = above average • C = average • D = below average • F = poor • — = no data |
||
| Speed | B | C |
| Early Pace | C | C |
| Mid Pace | C | C |
| Late Pace | C | C |
Chart Guide (2.0.36)
- Bubbles
- Color = surface: green (turf), brown (dirt), blue (synthetic)
- Top number = finishing position; bottom number in parentheses = starting post position
- Height above line = beaten lengths — closer means a smaller margin
- Border = track conditions: green (FST/GD/FM), yellow (WF/SL/YLD), red (SY/MY/FRZ/SFT/HVY)
- Connecting Line
- Solid = good conditions; dashed = bad conditions
- Line Symbol
- ▲ Triangle = sprint (7f or less); ● Circle = route (more than 7f)
- Days Between Races
- Small number above each bubble (e.g. 19d) = days since the previous race — helps spot freshness, layoffs, and tight scheduling.
- Shaded Band (Bollinger)
- Highlights volatility — a wider band means more variation in recent performance
- Performance Trend
- Straight line showing the overall performance direction — angled up = improving, angled down = declining
- Dashed Reference Line
- AI Opponent = AI analysis class-level par for the race
AI Model History Guide
- Lines
- Each solid line shows this horse’s model score over its last 10 races: blue = Mod1, green = Mod2, amber = Mod3.
- Dashed Lines
- Dashed lines represent the current race’s field average for each model — a score below the dashed line indicates the horse ranked below average in this model’s assessment.
- Higher is Stronger
- All three model scores are 0–100: a higher number means the model rates this horse more favorably among the field.
Mod1(W): 82 (1/8) Mod2(W): 75 (2/8) Mod3(W): 79 (3/8) Mod1-LS: 55 (6/8) Win Prob: 18.4% Value Score: 1.35 ★
Performance vs. Peers Guide
- Bars (per post)
- Blue = avg career performance • Amber = avg last 3 races • Green = last race (improved vs. avg) • Red = last race (declined vs. avg)
- Trend Line
- Angled line above the bars: rising = improving form • falling = declining form.
- Horizontal Line
- Field average — the mean career performance of all horses in this race.
- Color Circles
- Standard post-position colors below each lane — same as the Total Pace chart.
- Border
- Thicker border = this horse’s post position.
Figure Comparison
- Rating
- The three Pick Pony algorithm ratings (Algo 1, Algo 2, Algo 3) that make up the overall PP AI Rating — higher is a stronger contender rating.
- Speed
- Career average speed, recent 3-race average, and last-race speed figure — spot horses in improving or declining form.
- Pace
- Average Early (E1), Mid (E2), and Stretch (LP) pace figures — reveals pace-setters vs. closers vs. all-the-way types.
- This horse
- The horse whose stats card is open is highlighted with a darker column background.
Winning Profiles
- Axes
- X: Win % from last 10 starts — Y: In-the-money % (top-3 finishes) from last 10 starts.
- Quadrants
- Consistent Winners (top-right): high win & ITM — reliable performers.
Place Threats (top-left): boards often but doesn’t win often — good exacta/trifecta angles.
Streaky (bottom-right): wins occasionally, misses the board often — all-or-nothing.
Developing (bottom-left): still finding form — longshot territory. - Reference Lines
- Dashed lines mark field averages. Dots to the right win more; dots higher board more.
- This horse
- Highlighted with a gold border and larger dot.
AI Model Comparison
- Winner Models (green)
- Mod1(W), Mod2(W), and Mod3(W) trained to predict race winners. Higher score = stronger contender.
- Longshot Models (red)
- Mod1-LS, Mod2-LS, and Mod3-LS trained to find high-value longshots. Higher score = stronger longshot candidate.
- Form Model (blue)
- Mod4 sequence model trained on recent form patterns. Higher score = stronger recent form profile.
- This horse
- Highlighted with a darker column background.
Race Pace Simulation Guide
- Slider
- Drag left→right to advance from gate to finish. Drag all the way back to reset the race.
- Predicted Finish Order
- Factors in contested pace burn, each horse’s effort curve (peaked-early vs. peaked-late), and wide trip cost from outside posts. Updated live when Track Bias changes.
- Pace Scenario
- Lone Speed: single E horse likely rates and holds. Contested: two E horses burn each other — closers benefit. Hot Pace: speed meltdown, deep closers thrive. Soft: no early speed, moderate fractions throughout.
- Track Bias
- Slider below canvas. −2 = strong closer/wet bias; +2 = strong speed/rail bias. Recomputes the predicted finish order.
- Boxed Indicator
- Dashed orange ring = horse is surrounded (rival ahead, rival behind, wall outside). In a real race this horse must find a clear path to run.
- Running Styles
- E/EE = early speed (rushes to rail). P = presser (stalks the pace). S = stalker. SS = slow starter / closer.
| Stat | vs. Current Card | vs. All Horses |
|---|---|---|
| Averages
Career-average metrics across all AI race analysis. Performance and pace averages reflect estimated historical performance; trainer and jockey grades score in-the-money percentages. Grading scale: A = elite • B = above average • C = average • D = below average • F = poor • — = no data |
||
| Pick Pony AI Rating | D | B |
| Pace Trip Longshot | — | — |
| Connections Longshot | — | — |
| Situational Longshot | — | — |
| Speed | D | A |
| Early Pace | C | C |
| Mid Pace | F | B |
| Late Pace | A | A |
| Finish Pos | A | B |
| Dirt Speed | B | A |
| Turf Speed | D | A |
| Distance Speed | F | F |
| Trainer Effectiveness | C | B |
| Jockey Effectiveness | A | A |
| 3rd Party Ratings | B | A |
| Recent
Performance analysis from the horse's recent races, weighted to reflect current form. Sprint and Route FPS (Foot Per Second) measure pace efficiency over the horse's recent sprints and routes respectively. Grading scale: A = elite • B = above average • C = average • D = below average • F = poor • — = no data |
||
| Speed | D | A |
| Early Pace | C | C |
| Mid Pace | D | B |
| Late Pace | A | A |
| Sprint FPS | D | C |
| Route FPS | D | C |
| Trainer Effectiveness | C | B |
| Jockey Effectiveness | A | A |
| 3rd Party Ratings | B | A |
| Predictions
AI-generated projections for the upcoming race, derived from prior AI analysis for speed and pace trends, surface and distance suitability, and current conditions. Grading scale: A = elite • B = above average • C = average • D = below average • F = poor • — = no data |
||
| Speed | D | A |
| Early Pace | C | C |
| Mid Pace | F | B |
| Late Pace | C | C |
Chart Guide (2.0.36)
- Bubbles
- Color = surface: green (turf), brown (dirt), blue (synthetic)
- Top number = finishing position; bottom number in parentheses = starting post position
- Height above line = beaten lengths — closer means a smaller margin
- Border = track conditions: green (FST/GD/FM), yellow (WF/SL/YLD), red (SY/MY/FRZ/SFT/HVY)
- Connecting Line
- Solid = good conditions; dashed = bad conditions
- Line Symbol
- ▲ Triangle = sprint (7f or less); ● Circle = route (more than 7f)
- Days Between Races
- Small number above each bubble (e.g. 19d) = days since the previous race — helps spot freshness, layoffs, and tight scheduling.
- Shaded Band (Bollinger)
- Highlights volatility — a wider band means more variation in recent performance
- Performance Trend
- Straight line showing the overall performance direction — angled up = improving, angled down = declining
- Dashed Reference Line
- AI Opponent = AI analysis class-level par for the race
AI Model History Guide
- Lines
- Each solid line shows this horse’s model score over its last 10 races: blue = Mod1, green = Mod2, amber = Mod3.
- Dashed Lines
- Dashed lines represent the current race’s field average for each model — a score below the dashed line indicates the horse ranked below average in this model’s assessment.
- Higher is Stronger
- All three model scores are 0–100: a higher number means the model rates this horse more favorably among the field.
Mod1(W): 82 (1/8) Mod2(W): 75 (2/8) Mod3(W): 79 (3/8) Mod1-LS: 55 (6/8) Win Prob: 18.4% Value Score: 1.35 ★
Performance vs. Peers Guide
- Bars (per post)
- Blue = avg career performance • Amber = avg last 3 races • Green = last race (improved vs. avg) • Red = last race (declined vs. avg)
- Trend Line
- Angled line above the bars: rising = improving form • falling = declining form.
- Horizontal Line
- Field average — the mean career performance of all horses in this race.
- Color Circles
- Standard post-position colors below each lane — same as the Total Pace chart.
- Border
- Thicker border = this horse’s post position.
Figure Comparison
- Rating
- The three Pick Pony algorithm ratings (Algo 1, Algo 2, Algo 3) that make up the overall PP AI Rating — higher is a stronger contender rating.
- Speed
- Career average speed, recent 3-race average, and last-race speed figure — spot horses in improving or declining form.
- Pace
- Average Early (E1), Mid (E2), and Stretch (LP) pace figures — reveals pace-setters vs. closers vs. all-the-way types.
- This horse
- The horse whose stats card is open is highlighted with a darker column background.
Winning Profiles
- Axes
- X: Win % from last 10 starts — Y: In-the-money % (top-3 finishes) from last 10 starts.
- Quadrants
- Consistent Winners (top-right): high win & ITM — reliable performers.
Place Threats (top-left): boards often but doesn’t win often — good exacta/trifecta angles.
Streaky (bottom-right): wins occasionally, misses the board often — all-or-nothing.
Developing (bottom-left): still finding form — longshot territory. - Reference Lines
- Dashed lines mark field averages. Dots to the right win more; dots higher board more.
- This horse
- Highlighted with a gold border and larger dot.
AI Model Comparison
- Winner Models (green)
- Mod1(W), Mod2(W), and Mod3(W) trained to predict race winners. Higher score = stronger contender.
- Longshot Models (red)
- Mod1-LS, Mod2-LS, and Mod3-LS trained to find high-value longshots. Higher score = stronger longshot candidate.
- Form Model (blue)
- Mod4 sequence model trained on recent form patterns. Higher score = stronger recent form profile.
- This horse
- Highlighted with a darker column background.
Race Pace Simulation Guide
- Slider
- Drag left→right to advance from gate to finish. Drag all the way back to reset the race.
- Predicted Finish Order
- Factors in contested pace burn, each horse’s effort curve (peaked-early vs. peaked-late), and wide trip cost from outside posts. Updated live when Track Bias changes.
- Pace Scenario
- Lone Speed: single E horse likely rates and holds. Contested: two E horses burn each other — closers benefit. Hot Pace: speed meltdown, deep closers thrive. Soft: no early speed, moderate fractions throughout.
- Track Bias
- Slider below canvas. −2 = strong closer/wet bias; +2 = strong speed/rail bias. Recomputes the predicted finish order.
- Boxed Indicator
- Dashed orange ring = horse is surrounded (rival ahead, rival behind, wall outside). In a real race this horse must find a clear path to run.
- Running Styles
- E/EE = early speed (rushes to rail). P = presser (stalks the pace). S = stalker. SS = slow starter / closer.
| Stat | vs. Current Card | vs. All Horses |
|---|---|---|
| Averages
Career-average metrics across all AI race analysis. Performance and pace averages reflect estimated historical performance; trainer and jockey grades score in-the-money percentages. Grading scale: A = elite • B = above average • C = average • D = below average • F = poor • — = no data |
||
| Pick Pony AI Rating | B | B |
| Pace Trip Longshot | — | — |
| Connections Longshot | — | — |
| Situational Longshot | — | — |
| Speed | D | D |
| Early Pace | A | B |
| Mid Pace | A | C |
| Late Pace | D | D |
| Finish Pos | A | F |
| Dirt Speed | A | B |
| Turf Speed | F | B |
| Distance Speed | A | A |
| Trainer Effectiveness | D | F |
| Jockey Effectiveness | F | D |
| 3rd Party Ratings | A | B |
| Recent
Performance analysis from the horse's recent races, weighted to reflect current form. Sprint and Route FPS (Foot Per Second) measure pace efficiency over the horse's recent sprints and routes respectively. Grading scale: A = elite • B = above average • C = average • D = below average • F = poor • — = no data |
||
| Speed | A | C |
| Early Pace | B | C |
| Mid Pace | C | C |
| Late Pace | A | C |
| Sprint FPS | A | A |
| Route FPS | A | B |
| Trainer Effectiveness | D | F |
| Jockey Effectiveness | F | D |
| 3rd Party Ratings | A | B |
| Predictions
AI-generated projections for the upcoming race, derived from prior AI analysis for speed and pace trends, surface and distance suitability, and current conditions. Grading scale: A = elite • B = above average • C = average • D = below average • F = poor • — = no data |
||
| Speed | D | D |
| Early Pace | A | B |
| Mid Pace | A | B |
| Late Pace | C | C |
Chart Guide (2.0.36)
- Bubbles
- Color = surface: green (turf), brown (dirt), blue (synthetic)
- Top number = finishing position; bottom number in parentheses = starting post position
- Height above line = beaten lengths — closer means a smaller margin
- Border = track conditions: green (FST/GD/FM), yellow (WF/SL/YLD), red (SY/MY/FRZ/SFT/HVY)
- Connecting Line
- Solid = good conditions; dashed = bad conditions
- Line Symbol
- ▲ Triangle = sprint (7f or less); ● Circle = route (more than 7f)
- Days Between Races
- Small number above each bubble (e.g. 19d) = days since the previous race — helps spot freshness, layoffs, and tight scheduling.
- Shaded Band (Bollinger)
- Highlights volatility — a wider band means more variation in recent performance
- Performance Trend
- Straight line showing the overall performance direction — angled up = improving, angled down = declining
- Dashed Reference Line
- AI Opponent = AI analysis class-level par for the race
AI Model History Guide
- Lines
- Each solid line shows this horse’s model score over its last 10 races: blue = Mod1, green = Mod2, amber = Mod3.
- Dashed Lines
- Dashed lines represent the current race’s field average for each model — a score below the dashed line indicates the horse ranked below average in this model’s assessment.
- Higher is Stronger
- All three model scores are 0–100: a higher number means the model rates this horse more favorably among the field.
Mod1(W): 82 (1/8) Mod2(W): 75 (2/8) Mod3(W): 79 (3/8) Mod1-LS: 55 (6/8) Win Prob: 18.4% Value Score: 1.35 ★
Performance vs. Peers Guide
- Bars (per post)
- Blue = avg career performance • Amber = avg last 3 races • Green = last race (improved vs. avg) • Red = last race (declined vs. avg)
- Trend Line
- Angled line above the bars: rising = improving form • falling = declining form.
- Horizontal Line
- Field average — the mean career performance of all horses in this race.
- Color Circles
- Standard post-position colors below each lane — same as the Total Pace chart.
- Border
- Thicker border = this horse’s post position.
Figure Comparison
- Rating
- The three Pick Pony algorithm ratings (Algo 1, Algo 2, Algo 3) that make up the overall PP AI Rating — higher is a stronger contender rating.
- Speed
- Career average speed, recent 3-race average, and last-race speed figure — spot horses in improving or declining form.
- Pace
- Average Early (E1), Mid (E2), and Stretch (LP) pace figures — reveals pace-setters vs. closers vs. all-the-way types.
- This horse
- The horse whose stats card is open is highlighted with a darker column background.
Winning Profiles
- Axes
- X: Win % from last 10 starts — Y: In-the-money % (top-3 finishes) from last 10 starts.
- Quadrants
- Consistent Winners (top-right): high win & ITM — reliable performers.
Place Threats (top-left): boards often but doesn’t win often — good exacta/trifecta angles.
Streaky (bottom-right): wins occasionally, misses the board often — all-or-nothing.
Developing (bottom-left): still finding form — longshot territory. - Reference Lines
- Dashed lines mark field averages. Dots to the right win more; dots higher board more.
- This horse
- Highlighted with a gold border and larger dot.
AI Model Comparison
- Winner Models (green)
- Mod1(W), Mod2(W), and Mod3(W) trained to predict race winners. Higher score = stronger contender.
- Longshot Models (red)
- Mod1-LS, Mod2-LS, and Mod3-LS trained to find high-value longshots. Higher score = stronger longshot candidate.
- Form Model (blue)
- Mod4 sequence model trained on recent form patterns. Higher score = stronger recent form profile.
- This horse
- Highlighted with a darker column background.
Race Pace Simulation Guide
- Slider
- Drag left→right to advance from gate to finish. Drag all the way back to reset the race.
- Predicted Finish Order
- Factors in contested pace burn, each horse’s effort curve (peaked-early vs. peaked-late), and wide trip cost from outside posts. Updated live when Track Bias changes.
- Pace Scenario
- Lone Speed: single E horse likely rates and holds. Contested: two E horses burn each other — closers benefit. Hot Pace: speed meltdown, deep closers thrive. Soft: no early speed, moderate fractions throughout.
- Track Bias
- Slider below canvas. −2 = strong closer/wet bias; +2 = strong speed/rail bias. Recomputes the predicted finish order.
- Boxed Indicator
- Dashed orange ring = horse is surrounded (rival ahead, rival behind, wall outside). In a real race this horse must find a clear path to run.
- Running Styles
- E/EE = early speed (rushes to rail). P = presser (stalks the pace). S = stalker. SS = slow starter / closer.
| Stat | vs. Current Card | vs. All Horses |
|---|---|---|
| Averages
Career-average metrics across all AI race analysis. Performance and pace averages reflect estimated historical performance; trainer and jockey grades score in-the-money percentages. Grading scale: A = elite • B = above average • C = average • D = below average • F = poor • — = no data |
||
| Pick Pony AI Rating | B | A |
| Pace Trip Longshot | — | — |
| Connections Longshot | — | — |
| Situational Longshot | — | — |
| Speed | A | A |
| Early Pace | A | B |
| Mid Pace | A | A |
| Late Pace | D | B |
| Finish Pos | D | D |
| Dirt Speed | A | A |
| Turf Speed | B | A |
| Distance Speed | C | A |
| Trainer Effectiveness | A | A |
| Jockey Effectiveness | C | C |
| 3rd Party Ratings | C | A |
| Recent
Performance analysis from the horse's recent races, weighted to reflect current form. Sprint and Route FPS (Foot Per Second) measure pace efficiency over the horse's recent sprints and routes respectively. Grading scale: A = elite • B = above average • C = average • D = below average • F = poor • — = no data |
||
| Speed | A | A |
| Early Pace | A | A |
| Mid Pace | A | A |
| Late Pace | D | C |
| Sprint FPS | B | A |
| Route FPS | A | A |
| Trainer Effectiveness | A | A |
| Jockey Effectiveness | C | C |
| 3rd Party Ratings | C | A |
| Predictions
AI-generated projections for the upcoming race, derived from prior AI analysis for speed and pace trends, surface and distance suitability, and current conditions. Grading scale: A = elite • B = above average • C = average • D = below average • F = poor • — = no data |
||
| Speed | A | A |
| Early Pace | A | B |
| Mid Pace | B | A |
| Late Pace | C | C |
Chart Guide (2.0.36)
- Bubbles
- Color = surface: green (turf), brown (dirt), blue (synthetic)
- Top number = finishing position; bottom number in parentheses = starting post position
- Height above line = beaten lengths — closer means a smaller margin
- Border = track conditions: green (FST/GD/FM), yellow (WF/SL/YLD), red (SY/MY/FRZ/SFT/HVY)
- Connecting Line
- Solid = good conditions; dashed = bad conditions
- Line Symbol
- ▲ Triangle = sprint (7f or less); ● Circle = route (more than 7f)
- Days Between Races
- Small number above each bubble (e.g. 19d) = days since the previous race — helps spot freshness, layoffs, and tight scheduling.
- Shaded Band (Bollinger)
- Highlights volatility — a wider band means more variation in recent performance
- Performance Trend
- Straight line showing the overall performance direction — angled up = improving, angled down = declining
- Dashed Reference Line
- AI Opponent = AI analysis class-level par for the race
AI Model History Guide
- Lines
- Each solid line shows this horse’s model score over its last 10 races: blue = Mod1, green = Mod2, amber = Mod3.
- Dashed Lines
- Dashed lines represent the current race’s field average for each model — a score below the dashed line indicates the horse ranked below average in this model’s assessment.
- Higher is Stronger
- All three model scores are 0–100: a higher number means the model rates this horse more favorably among the field.
Mod1(W): 82 (1/8) Mod2(W): 75 (2/8) Mod3(W): 79 (3/8) Mod1-LS: 55 (6/8) Win Prob: 18.4% Value Score: 1.35 ★
Performance vs. Peers Guide
- Bars (per post)
- Blue = avg career performance • Amber = avg last 3 races • Green = last race (improved vs. avg) • Red = last race (declined vs. avg)
- Trend Line
- Angled line above the bars: rising = improving form • falling = declining form.
- Horizontal Line
- Field average — the mean career performance of all horses in this race.
- Color Circles
- Standard post-position colors below each lane — same as the Total Pace chart.
- Border
- Thicker border = this horse’s post position.
Figure Comparison
- Rating
- The three Pick Pony algorithm ratings (Algo 1, Algo 2, Algo 3) that make up the overall PP AI Rating — higher is a stronger contender rating.
- Speed
- Career average speed, recent 3-race average, and last-race speed figure — spot horses in improving or declining form.
- Pace
- Average Early (E1), Mid (E2), and Stretch (LP) pace figures — reveals pace-setters vs. closers vs. all-the-way types.
- This horse
- The horse whose stats card is open is highlighted with a darker column background.
Winning Profiles
- Axes
- X: Win % from last 10 starts — Y: In-the-money % (top-3 finishes) from last 10 starts.
- Quadrants
- Consistent Winners (top-right): high win & ITM — reliable performers.
Place Threats (top-left): boards often but doesn’t win often — good exacta/trifecta angles.
Streaky (bottom-right): wins occasionally, misses the board often — all-or-nothing.
Developing (bottom-left): still finding form — longshot territory. - Reference Lines
- Dashed lines mark field averages. Dots to the right win more; dots higher board more.
- This horse
- Highlighted with a gold border and larger dot.
AI Model Comparison
- Winner Models (green)
- Mod1(W), Mod2(W), and Mod3(W) trained to predict race winners. Higher score = stronger contender.
- Longshot Models (red)
- Mod1-LS, Mod2-LS, and Mod3-LS trained to find high-value longshots. Higher score = stronger longshot candidate.
- Form Model (blue)
- Mod4 sequence model trained on recent form patterns. Higher score = stronger recent form profile.
- This horse
- Highlighted with a darker column background.
Race Pace Simulation Guide
- Slider
- Drag left→right to advance from gate to finish. Drag all the way back to reset the race.
- Predicted Finish Order
- Factors in contested pace burn, each horse’s effort curve (peaked-early vs. peaked-late), and wide trip cost from outside posts. Updated live when Track Bias changes.
- Pace Scenario
- Lone Speed: single E horse likely rates and holds. Contested: two E horses burn each other — closers benefit. Hot Pace: speed meltdown, deep closers thrive. Soft: no early speed, moderate fractions throughout.
- Track Bias
- Slider below canvas. −2 = strong closer/wet bias; +2 = strong speed/rail bias. Recomputes the predicted finish order.
- Boxed Indicator
- Dashed orange ring = horse is surrounded (rival ahead, rival behind, wall outside). In a real race this horse must find a clear path to run.
- Running Styles
- E/EE = early speed (rushes to rail). P = presser (stalks the pace). S = stalker. SS = slow starter / closer.
| Stat | vs. Current Card | vs. All Horses |
|---|---|---|
| Averages
Career-average metrics across all AI race analysis. Performance and pace averages reflect estimated historical performance; trainer and jockey grades score in-the-money percentages. Grading scale: A = elite • B = above average • C = average • D = below average • F = poor • — = no data |
||
| Pick Pony AI Rating | A | A |
| Pace Trip Longshot | — | — |
| Connections Longshot | — | — |
| Situational Longshot | — | — |
| Speed | F | A |
| Early Pace | A | B |
| Mid Pace | A | A |
| Late Pace | F | D |
| Finish Pos | F | F |
| Dirt Speed | A | A |
| Turf Speed | A | A |
| Distance Speed | A | A |
| Trainer Effectiveness | F | C |
| Jockey Effectiveness | B | A |
| 3rd Party Ratings | F | A |
| Recent
Performance analysis from the horse's recent races, weighted to reflect current form. Sprint and Route FPS (Foot Per Second) measure pace efficiency over the horse's recent sprints and routes respectively. Grading scale: A = elite • B = above average • C = average • D = below average • F = poor • — = no data |
||
| Speed | B | A |
| Early Pace | A | A |
| Mid Pace | A | A |
| Late Pace | D | C |
| Sprint FPS | A | A |
| Route FPS | A | A |
| Trainer Effectiveness | F | C |
| Jockey Effectiveness | B | A |
| 3rd Party Ratings | F | A |
| Predictions
AI-generated projections for the upcoming race, derived from prior AI analysis for speed and pace trends, surface and distance suitability, and current conditions. Grading scale: A = elite • B = above average • C = average • D = below average • F = poor • — = no data |
||
| Speed | F | A |
| Early Pace | D | C |
| Mid Pace | A | A |
| Late Pace | C | C |
Chart Guide (2.0.36)
- Bubbles
- Color = surface: green (turf), brown (dirt), blue (synthetic)
- Top number = finishing position; bottom number in parentheses = starting post position
- Height above line = beaten lengths — closer means a smaller margin
- Border = track conditions: green (FST/GD/FM), yellow (WF/SL/YLD), red (SY/MY/FRZ/SFT/HVY)
- Connecting Line
- Solid = good conditions; dashed = bad conditions
- Line Symbol
- ▲ Triangle = sprint (7f or less); ● Circle = route (more than 7f)
- Days Between Races
- Small number above each bubble (e.g. 19d) = days since the previous race — helps spot freshness, layoffs, and tight scheduling.
- Shaded Band (Bollinger)
- Highlights volatility — a wider band means more variation in recent performance
- Performance Trend
- Straight line showing the overall performance direction — angled up = improving, angled down = declining
- Dashed Reference Line
- AI Opponent = AI analysis class-level par for the race
AI Model History Guide
- Lines
- Each solid line shows this horse’s model score over its last 10 races: blue = Mod1, green = Mod2, amber = Mod3.
- Dashed Lines
- Dashed lines represent the current race’s field average for each model — a score below the dashed line indicates the horse ranked below average in this model’s assessment.
- Higher is Stronger
- All three model scores are 0–100: a higher number means the model rates this horse more favorably among the field.
Mod1(W): 82 (1/8) Mod2(W): 75 (2/8) Mod3(W): 79 (3/8) Mod1-LS: 55 (6/8) Win Prob: 18.4% Value Score: 1.35 ★
Performance vs. Peers Guide
- Bars (per post)
- Blue = avg career performance • Amber = avg last 3 races • Green = last race (improved vs. avg) • Red = last race (declined vs. avg)
- Trend Line
- Angled line above the bars: rising = improving form • falling = declining form.
- Horizontal Line
- Field average — the mean career performance of all horses in this race.
- Color Circles
- Standard post-position colors below each lane — same as the Total Pace chart.
- Border
- Thicker border = this horse’s post position.
Figure Comparison
- Rating
- The three Pick Pony algorithm ratings (Algo 1, Algo 2, Algo 3) that make up the overall PP AI Rating — higher is a stronger contender rating.
- Speed
- Career average speed, recent 3-race average, and last-race speed figure — spot horses in improving or declining form.
- Pace
- Average Early (E1), Mid (E2), and Stretch (LP) pace figures — reveals pace-setters vs. closers vs. all-the-way types.
- This horse
- The horse whose stats card is open is highlighted with a darker column background.
Winning Profiles
- Axes
- X: Win % from last 10 starts — Y: In-the-money % (top-3 finishes) from last 10 starts.
- Quadrants
- Consistent Winners (top-right): high win & ITM — reliable performers.
Place Threats (top-left): boards often but doesn’t win often — good exacta/trifecta angles.
Streaky (bottom-right): wins occasionally, misses the board often — all-or-nothing.
Developing (bottom-left): still finding form — longshot territory. - Reference Lines
- Dashed lines mark field averages. Dots to the right win more; dots higher board more.
- This horse
- Highlighted with a gold border and larger dot.
AI Model Comparison
- Winner Models (green)
- Mod1(W), Mod2(W), and Mod3(W) trained to predict race winners. Higher score = stronger contender.
- Longshot Models (red)
- Mod1-LS, Mod2-LS, and Mod3-LS trained to find high-value longshots. Higher score = stronger longshot candidate.
- Form Model (blue)
- Mod4 sequence model trained on recent form patterns. Higher score = stronger recent form profile.
- This horse
- Highlighted with a darker column background.
Race Pace Simulation Guide
- Slider
- Drag left→right to advance from gate to finish. Drag all the way back to reset the race.
- Predicted Finish Order
- Factors in contested pace burn, each horse’s effort curve (peaked-early vs. peaked-late), and wide trip cost from outside posts. Updated live when Track Bias changes.
- Pace Scenario
- Lone Speed: single E horse likely rates and holds. Contested: two E horses burn each other — closers benefit. Hot Pace: speed meltdown, deep closers thrive. Soft: no early speed, moderate fractions throughout.
- Track Bias
- Slider below canvas. −2 = strong closer/wet bias; +2 = strong speed/rail bias. Recomputes the predicted finish order.
- Boxed Indicator
- Dashed orange ring = horse is surrounded (rival ahead, rival behind, wall outside). In a real race this horse must find a clear path to run.
- Running Styles
- E/EE = early speed (rushes to rail). P = presser (stalks the pace). S = stalker. SS = slow starter / closer.
| Stat | vs. Current Card | vs. All Horses |
|---|---|---|
| Averages
Career-average metrics across all AI race analysis. Performance and pace averages reflect estimated historical performance; trainer and jockey grades score in-the-money percentages. Grading scale: A = elite • B = above average • C = average • D = below average • F = poor • — = no data |
||
| Pick Pony AI Rating | C | C |
| Pace Trip Longshot | — | — |
| Connections Longshot | — | — |
| Situational Longshot | — | — |
| Speed | C | C |
| Early Pace | F | C |
| Mid Pace | D | C |
| Late Pace | F | D |
| Finish Pos | D | F |
| Dirt Speed | B | C |
| Turf Speed | C | B |
| Distance Speed | B | C |
| Trainer Effectiveness | C | C |
| Jockey Effectiveness | B | C |
| 3rd Party Ratings | D | C |
| Recent
Performance analysis from the horse's recent races, weighted to reflect current form. Sprint and Route FPS (Foot Per Second) measure pace efficiency over the horse's recent sprints and routes respectively. Grading scale: A = elite • B = above average • C = average • D = below average • F = poor • — = no data |
||
| Speed | D | C |
| Early Pace | C | C |
| Mid Pace | A | B |
| Late Pace | C | D |
| Sprint FPS | A | B |
| Route FPS | A | B |
| Trainer Effectiveness | C | C |
| Jockey Effectiveness | B | C |
| 3rd Party Ratings | D | C |
| Predictions
AI-generated projections for the upcoming race, derived from prior AI analysis for speed and pace trends, surface and distance suitability, and current conditions. Grading scale: A = elite • B = above average • C = average • D = below average • F = poor • — = no data |
||
| Speed | C | C |
| Early Pace | F | C |
| Mid Pace | D | C |
| Late Pace | C | C |
Chart Guide (2.0.36)
- Bubbles
- Color = surface: green (turf), brown (dirt), blue (synthetic)
- Top number = finishing position; bottom number in parentheses = starting post position
- Height above line = beaten lengths — closer means a smaller margin
- Border = track conditions: green (FST/GD/FM), yellow (WF/SL/YLD), red (SY/MY/FRZ/SFT/HVY)
- Connecting Line
- Solid = good conditions; dashed = bad conditions
- Line Symbol
- ▲ Triangle = sprint (7f or less); ● Circle = route (more than 7f)
- Days Between Races
- Small number above each bubble (e.g. 19d) = days since the previous race — helps spot freshness, layoffs, and tight scheduling.
- Shaded Band (Bollinger)
- Highlights volatility — a wider band means more variation in recent performance
- Performance Trend
- Straight line showing the overall performance direction — angled up = improving, angled down = declining
- Dashed Reference Line
- AI Opponent = AI analysis class-level par for the race
AI Model History Guide
- Lines
- Each solid line shows this horse’s model score over its last 10 races: blue = Mod1, green = Mod2, amber = Mod3.
- Dashed Lines
- Dashed lines represent the current race’s field average for each model — a score below the dashed line indicates the horse ranked below average in this model’s assessment.
- Higher is Stronger
- All three model scores are 0–100: a higher number means the model rates this horse more favorably among the field.
Mod1(W): 82 (1/8) Mod2(W): 75 (2/8) Mod3(W): 79 (3/8) Mod1-LS: 55 (6/8) Win Prob: 18.4% Value Score: 1.35 ★
Performance vs. Peers Guide
- Bars (per post)
- Blue = avg career performance • Amber = avg last 3 races • Green = last race (improved vs. avg) • Red = last race (declined vs. avg)
- Trend Line
- Angled line above the bars: rising = improving form • falling = declining form.
- Horizontal Line
- Field average — the mean career performance of all horses in this race.
- Color Circles
- Standard post-position colors below each lane — same as the Total Pace chart.
- Border
- Thicker border = this horse’s post position.
Figure Comparison
- Rating
- The three Pick Pony algorithm ratings (Algo 1, Algo 2, Algo 3) that make up the overall PP AI Rating — higher is a stronger contender rating.
- Speed
- Career average speed, recent 3-race average, and last-race speed figure — spot horses in improving or declining form.
- Pace
- Average Early (E1), Mid (E2), and Stretch (LP) pace figures — reveals pace-setters vs. closers vs. all-the-way types.
- This horse
- The horse whose stats card is open is highlighted with a darker column background.
Winning Profiles
- Axes
- X: Win % from last 10 starts — Y: In-the-money % (top-3 finishes) from last 10 starts.
- Quadrants
- Consistent Winners (top-right): high win & ITM — reliable performers.
Place Threats (top-left): boards often but doesn’t win often — good exacta/trifecta angles.
Streaky (bottom-right): wins occasionally, misses the board often — all-or-nothing.
Developing (bottom-left): still finding form — longshot territory. - Reference Lines
- Dashed lines mark field averages. Dots to the right win more; dots higher board more.
- This horse
- Highlighted with a gold border and larger dot.
AI Model Comparison
- Winner Models (green)
- Mod1(W), Mod2(W), and Mod3(W) trained to predict race winners. Higher score = stronger contender.
- Longshot Models (red)
- Mod1-LS, Mod2-LS, and Mod3-LS trained to find high-value longshots. Higher score = stronger longshot candidate.
- Form Model (blue)
- Mod4 sequence model trained on recent form patterns. Higher score = stronger recent form profile.
- This horse
- Highlighted with a darker column background.
Race Pace Simulation Guide
- Slider
- Drag left→right to advance from gate to finish. Drag all the way back to reset the race.
- Predicted Finish Order
- Factors in contested pace burn, each horse’s effort curve (peaked-early vs. peaked-late), and wide trip cost from outside posts. Updated live when Track Bias changes.
- Pace Scenario
- Lone Speed: single E horse likely rates and holds. Contested: two E horses burn each other — closers benefit. Hot Pace: speed meltdown, deep closers thrive. Soft: no early speed, moderate fractions throughout.
- Track Bias
- Slider below canvas. −2 = strong closer/wet bias; +2 = strong speed/rail bias. Recomputes the predicted finish order.
- Boxed Indicator
- Dashed orange ring = horse is surrounded (rival ahead, rival behind, wall outside). In a real race this horse must find a clear path to run.
- Running Styles
- E/EE = early speed (rushes to rail). P = presser (stalks the pace). S = stalker. SS = slow starter / closer.
| Stat | vs. Current Card | vs. All Horses |
|---|---|---|
| Averages
Career-average metrics across all AI race analysis. Performance and pace averages reflect estimated historical performance; trainer and jockey grades score in-the-money percentages. Grading scale: A = elite • B = above average • C = average • D = below average • F = poor • — = no data |
||
| Pick Pony AI Rating | A | A |
| Pace Trip Longshot | — | — |
| Connections Longshot | — | — |
| Situational Longshot | — | — |
| Speed | A | B |
| Early Pace | D | C |
| Mid Pace | F | C |
| Late Pace | A | B |
| Finish Pos | C | F |
| Dirt Speed | D | F |
| Turf Speed | A | A |
| Distance Speed | D | F |
| Trainer Effectiveness | A | B |
| Jockey Effectiveness | A | A |
| 3rd Party Ratings | B | C |
| Recent
Performance analysis from the horse's recent races, weighted to reflect current form. Sprint and Route FPS (Foot Per Second) measure pace efficiency over the horse's recent sprints and routes respectively. Grading scale: A = elite • B = above average • C = average • D = below average • F = poor • — = no data |
||
| Speed | A | C |
| Early Pace | D | D |
| Mid Pace | F | D |
| Late Pace | B | C |
| Sprint FPS | F | D |
| Route FPS | C | D |
| Trainer Effectiveness | A | B |
| Jockey Effectiveness | A | A |
| 3rd Party Ratings | B | C |
| Predictions
AI-generated projections for the upcoming race, derived from prior AI analysis for speed and pace trends, surface and distance suitability, and current conditions. Grading scale: A = elite • B = above average • C = average • D = below average • F = poor • — = no data |
||
| Speed | A | B |
| Early Pace | D | C |
| Mid Pace | F | C |
| Late Pace | C | C |
Chart Guide (2.0.36)
- Bubbles
- Color = surface: green (turf), brown (dirt), blue (synthetic)
- Top number = finishing position; bottom number in parentheses = starting post position
- Height above line = beaten lengths — closer means a smaller margin
- Border = track conditions: green (FST/GD/FM), yellow (WF/SL/YLD), red (SY/MY/FRZ/SFT/HVY)
- Connecting Line
- Solid = good conditions; dashed = bad conditions
- Line Symbol
- ▲ Triangle = sprint (7f or less); ● Circle = route (more than 7f)
- Days Between Races
- Small number above each bubble (e.g. 19d) = days since the previous race — helps spot freshness, layoffs, and tight scheduling.
- Shaded Band (Bollinger)
- Highlights volatility — a wider band means more variation in recent performance
- Performance Trend
- Straight line showing the overall performance direction — angled up = improving, angled down = declining
- Dashed Reference Line
- AI Opponent = AI analysis class-level par for the race
AI Model History Guide
- Lines
- Each solid line shows this horse’s model score over its last 10 races: blue = Mod1, green = Mod2, amber = Mod3.
- Dashed Lines
- Dashed lines represent the current race’s field average for each model — a score below the dashed line indicates the horse ranked below average in this model’s assessment.
- Higher is Stronger
- All three model scores are 0–100: a higher number means the model rates this horse more favorably among the field.
Mod1(W): 82 (1/8) Mod2(W): 75 (2/8) Mod3(W): 79 (3/8) Mod1-LS: 55 (6/8) Win Prob: 18.4% Value Score: 1.35 ★
Performance vs. Peers Guide
- Bars (per post)
- Blue = avg career performance • Amber = avg last 3 races • Green = last race (improved vs. avg) • Red = last race (declined vs. avg)
- Trend Line
- Angled line above the bars: rising = improving form • falling = declining form.
- Horizontal Line
- Field average — the mean career performance of all horses in this race.
- Color Circles
- Standard post-position colors below each lane — same as the Total Pace chart.
- Border
- Thicker border = this horse’s post position.
Figure Comparison
- Rating
- The three Pick Pony algorithm ratings (Algo 1, Algo 2, Algo 3) that make up the overall PP AI Rating — higher is a stronger contender rating.
- Speed
- Career average speed, recent 3-race average, and last-race speed figure — spot horses in improving or declining form.
- Pace
- Average Early (E1), Mid (E2), and Stretch (LP) pace figures — reveals pace-setters vs. closers vs. all-the-way types.
- This horse
- The horse whose stats card is open is highlighted with a darker column background.
Winning Profiles
- Axes
- X: Win % from last 10 starts — Y: In-the-money % (top-3 finishes) from last 10 starts.
- Quadrants
- Consistent Winners (top-right): high win & ITM — reliable performers.
Place Threats (top-left): boards often but doesn’t win often — good exacta/trifecta angles.
Streaky (bottom-right): wins occasionally, misses the board often — all-or-nothing.
Developing (bottom-left): still finding form — longshot territory. - Reference Lines
- Dashed lines mark field averages. Dots to the right win more; dots higher board more.
- This horse
- Highlighted with a gold border and larger dot.
AI Model Comparison
- Winner Models (green)
- Mod1(W), Mod2(W), and Mod3(W) trained to predict race winners. Higher score = stronger contender.
- Longshot Models (red)
- Mod1-LS, Mod2-LS, and Mod3-LS trained to find high-value longshots. Higher score = stronger longshot candidate.
- Form Model (blue)
- Mod4 sequence model trained on recent form patterns. Higher score = stronger recent form profile.
- This horse
- Highlighted with a darker column background.
Race Pace Simulation Guide
- Slider
- Drag left→right to advance from gate to finish. Drag all the way back to reset the race.
- Predicted Finish Order
- Factors in contested pace burn, each horse’s effort curve (peaked-early vs. peaked-late), and wide trip cost from outside posts. Updated live when Track Bias changes.
- Pace Scenario
- Lone Speed: single E horse likely rates and holds. Contested: two E horses burn each other — closers benefit. Hot Pace: speed meltdown, deep closers thrive. Soft: no early speed, moderate fractions throughout.
- Track Bias
- Slider below canvas. −2 = strong closer/wet bias; +2 = strong speed/rail bias. Recomputes the predicted finish order.
- Boxed Indicator
- Dashed orange ring = horse is surrounded (rival ahead, rival behind, wall outside). In a real race this horse must find a clear path to run.
- Running Styles
- E/EE = early speed (rushes to rail). P = presser (stalks the pace). S = stalker. SS = slow starter / closer.
| Stat | vs. Current Card | vs. All Horses |
|---|---|---|
| Averages
Career-average metrics across all AI race analysis. Performance and pace averages reflect estimated historical performance; trainer and jockey grades score in-the-money percentages. Grading scale: A = elite • B = above average • C = average • D = below average • F = poor • — = no data |
||
| Pick Pony AI Rating | A | A |
| Pace Trip Longshot | — | — |
| Connections Longshot | — | — |
| Situational Longshot | — | — |
| Speed | A | A |
| Early Pace | A | A |
| Mid Pace | A | A |
| Late Pace | D | B |
| Finish Pos | D | F |
| Dirt Speed | C | B |
| Turf Speed | A | A |
| Distance Speed | A | A |
| Trainer Effectiveness | D | C |
| Jockey Effectiveness | A | A |
| 3rd Party Ratings | A | A |
| Recent
Performance analysis from the horse's recent races, weighted to reflect current form. Sprint and Route FPS (Foot Per Second) measure pace efficiency over the horse's recent sprints and routes respectively. Grading scale: A = elite • B = above average • C = average • D = below average • F = poor • — = no data |
||
| Speed | C | A |
| Early Pace | A | A |
| Mid Pace | A | A |
| Late Pace | F | C |
| Sprint FPS | B | B |
| Route FPS | B | A |
| Trainer Effectiveness | D | C |
| Jockey Effectiveness | A | A |
| 3rd Party Ratings | A | A |
| Predictions
AI-generated projections for the upcoming race, derived from prior AI analysis for speed and pace trends, surface and distance suitability, and current conditions. Grading scale: A = elite • B = above average • C = average • D = below average • F = poor • — = no data |
||
| Speed | B | A |
| Early Pace | A | A |
| Mid Pace | A | A |
| Late Pace | C | C |
Chart Guide (2.0.36)
- Bubbles
- Color = surface: green (turf), brown (dirt), blue (synthetic)
- Top number = finishing position; bottom number in parentheses = starting post position
- Height above line = beaten lengths — closer means a smaller margin
- Border = track conditions: green (FST/GD/FM), yellow (WF/SL/YLD), red (SY/MY/FRZ/SFT/HVY)
- Connecting Line
- Solid = good conditions; dashed = bad conditions
- Line Symbol
- ▲ Triangle = sprint (7f or less); ● Circle = route (more than 7f)
- Days Between Races
- Small number above each bubble (e.g. 19d) = days since the previous race — helps spot freshness, layoffs, and tight scheduling.
- Shaded Band (Bollinger)
- Highlights volatility — a wider band means more variation in recent performance
- Performance Trend
- Straight line showing the overall performance direction — angled up = improving, angled down = declining
- Dashed Reference Line
- AI Opponent = AI analysis class-level par for the race
AI Model History Guide
- Lines
- Each solid line shows this horse’s model score over its last 10 races: blue = Mod1, green = Mod2, amber = Mod3.
- Dashed Lines
- Dashed lines represent the current race’s field average for each model — a score below the dashed line indicates the horse ranked below average in this model’s assessment.
- Higher is Stronger
- All three model scores are 0–100: a higher number means the model rates this horse more favorably among the field.
Mod1(W): 82 (1/8) Mod2(W): 75 (2/8) Mod3(W): 79 (3/8) Mod1-LS: 55 (6/8) Win Prob: 18.4% Value Score: 1.35 ★
Performance vs. Peers Guide
- Bars (per post)
- Blue = avg career performance • Amber = avg last 3 races • Green = last race (improved vs. avg) • Red = last race (declined vs. avg)
- Trend Line
- Angled line above the bars: rising = improving form • falling = declining form.
- Horizontal Line
- Field average — the mean career performance of all horses in this race.
- Color Circles
- Standard post-position colors below each lane — same as the Total Pace chart.
- Border
- Thicker border = this horse’s post position.
Figure Comparison
- Rating
- The three Pick Pony algorithm ratings (Algo 1, Algo 2, Algo 3) that make up the overall PP AI Rating — higher is a stronger contender rating.
- Speed
- Career average speed, recent 3-race average, and last-race speed figure — spot horses in improving or declining form.
- Pace
- Average Early (E1), Mid (E2), and Stretch (LP) pace figures — reveals pace-setters vs. closers vs. all-the-way types.
- This horse
- The horse whose stats card is open is highlighted with a darker column background.
Winning Profiles
- Axes
- X: Win % from last 10 starts — Y: In-the-money % (top-3 finishes) from last 10 starts.
- Quadrants
- Consistent Winners (top-right): high win & ITM — reliable performers.
Place Threats (top-left): boards often but doesn’t win often — good exacta/trifecta angles.
Streaky (bottom-right): wins occasionally, misses the board often — all-or-nothing.
Developing (bottom-left): still finding form — longshot territory. - Reference Lines
- Dashed lines mark field averages. Dots to the right win more; dots higher board more.
- This horse
- Highlighted with a gold border and larger dot.
AI Model Comparison
- Winner Models (green)
- Mod1(W), Mod2(W), and Mod3(W) trained to predict race winners. Higher score = stronger contender.
- Longshot Models (red)
- Mod1-LS, Mod2-LS, and Mod3-LS trained to find high-value longshots. Higher score = stronger longshot candidate.
- Form Model (blue)
- Mod4 sequence model trained on recent form patterns. Higher score = stronger recent form profile.
- This horse
- Highlighted with a darker column background.
Race Pace Simulation Guide
- Slider
- Drag left→right to advance from gate to finish. Drag all the way back to reset the race.
- Predicted Finish Order
- Factors in contested pace burn, each horse’s effort curve (peaked-early vs. peaked-late), and wide trip cost from outside posts. Updated live when Track Bias changes.
- Pace Scenario
- Lone Speed: single E horse likely rates and holds. Contested: two E horses burn each other — closers benefit. Hot Pace: speed meltdown, deep closers thrive. Soft: no early speed, moderate fractions throughout.
- Track Bias
- Slider below canvas. −2 = strong closer/wet bias; +2 = strong speed/rail bias. Recomputes the predicted finish order.
- Boxed Indicator
- Dashed orange ring = horse is surrounded (rival ahead, rival behind, wall outside). In a real race this horse must find a clear path to run.
- Running Styles
- E/EE = early speed (rushes to rail). P = presser (stalks the pace). S = stalker. SS = slow starter / closer.
| Stat | vs. Current Card | vs. All Horses |
|---|---|---|
| Averages
Career-average metrics across all AI race analysis. Performance and pace averages reflect estimated historical performance; trainer and jockey grades score in-the-money percentages. Grading scale: A = elite • B = above average • C = average • D = below average • F = poor • — = no data |
||
| Pick Pony AI Rating | C | B |
| Pace Trip Longshot | — | — |
| Connections Longshot | — | — |
| Situational Longshot | — | — |
| Speed | B | A |
| Early Pace | C | C |
| Mid Pace | C | B |
| Late Pace | C | A |
| Finish Pos | C | D |
| Dirt Speed | A | A |
| Turf Speed | A | A |
| Distance Speed | D | A |
| Trainer Effectiveness | D | C |
| Jockey Effectiveness | B | B |
| 3rd Party Ratings | A | A |
| Recent
Performance analysis from the horse's recent races, weighted to reflect current form. Sprint and Route FPS (Foot Per Second) measure pace efficiency over the horse's recent sprints and routes respectively. Grading scale: A = elite • B = above average • C = average • D = below average • F = poor • — = no data |
||
| Speed | D | A |
| Early Pace | B | B |
| Mid Pace | C | A |
| Late Pace | F | C |
| Sprint FPS | C | B |
| Route FPS | C | B |
| Trainer Effectiveness | D | C |
| Jockey Effectiveness | B | B |
| 3rd Party Ratings | A | A |
| Predictions
AI-generated projections for the upcoming race, derived from prior AI analysis for speed and pace trends, surface and distance suitability, and current conditions. Grading scale: A = elite • B = above average • C = average • D = below average • F = poor • — = no data |
||
| Speed | C | A |
| Early Pace | C | C |
| Mid Pace | D | B |
| Late Pace | C | C |
Chart Guide (2.0.36)
- Bubbles
- Color = surface: green (turf), brown (dirt), blue (synthetic)
- Top number = finishing position; bottom number in parentheses = starting post position
- Height above line = beaten lengths — closer means a smaller margin
- Border = track conditions: green (FST/GD/FM), yellow (WF/SL/YLD), red (SY/MY/FRZ/SFT/HVY)
- Connecting Line
- Solid = good conditions; dashed = bad conditions
- Line Symbol
- ▲ Triangle = sprint (7f or less); ● Circle = route (more than 7f)
- Days Between Races
- Small number above each bubble (e.g. 19d) = days since the previous race — helps spot freshness, layoffs, and tight scheduling.
- Shaded Band (Bollinger)
- Highlights volatility — a wider band means more variation in recent performance
- Performance Trend
- Straight line showing the overall performance direction — angled up = improving, angled down = declining
- Dashed Reference Line
- AI Opponent = AI analysis class-level par for the race
AI Model History Guide
- Lines
- Each solid line shows this horse’s model score over its last 10 races: blue = Mod1, green = Mod2, amber = Mod3.
- Dashed Lines
- Dashed lines represent the current race’s field average for each model — a score below the dashed line indicates the horse ranked below average in this model’s assessment.
- Higher is Stronger
- All three model scores are 0–100: a higher number means the model rates this horse more favorably among the field.
Mod1(W): 82 (1/8) Mod2(W): 75 (2/8) Mod3(W): 79 (3/8) Mod1-LS: 55 (6/8) Win Prob: 18.4% Value Score: 1.35 ★
Performance vs. Peers Guide
- Bars (per post)
- Blue = avg career performance • Amber = avg last 3 races • Green = last race (improved vs. avg) • Red = last race (declined vs. avg)
- Trend Line
- Angled line above the bars: rising = improving form • falling = declining form.
- Horizontal Line
- Field average — the mean career performance of all horses in this race.
- Color Circles
- Standard post-position colors below each lane — same as the Total Pace chart.
- Border
- Thicker border = this horse’s post position.
Figure Comparison
- Rating
- The three Pick Pony algorithm ratings (Algo 1, Algo 2, Algo 3) that make up the overall PP AI Rating — higher is a stronger contender rating.
- Speed
- Career average speed, recent 3-race average, and last-race speed figure — spot horses in improving or declining form.
- Pace
- Average Early (E1), Mid (E2), and Stretch (LP) pace figures — reveals pace-setters vs. closers vs. all-the-way types.
- This horse
- The horse whose stats card is open is highlighted with a darker column background.
Winning Profiles
- Axes
- X: Win % from last 10 starts — Y: In-the-money % (top-3 finishes) from last 10 starts.
- Quadrants
- Consistent Winners (top-right): high win & ITM — reliable performers.
Place Threats (top-left): boards often but doesn’t win often — good exacta/trifecta angles.
Streaky (bottom-right): wins occasionally, misses the board often — all-or-nothing.
Developing (bottom-left): still finding form — longshot territory. - Reference Lines
- Dashed lines mark field averages. Dots to the right win more; dots higher board more.
- This horse
- Highlighted with a gold border and larger dot.
AI Model Comparison
- Winner Models (green)
- Mod1(W), Mod2(W), and Mod3(W) trained to predict race winners. Higher score = stronger contender.
- Longshot Models (red)
- Mod1-LS, Mod2-LS, and Mod3-LS trained to find high-value longshots. Higher score = stronger longshot candidate.
- Form Model (blue)
- Mod4 sequence model trained on recent form patterns. Higher score = stronger recent form profile.
- This horse
- Highlighted with a darker column background.
Race Pace Simulation Guide
- Slider
- Drag left→right to advance from gate to finish. Drag all the way back to reset the race.
- Predicted Finish Order
- Factors in contested pace burn, each horse’s effort curve (peaked-early vs. peaked-late), and wide trip cost from outside posts. Updated live when Track Bias changes.
- Pace Scenario
- Lone Speed: single E horse likely rates and holds. Contested: two E horses burn each other — closers benefit. Hot Pace: speed meltdown, deep closers thrive. Soft: no early speed, moderate fractions throughout.
- Track Bias
- Slider below canvas. −2 = strong closer/wet bias; +2 = strong speed/rail bias. Recomputes the predicted finish order.
- Boxed Indicator
- Dashed orange ring = horse is surrounded (rival ahead, rival behind, wall outside). In a real race this horse must find a clear path to run.
- Running Styles
- E/EE = early speed (rushes to rail). P = presser (stalks the pace). S = stalker. SS = slow starter / closer.
| Stat | vs. Current Card | vs. All Horses |
|---|---|---|
| Averages
Career-average metrics across all AI race analysis. Performance and pace averages reflect estimated historical performance; trainer and jockey grades score in-the-money percentages. Grading scale: A = elite • B = above average • C = average • D = below average • F = poor • — = no data |
||
| Pick Pony AI Rating | C | A |
| Pace Trip Longshot | — | — |
| Connections Longshot | — | — |
| Situational Longshot | — | — |
| Speed | A | A |
| Early Pace | F | B |
| Mid Pace | D | A |
| Late Pace | C | A |
| Finish Pos | D | D |
| Dirt Speed | C | D |
| Turf Speed | B | A |
| Distance Speed | D | F |
| Trainer Effectiveness | D | C |
| Jockey Effectiveness | A | A |
| 3rd Party Ratings | A | A |
| Recent
Performance analysis from the horse's recent races, weighted to reflect current form. Sprint and Route FPS (Foot Per Second) measure pace efficiency over the horse's recent sprints and routes respectively. Grading scale: A = elite • B = above average • C = average • D = below average • F = poor • — = no data |
||
| Speed | A | A |
| Early Pace | F | A |
| Mid Pace | B | A |
| Late Pace | C | A |
| Sprint FPS | D | B |
| Route FPS | A | A |
| Trainer Effectiveness | D | C |
| Jockey Effectiveness | A | A |
| 3rd Party Ratings | A | A |
| Predictions
AI-generated projections for the upcoming race, derived from prior AI analysis for speed and pace trends, surface and distance suitability, and current conditions. Grading scale: A = elite • B = above average • C = average • D = below average • F = poor • — = no data |
||
| Speed | B | A |
| Early Pace | F | A |
| Mid Pace | C | A |
| Late Pace | C | C |
Chart Guide (2.0.36)
- Bubbles
- Color = surface: green (turf), brown (dirt), blue (synthetic)
- Top number = finishing position; bottom number in parentheses = starting post position
- Height above line = beaten lengths — closer means a smaller margin
- Border = track conditions: green (FST/GD/FM), yellow (WF/SL/YLD), red (SY/MY/FRZ/SFT/HVY)
- Connecting Line
- Solid = good conditions; dashed = bad conditions
- Line Symbol
- ▲ Triangle = sprint (7f or less); ● Circle = route (more than 7f)
- Days Between Races
- Small number above each bubble (e.g. 19d) = days since the previous race — helps spot freshness, layoffs, and tight scheduling.
- Shaded Band (Bollinger)
- Highlights volatility — a wider band means more variation in recent performance
- Performance Trend
- Straight line showing the overall performance direction — angled up = improving, angled down = declining
- Dashed Reference Line
- AI Opponent = AI analysis class-level par for the race
AI Model History Guide
- Lines
- Each solid line shows this horse’s model score over its last 10 races: blue = Mod1, green = Mod2, amber = Mod3.
- Dashed Lines
- Dashed lines represent the current race’s field average for each model — a score below the dashed line indicates the horse ranked below average in this model’s assessment.
- Higher is Stronger
- All three model scores are 0–100: a higher number means the model rates this horse more favorably among the field.
Mod1(W): 82 (1/8) Mod2(W): 75 (2/8) Mod3(W): 79 (3/8) Mod1-LS: 55 (6/8) Win Prob: 18.4% Value Score: 1.35 ★
Performance vs. Peers Guide
- Bars (per post)
- Blue = avg career performance • Amber = avg last 3 races • Green = last race (improved vs. avg) • Red = last race (declined vs. avg)
- Trend Line
- Angled line above the bars: rising = improving form • falling = declining form.
- Horizontal Line
- Field average — the mean career performance of all horses in this race.
- Color Circles
- Standard post-position colors below each lane — same as the Total Pace chart.
- Border
- Thicker border = this horse’s post position.
Figure Comparison
- Rating
- The three Pick Pony algorithm ratings (Algo 1, Algo 2, Algo 3) that make up the overall PP AI Rating — higher is a stronger contender rating.
- Speed
- Career average speed, recent 3-race average, and last-race speed figure — spot horses in improving or declining form.
- Pace
- Average Early (E1), Mid (E2), and Stretch (LP) pace figures — reveals pace-setters vs. closers vs. all-the-way types.
- This horse
- The horse whose stats card is open is highlighted with a darker column background.
Winning Profiles
- Axes
- X: Win % from last 10 starts — Y: In-the-money % (top-3 finishes) from last 10 starts.
- Quadrants
- Consistent Winners (top-right): high win & ITM — reliable performers.
Place Threats (top-left): boards often but doesn’t win often — good exacta/trifecta angles.
Streaky (bottom-right): wins occasionally, misses the board often — all-or-nothing.
Developing (bottom-left): still finding form — longshot territory. - Reference Lines
- Dashed lines mark field averages. Dots to the right win more; dots higher board more.
- This horse
- Highlighted with a gold border and larger dot.
AI Model Comparison
- Winner Models (green)
- Mod1(W), Mod2(W), and Mod3(W) trained to predict race winners. Higher score = stronger contender.
- Longshot Models (red)
- Mod1-LS, Mod2-LS, and Mod3-LS trained to find high-value longshots. Higher score = stronger longshot candidate.
- Form Model (blue)
- Mod4 sequence model trained on recent form patterns. Higher score = stronger recent form profile.
- This horse
- Highlighted with a darker column background.
Race Pace Simulation Guide
- Slider
- Drag left→right to advance from gate to finish. Drag all the way back to reset the race.
- Predicted Finish Order
- Factors in contested pace burn, each horse’s effort curve (peaked-early vs. peaked-late), and wide trip cost from outside posts. Updated live when Track Bias changes.
- Pace Scenario
- Lone Speed: single E horse likely rates and holds. Contested: two E horses burn each other — closers benefit. Hot Pace: speed meltdown, deep closers thrive. Soft: no early speed, moderate fractions throughout.
- Track Bias
- Slider below canvas. −2 = strong closer/wet bias; +2 = strong speed/rail bias. Recomputes the predicted finish order.
- Boxed Indicator
- Dashed orange ring = horse is surrounded (rival ahead, rival behind, wall outside). In a real race this horse must find a clear path to run.
- Running Styles
- E/EE = early speed (rushes to rail). P = presser (stalks the pace). S = stalker. SS = slow starter / closer.
| Stat | vs. Current Card | vs. All Horses |
|---|---|---|
| Averages
Career-average metrics across all AI race analysis. Performance and pace averages reflect estimated historical performance; trainer and jockey grades score in-the-money percentages. Grading scale: A = elite • B = above average • C = average • D = below average • F = poor • — = no data |
||
| Pick Pony AI Rating | A | A |
| Pace Trip Longshot | — | — |
| Connections Longshot | — | — |
| Situational Longshot | — | — |
| Speed | C | A |
| Early Pace | C | A |
| Mid Pace | C | A |
| Late Pace | A | A |
| Finish Pos | A | B |
| Dirt Speed | B | A |
| Turf Speed | A | A |
| Distance Speed | D | F |
| Trainer Effectiveness | C | C |
| Jockey Effectiveness | C | B |
| 3rd Party Ratings | A | A |
| Recent
Performance analysis from the horse's recent races, weighted to reflect current form. Sprint and Route FPS (Foot Per Second) measure pace efficiency over the horse's recent sprints and routes respectively. Grading scale: A = elite • B = above average • C = average • D = below average • F = poor • — = no data |
||
| Speed | A | A |
| Early Pace | B | A |
| Mid Pace | A | A |
| Late Pace | A | A |
| Sprint FPS | C | A |
| Route FPS | C | B |
| Trainer Effectiveness | C | C |
| Jockey Effectiveness | C | B |
| 3rd Party Ratings | A | A |
| Predictions
AI-generated projections for the upcoming race, derived from prior AI analysis for speed and pace trends, surface and distance suitability, and current conditions. Grading scale: A = elite • B = above average • C = average • D = below average • F = poor • — = no data |
||
| Speed | C | A |
| Early Pace | A | A |
| Mid Pace | D | A |
| Late Pace | C | C |
Chart Guide (2.0.36)
- Bubbles
- Color = surface: green (turf), brown (dirt), blue (synthetic)
- Top number = finishing position; bottom number in parentheses = starting post position
- Height above line = beaten lengths — closer means a smaller margin
- Border = track conditions: green (FST/GD/FM), yellow (WF/SL/YLD), red (SY/MY/FRZ/SFT/HVY)
- Connecting Line
- Solid = good conditions; dashed = bad conditions
- Line Symbol
- ▲ Triangle = sprint (7f or less); ● Circle = route (more than 7f)
- Days Between Races
- Small number above each bubble (e.g. 19d) = days since the previous race — helps spot freshness, layoffs, and tight scheduling.
- Shaded Band (Bollinger)
- Highlights volatility — a wider band means more variation in recent performance
- Performance Trend
- Straight line showing the overall performance direction — angled up = improving, angled down = declining
- Dashed Reference Line
- AI Opponent = AI analysis class-level par for the race
AI Model History Guide
- Lines
- Each solid line shows this horse’s model score over its last 10 races: blue = Mod1, green = Mod2, amber = Mod3.
- Dashed Lines
- Dashed lines represent the current race’s field average for each model — a score below the dashed line indicates the horse ranked below average in this model’s assessment.
- Higher is Stronger
- All three model scores are 0–100: a higher number means the model rates this horse more favorably among the field.
Mod1(W): 82 (1/8) Mod2(W): 75 (2/8) Mod3(W): 79 (3/8) Mod1-LS: 55 (6/8) Win Prob: 18.4% Value Score: 1.35 ★
Performance vs. Peers Guide
- Bars (per post)
- Blue = avg career performance • Amber = avg last 3 races • Green = last race (improved vs. avg) • Red = last race (declined vs. avg)
- Trend Line
- Angled line above the bars: rising = improving form • falling = declining form.
- Horizontal Line
- Field average — the mean career performance of all horses in this race.
- Color Circles
- Standard post-position colors below each lane — same as the Total Pace chart.
- Border
- Thicker border = this horse’s post position.
Figure Comparison
- Rating
- The three Pick Pony algorithm ratings (Algo 1, Algo 2, Algo 3) that make up the overall PP AI Rating — higher is a stronger contender rating.
- Speed
- Career average speed, recent 3-race average, and last-race speed figure — spot horses in improving or declining form.
- Pace
- Average Early (E1), Mid (E2), and Stretch (LP) pace figures — reveals pace-setters vs. closers vs. all-the-way types.
- This horse
- The horse whose stats card is open is highlighted with a darker column background.
Winning Profiles
- Axes
- X: Win % from last 10 starts — Y: In-the-money % (top-3 finishes) from last 10 starts.
- Quadrants
- Consistent Winners (top-right): high win & ITM — reliable performers.
Place Threats (top-left): boards often but doesn’t win often — good exacta/trifecta angles.
Streaky (bottom-right): wins occasionally, misses the board often — all-or-nothing.
Developing (bottom-left): still finding form — longshot territory. - Reference Lines
- Dashed lines mark field averages. Dots to the right win more; dots higher board more.
- This horse
- Highlighted with a gold border and larger dot.
AI Model Comparison
- Winner Models (green)
- Mod1(W), Mod2(W), and Mod3(W) trained to predict race winners. Higher score = stronger contender.
- Longshot Models (red)
- Mod1-LS, Mod2-LS, and Mod3-LS trained to find high-value longshots. Higher score = stronger longshot candidate.
- Form Model (blue)
- Mod4 sequence model trained on recent form patterns. Higher score = stronger recent form profile.
- This horse
- Highlighted with a darker column background.
Race Pace Simulation Guide
- Slider
- Drag left→right to advance from gate to finish. Drag all the way back to reset the race.
- Predicted Finish Order
- Factors in contested pace burn, each horse’s effort curve (peaked-early vs. peaked-late), and wide trip cost from outside posts. Updated live when Track Bias changes.
- Pace Scenario
- Lone Speed: single E horse likely rates and holds. Contested: two E horses burn each other — closers benefit. Hot Pace: speed meltdown, deep closers thrive. Soft: no early speed, moderate fractions throughout.
- Track Bias
- Slider below canvas. −2 = strong closer/wet bias; +2 = strong speed/rail bias. Recomputes the predicted finish order.
- Boxed Indicator
- Dashed orange ring = horse is surrounded (rival ahead, rival behind, wall outside). In a real race this horse must find a clear path to run.
- Running Styles
- E/EE = early speed (rushes to rail). P = presser (stalks the pace). S = stalker. SS = slow starter / closer.
| Stat | vs. Current Card | vs. All Horses |
|---|---|---|
| Averages
Career-average metrics across all AI race analysis. Performance and pace averages reflect estimated historical performance; trainer and jockey grades score in-the-money percentages. Grading scale: A = elite • B = above average • C = average • D = below average • F = poor • — = no data |
||
| Pick Pony AI Rating | A | A |
| Pace Trip Longshot | — | — |
| Connections Longshot | — | — |
| Situational Longshot | — | — |
| Speed | C | A |
| Early Pace | B | A |
| Mid Pace | A | A |
| Late Pace | D | A |
| Finish Pos | D | D |
| Dirt Speed | A | A |
| Turf Speed | F | A |
| Distance Speed | D | F |
| Trainer Effectiveness | A | A |
| Jockey Effectiveness | A | A |
| 3rd Party Ratings | C | A |
| Recent
Performance analysis from the horse's recent races, weighted to reflect current form. Sprint and Route FPS (Foot Per Second) measure pace efficiency over the horse's recent sprints and routes respectively. Grading scale: A = elite • B = above average • C = average • D = below average • F = poor • — = no data |
||
| Speed | F | A |
| Early Pace | C | A |
| Mid Pace | C | A |
| Late Pace | F | C |
| Sprint FPS | A | A |
| Route FPS | B | A |
| Trainer Effectiveness | A | A |
| Jockey Effectiveness | A | A |
| 3rd Party Ratings | C | A |
| Predictions
AI-generated projections for the upcoming race, derived from prior AI analysis for speed and pace trends, surface and distance suitability, and current conditions. Grading scale: A = elite • B = above average • C = average • D = below average • F = poor • — = no data |
||
| Speed | C | A |
| Early Pace | C | A |
| Mid Pace | A | A |
| Late Pace | C | C |
Chart Guide (2.0.36)
- Bubbles
- Color = surface: green (turf), brown (dirt), blue (synthetic)
- Top number = finishing position; bottom number in parentheses = starting post position
- Height above line = beaten lengths — closer means a smaller margin
- Border = track conditions: green (FST/GD/FM), yellow (WF/SL/YLD), red (SY/MY/FRZ/SFT/HVY)
- Connecting Line
- Solid = good conditions; dashed = bad conditions
- Line Symbol
- ▲ Triangle = sprint (7f or less); ● Circle = route (more than 7f)
- Days Between Races
- Small number above each bubble (e.g. 19d) = days since the previous race — helps spot freshness, layoffs, and tight scheduling.
- Shaded Band (Bollinger)
- Highlights volatility — a wider band means more variation in recent performance
- Performance Trend
- Straight line showing the overall performance direction — angled up = improving, angled down = declining
- Dashed Reference Line
- AI Opponent = AI analysis class-level par for the race
AI Model History Guide
- Lines
- Each solid line shows this horse’s model score over its last 10 races: blue = Mod1, green = Mod2, amber = Mod3.
- Dashed Lines
- Dashed lines represent the current race’s field average for each model — a score below the dashed line indicates the horse ranked below average in this model’s assessment.
- Higher is Stronger
- All three model scores are 0–100: a higher number means the model rates this horse more favorably among the field.
Mod1(W): 82 (1/8) Mod2(W): 75 (2/8) Mod3(W): 79 (3/8) Mod1-LS: 55 (6/8) Win Prob: 18.4% Value Score: 1.35 ★
Performance vs. Peers Guide
- Bars (per post)
- Blue = avg career performance • Amber = avg last 3 races • Green = last race (improved vs. avg) • Red = last race (declined vs. avg)
- Trend Line
- Angled line above the bars: rising = improving form • falling = declining form.
- Horizontal Line
- Field average — the mean career performance of all horses in this race.
- Color Circles
- Standard post-position colors below each lane — same as the Total Pace chart.
- Border
- Thicker border = this horse’s post position.
Figure Comparison
- Rating
- The three Pick Pony algorithm ratings (Algo 1, Algo 2, Algo 3) that make up the overall PP AI Rating — higher is a stronger contender rating.
- Speed
- Career average speed, recent 3-race average, and last-race speed figure — spot horses in improving or declining form.
- Pace
- Average Early (E1), Mid (E2), and Stretch (LP) pace figures — reveals pace-setters vs. closers vs. all-the-way types.
- This horse
- The horse whose stats card is open is highlighted with a darker column background.
Winning Profiles
- Axes
- X: Win % from last 10 starts — Y: In-the-money % (top-3 finishes) from last 10 starts.
- Quadrants
- Consistent Winners (top-right): high win & ITM — reliable performers.
Place Threats (top-left): boards often but doesn’t win often — good exacta/trifecta angles.
Streaky (bottom-right): wins occasionally, misses the board often — all-or-nothing.
Developing (bottom-left): still finding form — longshot territory. - Reference Lines
- Dashed lines mark field averages. Dots to the right win more; dots higher board more.
- This horse
- Highlighted with a gold border and larger dot.
AI Model Comparison
- Winner Models (green)
- Mod1(W), Mod2(W), and Mod3(W) trained to predict race winners. Higher score = stronger contender.
- Longshot Models (red)
- Mod1-LS, Mod2-LS, and Mod3-LS trained to find high-value longshots. Higher score = stronger longshot candidate.
- Form Model (blue)
- Mod4 sequence model trained on recent form patterns. Higher score = stronger recent form profile.
- This horse
- Highlighted with a darker column background.
Race Pace Simulation Guide
- Slider
- Drag left→right to advance from gate to finish. Drag all the way back to reset the race.
- Predicted Finish Order
- Factors in contested pace burn, each horse’s effort curve (peaked-early vs. peaked-late), and wide trip cost from outside posts. Updated live when Track Bias changes.
- Pace Scenario
- Lone Speed: single E horse likely rates and holds. Contested: two E horses burn each other — closers benefit. Hot Pace: speed meltdown, deep closers thrive. Soft: no early speed, moderate fractions throughout.
- Track Bias
- Slider below canvas. −2 = strong closer/wet bias; +2 = strong speed/rail bias. Recomputes the predicted finish order.
- Boxed Indicator
- Dashed orange ring = horse is surrounded (rival ahead, rival behind, wall outside). In a real race this horse must find a clear path to run.
- Running Styles
- E/EE = early speed (rushes to rail). P = presser (stalks the pace). S = stalker. SS = slow starter / closer.
| Stat | vs. Current Card | vs. All Horses |
|---|---|---|
| Averages
Career-average metrics across all AI race analysis. Performance and pace averages reflect estimated historical performance; trainer and jockey grades score in-the-money percentages. Grading scale: A = elite • B = above average • C = average • D = below average • F = poor • — = no data |
||
| Pick Pony AI Rating | C | A |
| Pace Trip Longshot | — | — |
| Connections Longshot | — | — |
| Situational Longshot | — | — |
| Speed | B | A |
| Early Pace | A | A |
| Mid Pace | A | A |
| Late Pace | F | A |
| Finish Pos | B | B |
| Dirt Speed | D | F |
| Turf Speed | D | A |
| Distance Speed | B | A |
| Trainer Effectiveness | B | A |
| Jockey Effectiveness | D | C |
| 3rd Party Ratings | C | A |
| Recent
Performance analysis from the horse's recent races, weighted to reflect current form. Sprint and Route FPS (Foot Per Second) measure pace efficiency over the horse's recent sprints and routes respectively. Grading scale: A = elite • B = above average • C = average • D = below average • F = poor • — = no data |
||
| Speed | C | A |
| Early Pace | B | A |
| Mid Pace | A | A |
| Late Pace | D | A |
| Sprint FPS | A | A |
| Route FPS | C | A |
| Trainer Effectiveness | B | A |
| Jockey Effectiveness | D | C |
| 3rd Party Ratings | C | A |
| Predictions
AI-generated projections for the upcoming race, derived from prior AI analysis for speed and pace trends, surface and distance suitability, and current conditions. Grading scale: A = elite • B = above average • C = average • D = below average • F = poor • — = no data |
||
| Speed | A | A |
| Early Pace | A | A |
| Mid Pace | A | A |
| Late Pace | C | C |
Chart Guide (2.0.36)
- Bubbles
- Color = surface: green (turf), brown (dirt), blue (synthetic)
- Top number = finishing position; bottom number in parentheses = starting post position
- Height above line = beaten lengths — closer means a smaller margin
- Border = track conditions: green (FST/GD/FM), yellow (WF/SL/YLD), red (SY/MY/FRZ/SFT/HVY)
- Connecting Line
- Solid = good conditions; dashed = bad conditions
- Line Symbol
- ▲ Triangle = sprint (7f or less); ● Circle = route (more than 7f)
- Days Between Races
- Small number above each bubble (e.g. 19d) = days since the previous race — helps spot freshness, layoffs, and tight scheduling.
- Shaded Band (Bollinger)
- Highlights volatility — a wider band means more variation in recent performance
- Performance Trend
- Straight line showing the overall performance direction — angled up = improving, angled down = declining
- Dashed Reference Line
- AI Opponent = AI analysis class-level par for the race
AI Model History Guide
- Lines
- Each solid line shows this horse’s model score over its last 10 races: blue = Mod1, green = Mod2, amber = Mod3.
- Dashed Lines
- Dashed lines represent the current race’s field average for each model — a score below the dashed line indicates the horse ranked below average in this model’s assessment.
- Higher is Stronger
- All three model scores are 0–100: a higher number means the model rates this horse more favorably among the field.
Mod1(W): 82 (1/8) Mod2(W): 75 (2/8) Mod3(W): 79 (3/8) Mod1-LS: 55 (6/8) Win Prob: 18.4% Value Score: 1.35 ★
Performance vs. Peers Guide
- Bars (per post)
- Blue = avg career performance • Amber = avg last 3 races • Green = last race (improved vs. avg) • Red = last race (declined vs. avg)
- Trend Line
- Angled line above the bars: rising = improving form • falling = declining form.
- Horizontal Line
- Field average — the mean career performance of all horses in this race.
- Color Circles
- Standard post-position colors below each lane — same as the Total Pace chart.
- Border
- Thicker border = this horse’s post position.
Figure Comparison
- Rating
- The three Pick Pony algorithm ratings (Algo 1, Algo 2, Algo 3) that make up the overall PP AI Rating — higher is a stronger contender rating.
- Speed
- Career average speed, recent 3-race average, and last-race speed figure — spot horses in improving or declining form.
- Pace
- Average Early (E1), Mid (E2), and Stretch (LP) pace figures — reveals pace-setters vs. closers vs. all-the-way types.
- This horse
- The horse whose stats card is open is highlighted with a darker column background.
Winning Profiles
- Axes
- X: Win % from last 10 starts — Y: In-the-money % (top-3 finishes) from last 10 starts.
- Quadrants
- Consistent Winners (top-right): high win & ITM — reliable performers.
Place Threats (top-left): boards often but doesn’t win often — good exacta/trifecta angles.
Streaky (bottom-right): wins occasionally, misses the board often — all-or-nothing.
Developing (bottom-left): still finding form — longshot territory. - Reference Lines
- Dashed lines mark field averages. Dots to the right win more; dots higher board more.
- This horse
- Highlighted with a gold border and larger dot.
AI Model Comparison
- Winner Models (green)
- Mod1(W), Mod2(W), and Mod3(W) trained to predict race winners. Higher score = stronger contender.
- Longshot Models (red)
- Mod1-LS, Mod2-LS, and Mod3-LS trained to find high-value longshots. Higher score = stronger longshot candidate.
- Form Model (blue)
- Mod4 sequence model trained on recent form patterns. Higher score = stronger recent form profile.
- This horse
- Highlighted with a darker column background.
Race Pace Simulation Guide
- Slider
- Drag left→right to advance from gate to finish. Drag all the way back to reset the race.
- Predicted Finish Order
- Factors in contested pace burn, each horse’s effort curve (peaked-early vs. peaked-late), and wide trip cost from outside posts. Updated live when Track Bias changes.
- Pace Scenario
- Lone Speed: single E horse likely rates and holds. Contested: two E horses burn each other — closers benefit. Hot Pace: speed meltdown, deep closers thrive. Soft: no early speed, moderate fractions throughout.
- Track Bias
- Slider below canvas. −2 = strong closer/wet bias; +2 = strong speed/rail bias. Recomputes the predicted finish order.
- Boxed Indicator
- Dashed orange ring = horse is surrounded (rival ahead, rival behind, wall outside). In a real race this horse must find a clear path to run.
- Running Styles
- E/EE = early speed (rushes to rail). P = presser (stalks the pace). S = stalker. SS = slow starter / closer.
| Stat | vs. Current Card | vs. All Horses |
|---|---|---|
| Averages
Career-average metrics across all AI race analysis. Performance and pace averages reflect estimated historical performance; trainer and jockey grades score in-the-money percentages. Grading scale: A = elite • B = above average • C = average • D = below average • F = poor • — = no data |
||
| Pick Pony AI Rating | D | C |
| Pace Trip Longshot | — | — |
| Connections Longshot | — | — |
| Situational Longshot | — | — |
| Speed | D | A |
| Early Pace | C | A |
| Mid Pace | C | A |
| Late Pace | C | A |
| Finish Pos | C | C |
| Dirt Speed | C | D |
| Turf Speed | C | A |
| Distance Speed | A | A |
| Trainer Effectiveness | A | A |
| Jockey Effectiveness | B | A |
| 3rd Party Ratings | D | A |
| Recent
Performance analysis from the horse's recent races, weighted to reflect current form. Sprint and Route FPS (Foot Per Second) measure pace efficiency over the horse's recent sprints and routes respectively. Grading scale: A = elite • B = above average • C = average • D = below average • F = poor • — = no data |
||
| Speed | C | A |
| Early Pace | A | A |
| Mid Pace | D | A |
| Late Pace | C | A |
| Sprint FPS | B | A |
| Route FPS | A | A |
| Trainer Effectiveness | A | A |
| Jockey Effectiveness | B | A |
| 3rd Party Ratings | D | A |
| Predictions
AI-generated projections for the upcoming race, derived from prior AI analysis for speed and pace trends, surface and distance suitability, and current conditions. Grading scale: A = elite • B = above average • C = average • D = below average • F = poor • — = no data |
||
| Speed | D | A |
| Early Pace | C | A |
| Mid Pace | C | A |
| Late Pace | C | C |
Chart Guide (2.0.36)
- Bubbles
- Color = surface: green (turf), brown (dirt), blue (synthetic)
- Top number = finishing position; bottom number in parentheses = starting post position
- Height above line = beaten lengths — closer means a smaller margin
- Border = track conditions: green (FST/GD/FM), yellow (WF/SL/YLD), red (SY/MY/FRZ/SFT/HVY)
- Connecting Line
- Solid = good conditions; dashed = bad conditions
- Line Symbol
- ▲ Triangle = sprint (7f or less); ● Circle = route (more than 7f)
- Days Between Races
- Small number above each bubble (e.g. 19d) = days since the previous race — helps spot freshness, layoffs, and tight scheduling.
- Shaded Band (Bollinger)
- Highlights volatility — a wider band means more variation in recent performance
- Performance Trend
- Straight line showing the overall performance direction — angled up = improving, angled down = declining
- Dashed Reference Line
- AI Opponent = AI analysis class-level par for the race
AI Model History Guide
- Lines
- Each solid line shows this horse’s model score over its last 10 races: blue = Mod1, green = Mod2, amber = Mod3.
- Dashed Lines
- Dashed lines represent the current race’s field average for each model — a score below the dashed line indicates the horse ranked below average in this model’s assessment.
- Higher is Stronger
- All three model scores are 0–100: a higher number means the model rates this horse more favorably among the field.
Mod1(W): 82 (1/8) Mod2(W): 75 (2/8) Mod3(W): 79 (3/8) Mod1-LS: 55 (6/8) Win Prob: 18.4% Value Score: 1.35 ★
Performance vs. Peers Guide
- Bars (per post)
- Blue = avg career performance • Amber = avg last 3 races • Green = last race (improved vs. avg) • Red = last race (declined vs. avg)
- Trend Line
- Angled line above the bars: rising = improving form • falling = declining form.
- Horizontal Line
- Field average — the mean career performance of all horses in this race.
- Color Circles
- Standard post-position colors below each lane — same as the Total Pace chart.
- Border
- Thicker border = this horse’s post position.
Figure Comparison
- Rating
- The three Pick Pony algorithm ratings (Algo 1, Algo 2, Algo 3) that make up the overall PP AI Rating — higher is a stronger contender rating.
- Speed
- Career average speed, recent 3-race average, and last-race speed figure — spot horses in improving or declining form.
- Pace
- Average Early (E1), Mid (E2), and Stretch (LP) pace figures — reveals pace-setters vs. closers vs. all-the-way types.
- This horse
- The horse whose stats card is open is highlighted with a darker column background.
Winning Profiles
- Axes
- X: Win % from last 10 starts — Y: In-the-money % (top-3 finishes) from last 10 starts.
- Quadrants
- Consistent Winners (top-right): high win & ITM — reliable performers.
Place Threats (top-left): boards often but doesn’t win often — good exacta/trifecta angles.
Streaky (bottom-right): wins occasionally, misses the board often — all-or-nothing.
Developing (bottom-left): still finding form — longshot territory. - Reference Lines
- Dashed lines mark field averages. Dots to the right win more; dots higher board more.
- This horse
- Highlighted with a gold border and larger dot.
AI Model Comparison
- Winner Models (green)
- Mod1(W), Mod2(W), and Mod3(W) trained to predict race winners. Higher score = stronger contender.
- Longshot Models (red)
- Mod1-LS, Mod2-LS, and Mod3-LS trained to find high-value longshots. Higher score = stronger longshot candidate.
- Form Model (blue)
- Mod4 sequence model trained on recent form patterns. Higher score = stronger recent form profile.
- This horse
- Highlighted with a darker column background.
Race Pace Simulation Guide
- Slider
- Drag left→right to advance from gate to finish. Drag all the way back to reset the race.
- Predicted Finish Order
- Factors in contested pace burn, each horse’s effort curve (peaked-early vs. peaked-late), and wide trip cost from outside posts. Updated live when Track Bias changes.
- Pace Scenario
- Lone Speed: single E horse likely rates and holds. Contested: two E horses burn each other — closers benefit. Hot Pace: speed meltdown, deep closers thrive. Soft: no early speed, moderate fractions throughout.
- Track Bias
- Slider below canvas. −2 = strong closer/wet bias; +2 = strong speed/rail bias. Recomputes the predicted finish order.
- Boxed Indicator
- Dashed orange ring = horse is surrounded (rival ahead, rival behind, wall outside). In a real race this horse must find a clear path to run.
- Running Styles
- E/EE = early speed (rushes to rail). P = presser (stalks the pace). S = stalker. SS = slow starter / closer.
| Stat | vs. Current Card | vs. All Horses |
|---|---|---|
| Averages
Career-average metrics across all AI race analysis. Performance and pace averages reflect estimated historical performance; trainer and jockey grades score in-the-money percentages. Grading scale: A = elite • B = above average • C = average • D = below average • F = poor • — = no data |
||
| Pick Pony AI Rating | C | A |
| Pace Trip Longshot | — | — |
| Connections Longshot | — | — |
| Situational Longshot | — | — |
| Speed | B | A |
| Early Pace | C | A |
| Mid Pace | C | A |
| Late Pace | C | A |
| Finish Pos | D | B |
| Dirt Speed | C | A |
| Turf Speed | B | D |
| Distance Speed | D | F |
| Trainer Effectiveness | C | C |
| Jockey Effectiveness | A | A |
| 3rd Party Ratings | C | A |
| Recent
Performance analysis from the horse's recent races, weighted to reflect current form. Sprint and Route FPS (Foot Per Second) measure pace efficiency over the horse's recent sprints and routes respectively. Grading scale: A = elite • B = above average • C = average • D = below average • F = poor • — = no data |
||
| Speed | C | A |
| Early Pace | C | A |
| Mid Pace | C | A |
| Late Pace | C | A |
| Sprint FPS | A | A |
| Route FPS | A | A |
| Trainer Effectiveness | C | C |
| Jockey Effectiveness | A | A |
| 3rd Party Ratings | C | A |
| Predictions
AI-generated projections for the upcoming race, derived from prior AI analysis for speed and pace trends, surface and distance suitability, and current conditions. Grading scale: A = elite • B = above average • C = average • D = below average • F = poor • — = no data |
||
| Speed | A | A |
| Early Pace | B | A |
| Mid Pace | A | A |
| Late Pace | B | C |
Chart Guide (2.0.36)
- Bubbles
- Color = surface: green (turf), brown (dirt), blue (synthetic)
- Top number = finishing position; bottom number in parentheses = starting post position
- Height above line = beaten lengths — closer means a smaller margin
- Border = track conditions: green (FST/GD/FM), yellow (WF/SL/YLD), red (SY/MY/FRZ/SFT/HVY)
- Connecting Line
- Solid = good conditions; dashed = bad conditions
- Line Symbol
- ▲ Triangle = sprint (7f or less); ● Circle = route (more than 7f)
- Days Between Races
- Small number above each bubble (e.g. 19d) = days since the previous race — helps spot freshness, layoffs, and tight scheduling.
- Shaded Band (Bollinger)
- Highlights volatility — a wider band means more variation in recent performance
- Performance Trend
- Straight line showing the overall performance direction — angled up = improving, angled down = declining
- Dashed Reference Line
- AI Opponent = AI analysis class-level par for the race
AI Model History Guide
- Lines
- Each solid line shows this horse’s model score over its last 10 races: blue = Mod1, green = Mod2, amber = Mod3.
- Dashed Lines
- Dashed lines represent the current race’s field average for each model — a score below the dashed line indicates the horse ranked below average in this model’s assessment.
- Higher is Stronger
- All three model scores are 0–100: a higher number means the model rates this horse more favorably among the field.
Mod1(W): 82 (1/8) Mod2(W): 75 (2/8) Mod3(W): 79 (3/8) Mod1-LS: 55 (6/8) Win Prob: 18.4% Value Score: 1.35 ★
Performance vs. Peers Guide
- Bars (per post)
- Blue = avg career performance • Amber = avg last 3 races • Green = last race (improved vs. avg) • Red = last race (declined vs. avg)
- Trend Line
- Angled line above the bars: rising = improving form • falling = declining form.
- Horizontal Line
- Field average — the mean career performance of all horses in this race.
- Color Circles
- Standard post-position colors below each lane — same as the Total Pace chart.
- Border
- Thicker border = this horse’s post position.
Figure Comparison
- Rating
- The three Pick Pony algorithm ratings (Algo 1, Algo 2, Algo 3) that make up the overall PP AI Rating — higher is a stronger contender rating.
- Speed
- Career average speed, recent 3-race average, and last-race speed figure — spot horses in improving or declining form.
- Pace
- Average Early (E1), Mid (E2), and Stretch (LP) pace figures — reveals pace-setters vs. closers vs. all-the-way types.
- This horse
- The horse whose stats card is open is highlighted with a darker column background.
Winning Profiles
- Axes
- X: Win % from last 10 starts — Y: In-the-money % (top-3 finishes) from last 10 starts.
- Quadrants
- Consistent Winners (top-right): high win & ITM — reliable performers.
Place Threats (top-left): boards often but doesn’t win often — good exacta/trifecta angles.
Streaky (bottom-right): wins occasionally, misses the board often — all-or-nothing.
Developing (bottom-left): still finding form — longshot territory. - Reference Lines
- Dashed lines mark field averages. Dots to the right win more; dots higher board more.
- This horse
- Highlighted with a gold border and larger dot.
AI Model Comparison
- Winner Models (green)
- Mod1(W), Mod2(W), and Mod3(W) trained to predict race winners. Higher score = stronger contender.
- Longshot Models (red)
- Mod1-LS, Mod2-LS, and Mod3-LS trained to find high-value longshots. Higher score = stronger longshot candidate.
- Form Model (blue)
- Mod4 sequence model trained on recent form patterns. Higher score = stronger recent form profile.
- This horse
- Highlighted with a darker column background.
Race Pace Simulation Guide
- Slider
- Drag left→right to advance from gate to finish. Drag all the way back to reset the race.
- Predicted Finish Order
- Factors in contested pace burn, each horse’s effort curve (peaked-early vs. peaked-late), and wide trip cost from outside posts. Updated live when Track Bias changes.
- Pace Scenario
- Lone Speed: single E horse likely rates and holds. Contested: two E horses burn each other — closers benefit. Hot Pace: speed meltdown, deep closers thrive. Soft: no early speed, moderate fractions throughout.
- Track Bias
- Slider below canvas. −2 = strong closer/wet bias; +2 = strong speed/rail bias. Recomputes the predicted finish order.
- Boxed Indicator
- Dashed orange ring = horse is surrounded (rival ahead, rival behind, wall outside). In a real race this horse must find a clear path to run.
- Running Styles
- E/EE = early speed (rushes to rail). P = presser (stalks the pace). S = stalker. SS = slow starter / closer.
| Stat | vs. Current Card | vs. All Horses |
|---|---|---|
| Averages
Career-average metrics across all AI race analysis. Performance and pace averages reflect estimated historical performance; trainer and jockey grades score in-the-money percentages. Grading scale: A = elite • B = above average • C = average • D = below average • F = poor • — = no data |
||
| Pick Pony AI Rating | B | A |
| Pace Trip Longshot | — | — |
| Connections Longshot | — | — |
| Situational Longshot | — | — |
| Speed | A | A |
| Early Pace | B | A |
| Mid Pace | A | A |
| Late Pace | A | A |
| Finish Pos | A | A |
| Dirt Speed | A | A |
| Turf Speed | B | D |
| Distance Speed | D | F |
| Trainer Effectiveness | A | A |
| Jockey Effectiveness | B | A |
| 3rd Party Ratings | A | A |
| Recent
Performance analysis from the horse's recent races, weighted to reflect current form. Sprint and Route FPS (Foot Per Second) measure pace efficiency over the horse's recent sprints and routes respectively. Grading scale: A = elite • B = above average • C = average • D = below average • F = poor • — = no data |
||
| Speed | A | A |
| Early Pace | B | A |
| Mid Pace | A | A |
| Late Pace | A | A |
| Sprint FPS | C | A |
| Route FPS | D | B |
| Trainer Effectiveness | A | A |
| Jockey Effectiveness | B | A |
| 3rd Party Ratings | A | A |
| Predictions
AI-generated projections for the upcoming race, derived from prior AI analysis for speed and pace trends, surface and distance suitability, and current conditions. Grading scale: A = elite • B = above average • C = average • D = below average • F = poor • — = no data |
||
| Speed | B | A |
| Early Pace | A | A |
| Mid Pace | B | A |
| Late Pace | B | C |
Chart Guide (2.0.36)
- Bubbles
- Color = surface: green (turf), brown (dirt), blue (synthetic)
- Top number = finishing position; bottom number in parentheses = starting post position
- Height above line = beaten lengths — closer means a smaller margin
- Border = track conditions: green (FST/GD/FM), yellow (WF/SL/YLD), red (SY/MY/FRZ/SFT/HVY)
- Connecting Line
- Solid = good conditions; dashed = bad conditions
- Line Symbol
- ▲ Triangle = sprint (7f or less); ● Circle = route (more than 7f)
- Days Between Races
- Small number above each bubble (e.g. 19d) = days since the previous race — helps spot freshness, layoffs, and tight scheduling.
- Shaded Band (Bollinger)
- Highlights volatility — a wider band means more variation in recent performance
- Performance Trend
- Straight line showing the overall performance direction — angled up = improving, angled down = declining
- Dashed Reference Line
- AI Opponent = AI analysis class-level par for the race
AI Model History Guide
- Lines
- Each solid line shows this horse’s model score over its last 10 races: blue = Mod1, green = Mod2, amber = Mod3.
- Dashed Lines
- Dashed lines represent the current race’s field average for each model — a score below the dashed line indicates the horse ranked below average in this model’s assessment.
- Higher is Stronger
- All three model scores are 0–100: a higher number means the model rates this horse more favorably among the field.
Mod1(W): 82 (1/8) Mod2(W): 75 (2/8) Mod3(W): 79 (3/8) Mod1-LS: 55 (6/8) Win Prob: 18.4% Value Score: 1.35 ★
Performance vs. Peers Guide
- Bars (per post)
- Blue = avg career performance • Amber = avg last 3 races • Green = last race (improved vs. avg) • Red = last race (declined vs. avg)
- Trend Line
- Angled line above the bars: rising = improving form • falling = declining form.
- Horizontal Line
- Field average — the mean career performance of all horses in this race.
- Color Circles
- Standard post-position colors below each lane — same as the Total Pace chart.
- Border
- Thicker border = this horse’s post position.
Figure Comparison
- Rating
- The three Pick Pony algorithm ratings (Algo 1, Algo 2, Algo 3) that make up the overall PP AI Rating — higher is a stronger contender rating.
- Speed
- Career average speed, recent 3-race average, and last-race speed figure — spot horses in improving or declining form.
- Pace
- Average Early (E1), Mid (E2), and Stretch (LP) pace figures — reveals pace-setters vs. closers vs. all-the-way types.
- This horse
- The horse whose stats card is open is highlighted with a darker column background.
Winning Profiles
- Axes
- X: Win % from last 10 starts — Y: In-the-money % (top-3 finishes) from last 10 starts.
- Quadrants
- Consistent Winners (top-right): high win & ITM — reliable performers.
Place Threats (top-left): boards often but doesn’t win often — good exacta/trifecta angles.
Streaky (bottom-right): wins occasionally, misses the board often — all-or-nothing.
Developing (bottom-left): still finding form — longshot territory. - Reference Lines
- Dashed lines mark field averages. Dots to the right win more; dots higher board more.
- This horse
- Highlighted with a gold border and larger dot.
AI Model Comparison
- Winner Models (green)
- Mod1(W), Mod2(W), and Mod3(W) trained to predict race winners. Higher score = stronger contender.
- Longshot Models (red)
- Mod1-LS, Mod2-LS, and Mod3-LS trained to find high-value longshots. Higher score = stronger longshot candidate.
- Form Model (blue)
- Mod4 sequence model trained on recent form patterns. Higher score = stronger recent form profile.
- This horse
- Highlighted with a darker column background.
Race Pace Simulation Guide
- Slider
- Drag left→right to advance from gate to finish. Drag all the way back to reset the race.
- Predicted Finish Order
- Factors in contested pace burn, each horse’s effort curve (peaked-early vs. peaked-late), and wide trip cost from outside posts. Updated live when Track Bias changes.
- Pace Scenario
- Lone Speed: single E horse likely rates and holds. Contested: two E horses burn each other — closers benefit. Hot Pace: speed meltdown, deep closers thrive. Soft: no early speed, moderate fractions throughout.
- Track Bias
- Slider below canvas. −2 = strong closer/wet bias; +2 = strong speed/rail bias. Recomputes the predicted finish order.
- Boxed Indicator
- Dashed orange ring = horse is surrounded (rival ahead, rival behind, wall outside). In a real race this horse must find a clear path to run.
- Running Styles
- E/EE = early speed (rushes to rail). P = presser (stalks the pace). S = stalker. SS = slow starter / closer.
| Stat | vs. Current Card | vs. All Horses |
|---|---|---|
| Averages
Career-average metrics across all AI race analysis. Performance and pace averages reflect estimated historical performance; trainer and jockey grades score in-the-money percentages. Grading scale: A = elite • B = above average • C = average • D = below average • F = poor • — = no data |
||
| Pick Pony AI Rating | D | C |
| Pace Trip Longshot | — | — |
| Connections Longshot | — | — |
| Situational Longshot | — | — |
| Speed | D | B |
| Early Pace | D | C |
| Mid Pace | D | B |
| Late Pace | D | B |
| Finish Pos | D | B |
| Dirt Speed | D | B |
| Turf Speed | B | D |
| Distance Speed | B | A |
| Trainer Effectiveness | D | D |
| Jockey Effectiveness | D | D |
| 3rd Party Ratings | D | A |
| Recent
Performance analysis from the horse's recent races, weighted to reflect current form. Sprint and Route FPS (Foot Per Second) measure pace efficiency over the horse's recent sprints and routes respectively. Grading scale: A = elite • B = above average • C = average • D = below average • F = poor • — = no data |
||
| Speed | D | B |
| Early Pace | D | C |
| Mid Pace | D | B |
| Late Pace | D | B |
| Sprint FPS | D | A |
| Route FPS | C | A |
| Trainer Effectiveness | D | D |
| Jockey Effectiveness | D | D |
| 3rd Party Ratings | D | A |
| Predictions
AI-generated projections for the upcoming race, derived from prior AI analysis for speed and pace trends, surface and distance suitability, and current conditions. Grading scale: A = elite • B = above average • C = average • D = below average • F = poor • — = no data |
||
| Speed | D | C |
| Early Pace | D | C |
| Mid Pace | D | C |
| Late Pace | B | C |
Chart Guide (2.0.36)
- Bubbles
- Color = surface: green (turf), brown (dirt), blue (synthetic)
- Top number = finishing position; bottom number in parentheses = starting post position
- Height above line = beaten lengths — closer means a smaller margin
- Border = track conditions: green (FST/GD/FM), yellow (WF/SL/YLD), red (SY/MY/FRZ/SFT/HVY)
- Connecting Line
- Solid = good conditions; dashed = bad conditions
- Line Symbol
- ▲ Triangle = sprint (7f or less); ● Circle = route (more than 7f)
- Days Between Races
- Small number above each bubble (e.g. 19d) = days since the previous race — helps spot freshness, layoffs, and tight scheduling.
- Shaded Band (Bollinger)
- Highlights volatility — a wider band means more variation in recent performance
- Performance Trend
- Straight line showing the overall performance direction — angled up = improving, angled down = declining
- Dashed Reference Line
- AI Opponent = AI analysis class-level par for the race
AI Model History Guide
- Lines
- Each solid line shows this horse’s model score over its last 10 races: blue = Mod1, green = Mod2, amber = Mod3.
- Dashed Lines
- Dashed lines represent the current race’s field average for each model — a score below the dashed line indicates the horse ranked below average in this model’s assessment.
- Higher is Stronger
- All three model scores are 0–100: a higher number means the model rates this horse more favorably among the field.
Mod1(W): 82 (1/8) Mod2(W): 75 (2/8) Mod3(W): 79 (3/8) Mod1-LS: 55 (6/8) Win Prob: 18.4% Value Score: 1.35 ★
Performance vs. Peers Guide
- Bars (per post)
- Blue = avg career performance • Amber = avg last 3 races • Green = last race (improved vs. avg) • Red = last race (declined vs. avg)
- Trend Line
- Angled line above the bars: rising = improving form • falling = declining form.
- Horizontal Line
- Field average — the mean career performance of all horses in this race.
- Color Circles
- Standard post-position colors below each lane — same as the Total Pace chart.
- Border
- Thicker border = this horse’s post position.
Figure Comparison
- Rating
- The three Pick Pony algorithm ratings (Algo 1, Algo 2, Algo 3) that make up the overall PP AI Rating — higher is a stronger contender rating.
- Speed
- Career average speed, recent 3-race average, and last-race speed figure — spot horses in improving or declining form.
- Pace
- Average Early (E1), Mid (E2), and Stretch (LP) pace figures — reveals pace-setters vs. closers vs. all-the-way types.
- This horse
- The horse whose stats card is open is highlighted with a darker column background.
Winning Profiles
- Axes
- X: Win % from last 10 starts — Y: In-the-money % (top-3 finishes) from last 10 starts.
- Quadrants
- Consistent Winners (top-right): high win & ITM — reliable performers.
Place Threats (top-left): boards often but doesn’t win often — good exacta/trifecta angles.
Streaky (bottom-right): wins occasionally, misses the board often — all-or-nothing.
Developing (bottom-left): still finding form — longshot territory. - Reference Lines
- Dashed lines mark field averages. Dots to the right win more; dots higher board more.
- This horse
- Highlighted with a gold border and larger dot.
AI Model Comparison
- Winner Models (green)
- Mod1(W), Mod2(W), and Mod3(W) trained to predict race winners. Higher score = stronger contender.
- Longshot Models (red)
- Mod1-LS, Mod2-LS, and Mod3-LS trained to find high-value longshots. Higher score = stronger longshot candidate.
- Form Model (blue)
- Mod4 sequence model trained on recent form patterns. Higher score = stronger recent form profile.
- This horse
- Highlighted with a darker column background.
Race Pace Simulation Guide
- Slider
- Drag left→right to advance from gate to finish. Drag all the way back to reset the race.
- Predicted Finish Order
- Factors in contested pace burn, each horse’s effort curve (peaked-early vs. peaked-late), and wide trip cost from outside posts. Updated live when Track Bias changes.
- Pace Scenario
- Lone Speed: single E horse likely rates and holds. Contested: two E horses burn each other — closers benefit. Hot Pace: speed meltdown, deep closers thrive. Soft: no early speed, moderate fractions throughout.
- Track Bias
- Slider below canvas. −2 = strong closer/wet bias; +2 = strong speed/rail bias. Recomputes the predicted finish order.
- Boxed Indicator
- Dashed orange ring = horse is surrounded (rival ahead, rival behind, wall outside). In a real race this horse must find a clear path to run.
- Running Styles
- E/EE = early speed (rushes to rail). P = presser (stalks the pace). S = stalker. SS = slow starter / closer.
| Stat | vs. Current Card | vs. All Horses |
|---|---|---|
| Averages
Career-average metrics across all AI race analysis. Performance and pace averages reflect estimated historical performance; trainer and jockey grades score in-the-money percentages. Grading scale: A = elite • B = above average • C = average • D = below average • F = poor • — = no data |
||
| Pick Pony AI Rating | A | A |
| Pace Trip Longshot | — | — |
| Connections Longshot | — | — |
| Situational Longshot | — | — |
| Speed | C | A |
| Early Pace | A | A |
| Mid Pace | B | A |
| Late Pace | B | A |
| Finish Pos | B | A |
| Dirt Speed | B | A |
| Turf Speed | B | D |
| Distance Speed | A | A |
| Trainer Effectiveness | B | A |
| Jockey Effectiveness | C | A |
| 3rd Party Ratings | B | A |
| Recent
Performance analysis from the horse's recent races, weighted to reflect current form. Sprint and Route FPS (Foot Per Second) measure pace efficiency over the horse's recent sprints and routes respectively. Grading scale: A = elite • B = above average • C = average • D = below average • F = poor • — = no data |
||
| Speed | B | A |
| Early Pace | A | A |
| Mid Pace | B | A |
| Late Pace | B | A |
| Sprint FPS | B | A |
| Route FPS | B | A |
| Trainer Effectiveness | B | A |
| Jockey Effectiveness | C | A |
| 3rd Party Ratings | B | A |
| Predictions
AI-generated projections for the upcoming race, derived from prior AI analysis for speed and pace trends, surface and distance suitability, and current conditions. Grading scale: A = elite • B = above average • C = average • D = below average • F = poor • — = no data |
||
| Speed | C | A |
| Early Pace | C | B |
| Mid Pace | C | A |
| Late Pace | B | C |
Chart Guide (2.0.36)
- Bubbles
- Color = surface: green (turf), brown (dirt), blue (synthetic)
- Top number = finishing position; bottom number in parentheses = starting post position
- Height above line = beaten lengths — closer means a smaller margin
- Border = track conditions: green (FST/GD/FM), yellow (WF/SL/YLD), red (SY/MY/FRZ/SFT/HVY)
- Connecting Line
- Solid = good conditions; dashed = bad conditions
- Line Symbol
- ▲ Triangle = sprint (7f or less); ● Circle = route (more than 7f)
- Days Between Races
- Small number above each bubble (e.g. 19d) = days since the previous race — helps spot freshness, layoffs, and tight scheduling.
- Shaded Band (Bollinger)
- Highlights volatility — a wider band means more variation in recent performance
- Performance Trend
- Straight line showing the overall performance direction — angled up = improving, angled down = declining
- Dashed Reference Line
- AI Opponent = AI analysis class-level par for the race
AI Model History Guide
- Lines
- Each solid line shows this horse’s model score over its last 10 races: blue = Mod1, green = Mod2, amber = Mod3.
- Dashed Lines
- Dashed lines represent the current race’s field average for each model — a score below the dashed line indicates the horse ranked below average in this model’s assessment.
- Higher is Stronger
- All three model scores are 0–100: a higher number means the model rates this horse more favorably among the field.
Mod1(W): 82 (1/8) Mod2(W): 75 (2/8) Mod3(W): 79 (3/8) Mod1-LS: 55 (6/8) Win Prob: 18.4% Value Score: 1.35 ★
Performance vs. Peers Guide
- Bars (per post)
- Blue = avg career performance • Amber = avg last 3 races • Green = last race (improved vs. avg) • Red = last race (declined vs. avg)
- Trend Line
- Angled line above the bars: rising = improving form • falling = declining form.
- Horizontal Line
- Field average — the mean career performance of all horses in this race.
- Color Circles
- Standard post-position colors below each lane — same as the Total Pace chart.
- Border
- Thicker border = this horse’s post position.
Figure Comparison
- Rating
- The three Pick Pony algorithm ratings (Algo 1, Algo 2, Algo 3) that make up the overall PP AI Rating — higher is a stronger contender rating.
- Speed
- Career average speed, recent 3-race average, and last-race speed figure — spot horses in improving or declining form.
- Pace
- Average Early (E1), Mid (E2), and Stretch (LP) pace figures — reveals pace-setters vs. closers vs. all-the-way types.
- This horse
- The horse whose stats card is open is highlighted with a darker column background.
Winning Profiles
- Axes
- X: Win % from last 10 starts — Y: In-the-money % (top-3 finishes) from last 10 starts.
- Quadrants
- Consistent Winners (top-right): high win & ITM — reliable performers.
Place Threats (top-left): boards often but doesn’t win often — good exacta/trifecta angles.
Streaky (bottom-right): wins occasionally, misses the board often — all-or-nothing.
Developing (bottom-left): still finding form — longshot territory. - Reference Lines
- Dashed lines mark field averages. Dots to the right win more; dots higher board more.
- This horse
- Highlighted with a gold border and larger dot.
AI Model Comparison
- Winner Models (green)
- Mod1(W), Mod2(W), and Mod3(W) trained to predict race winners. Higher score = stronger contender.
- Longshot Models (red)
- Mod1-LS, Mod2-LS, and Mod3-LS trained to find high-value longshots. Higher score = stronger longshot candidate.
- Form Model (blue)
- Mod4 sequence model trained on recent form patterns. Higher score = stronger recent form profile.
- This horse
- Highlighted with a darker column background.
Race Pace Simulation Guide
- Slider
- Drag left→right to advance from gate to finish. Drag all the way back to reset the race.
- Predicted Finish Order
- Factors in contested pace burn, each horse’s effort curve (peaked-early vs. peaked-late), and wide trip cost from outside posts. Updated live when Track Bias changes.
- Pace Scenario
- Lone Speed: single E horse likely rates and holds. Contested: two E horses burn each other — closers benefit. Hot Pace: speed meltdown, deep closers thrive. Soft: no early speed, moderate fractions throughout.
- Track Bias
- Slider below canvas. −2 = strong closer/wet bias; +2 = strong speed/rail bias. Recomputes the predicted finish order.
- Boxed Indicator
- Dashed orange ring = horse is surrounded (rival ahead, rival behind, wall outside). In a real race this horse must find a clear path to run.
- Running Styles
- E/EE = early speed (rushes to rail). P = presser (stalks the pace). S = stalker. SS = slow starter / closer.
| Stat | vs. Current Card | vs. All Horses |
|---|---|---|
| Averages
Career-average metrics across all AI race analysis. Performance and pace averages reflect estimated historical performance; trainer and jockey grades score in-the-money percentages. Grading scale: A = elite • B = above average • C = average • D = below average • F = poor • — = no data |
||
| Pick Pony AI Rating | C | B |
| Pace Trip Longshot | — | — |
| Connections Longshot | — | — |
| Situational Longshot | — | — |
| Speed | D | A |
| Early Pace | C | C |
| Mid Pace | F | B |
| Late Pace | A | A |
| Finish Pos | A | B |
| Dirt Speed | B | A |
| Turf Speed | D | A |
| Distance Speed | F | F |
| Trainer Effectiveness | C | B |
| Jockey Effectiveness | A | A |
| 3rd Party Ratings | B | A |
| Recent
Performance analysis from the horse's recent races, weighted to reflect current form. Sprint and Route FPS (Foot Per Second) measure pace efficiency over the horse's recent sprints and routes respectively. Grading scale: A = elite • B = above average • C = average • D = below average • F = poor • — = no data |
||
| Speed | D | A |
| Early Pace | C | C |
| Mid Pace | D | B |
| Late Pace | A | A |
| Sprint FPS | D | C |
| Route FPS | D | C |
| Trainer Effectiveness | C | B |
| Jockey Effectiveness | A | A |
| 3rd Party Ratings | B | A |
| Predictions
AI-generated projections for the upcoming race, derived from prior AI analysis for speed and pace trends, surface and distance suitability, and current conditions. Grading scale: A = elite • B = above average • C = average • D = below average • F = poor • — = no data |
||
| Speed | D | A |
| Early Pace | C | C |
| Mid Pace | F | B |
| Late Pace | C | C |
Chart Guide (2.0.36)
- Bubbles
- Color = surface: green (turf), brown (dirt), blue (synthetic)
- Top number = finishing position; bottom number in parentheses = starting post position
- Height above line = beaten lengths — closer means a smaller margin
- Border = track conditions: green (FST/GD/FM), yellow (WF/SL/YLD), red (SY/MY/FRZ/SFT/HVY)
- Connecting Line
- Solid = good conditions; dashed = bad conditions
- Line Symbol
- ▲ Triangle = sprint (7f or less); ● Circle = route (more than 7f)
- Days Between Races
- Small number above each bubble (e.g. 19d) = days since the previous race — helps spot freshness, layoffs, and tight scheduling.
- Shaded Band (Bollinger)
- Highlights volatility — a wider band means more variation in recent performance
- Performance Trend
- Straight line showing the overall performance direction — angled up = improving, angled down = declining
- Dashed Reference Line
- AI Opponent = AI analysis class-level par for the race
AI Model History Guide
- Lines
- Each solid line shows this horse’s model score over its last 10 races: blue = Mod1, green = Mod2, amber = Mod3.
- Dashed Lines
- Dashed lines represent the current race’s field average for each model — a score below the dashed line indicates the horse ranked below average in this model’s assessment.
- Higher is Stronger
- All three model scores are 0–100: a higher number means the model rates this horse more favorably among the field.
Mod1(W): 82 (1/8) Mod2(W): 75 (2/8) Mod3(W): 79 (3/8) Mod1-LS: 55 (6/8) Win Prob: 18.4% Value Score: 1.35 ★
Performance vs. Peers Guide
- Bars (per post)
- Blue = avg career performance • Amber = avg last 3 races • Green = last race (improved vs. avg) • Red = last race (declined vs. avg)
- Trend Line
- Angled line above the bars: rising = improving form • falling = declining form.
- Horizontal Line
- Field average — the mean career performance of all horses in this race.
- Color Circles
- Standard post-position colors below each lane — same as the Total Pace chart.
- Border
- Thicker border = this horse’s post position.
Figure Comparison
- Rating
- The three Pick Pony algorithm ratings (Algo 1, Algo 2, Algo 3) that make up the overall PP AI Rating — higher is a stronger contender rating.
- Speed
- Career average speed, recent 3-race average, and last-race speed figure — spot horses in improving or declining form.
- Pace
- Average Early (E1), Mid (E2), and Stretch (LP) pace figures — reveals pace-setters vs. closers vs. all-the-way types.
- This horse
- The horse whose stats card is open is highlighted with a darker column background.
Winning Profiles
- Axes
- X: Win % from last 10 starts — Y: In-the-money % (top-3 finishes) from last 10 starts.
- Quadrants
- Consistent Winners (top-right): high win & ITM — reliable performers.
Place Threats (top-left): boards often but doesn’t win often — good exacta/trifecta angles.
Streaky (bottom-right): wins occasionally, misses the board often — all-or-nothing.
Developing (bottom-left): still finding form — longshot territory. - Reference Lines
- Dashed lines mark field averages. Dots to the right win more; dots higher board more.
- This horse
- Highlighted with a gold border and larger dot.
AI Model Comparison
- Winner Models (green)
- Mod1(W), Mod2(W), and Mod3(W) trained to predict race winners. Higher score = stronger contender.
- Longshot Models (red)
- Mod1-LS, Mod2-LS, and Mod3-LS trained to find high-value longshots. Higher score = stronger longshot candidate.
- Form Model (blue)
- Mod4 sequence model trained on recent form patterns. Higher score = stronger recent form profile.
- This horse
- Highlighted with a darker column background.
Race Pace Simulation Guide
- Slider
- Drag left→right to advance from gate to finish. Drag all the way back to reset the race.
- Predicted Finish Order
- Factors in contested pace burn, each horse’s effort curve (peaked-early vs. peaked-late), and wide trip cost from outside posts. Updated live when Track Bias changes.
- Pace Scenario
- Lone Speed: single E horse likely rates and holds. Contested: two E horses burn each other — closers benefit. Hot Pace: speed meltdown, deep closers thrive. Soft: no early speed, moderate fractions throughout.
- Track Bias
- Slider below canvas. −2 = strong closer/wet bias; +2 = strong speed/rail bias. Recomputes the predicted finish order.
- Boxed Indicator
- Dashed orange ring = horse is surrounded (rival ahead, rival behind, wall outside). In a real race this horse must find a clear path to run.
- Running Styles
- E/EE = early speed (rushes to rail). P = presser (stalks the pace). S = stalker. SS = slow starter / closer.
| Stat | vs. Current Card | vs. All Horses |
|---|---|---|
| Averages
Career-average metrics across all AI race analysis. Performance and pace averages reflect estimated historical performance; trainer and jockey grades score in-the-money percentages. Grading scale: A = elite • B = above average • C = average • D = below average • F = poor • — = no data |
||
| Pick Pony AI Rating | B | A |
| Pace Trip Longshot | — | — |
| Connections Longshot | — | — |
| Situational Longshot | — | — |
| Speed | A | A |
| Early Pace | A | B |
| Mid Pace | A | A |
| Late Pace | D | B |
| Finish Pos | D | D |
| Dirt Speed | A | A |
| Turf Speed | B | A |
| Distance Speed | C | A |
| Trainer Effectiveness | A | A |
| Jockey Effectiveness | C | C |
| 3rd Party Ratings | B | A |
| Recent
Performance analysis from the horse's recent races, weighted to reflect current form. Sprint and Route FPS (Foot Per Second) measure pace efficiency over the horse's recent sprints and routes respectively. Grading scale: A = elite • B = above average • C = average • D = below average • F = poor • — = no data |
||
| Speed | A | A |
| Early Pace | A | A |
| Mid Pace | A | A |
| Late Pace | D | C |
| Sprint FPS | B | A |
| Route FPS | A | A |
| Trainer Effectiveness | A | A |
| Jockey Effectiveness | C | C |
| 3rd Party Ratings | B | A |
| Predictions
AI-generated projections for the upcoming race, derived from prior AI analysis for speed and pace trends, surface and distance suitability, and current conditions. Grading scale: A = elite • B = above average • C = average • D = below average • F = poor • — = no data |
||
| Speed | A | A |
| Early Pace | A | B |
| Mid Pace | B | A |
| Late Pace | C | C |
Chart Guide (2.0.36)
- Bubbles
- Color = surface: green (turf), brown (dirt), blue (synthetic)
- Top number = finishing position; bottom number in parentheses = starting post position
- Height above line = beaten lengths — closer means a smaller margin
- Border = track conditions: green (FST/GD/FM), yellow (WF/SL/YLD), red (SY/MY/FRZ/SFT/HVY)
- Connecting Line
- Solid = good conditions; dashed = bad conditions
- Line Symbol
- ▲ Triangle = sprint (7f or less); ● Circle = route (more than 7f)
- Days Between Races
- Small number above each bubble (e.g. 19d) = days since the previous race — helps spot freshness, layoffs, and tight scheduling.
- Shaded Band (Bollinger)
- Highlights volatility — a wider band means more variation in recent performance
- Performance Trend
- Straight line showing the overall performance direction — angled up = improving, angled down = declining
- Dashed Reference Line
- AI Opponent = AI analysis class-level par for the race
AI Model History Guide
- Lines
- Each solid line shows this horse’s model score over its last 10 races: blue = Mod1, green = Mod2, amber = Mod3.
- Dashed Lines
- Dashed lines represent the current race’s field average for each model — a score below the dashed line indicates the horse ranked below average in this model’s assessment.
- Higher is Stronger
- All three model scores are 0–100: a higher number means the model rates this horse more favorably among the field.
Mod1(W): 82 (1/8) Mod2(W): 75 (2/8) Mod3(W): 79 (3/8) Mod1-LS: 55 (6/8) Win Prob: 18.4% Value Score: 1.35 ★
Performance vs. Peers Guide
- Bars (per post)
- Blue = avg career performance • Amber = avg last 3 races • Green = last race (improved vs. avg) • Red = last race (declined vs. avg)
- Trend Line
- Angled line above the bars: rising = improving form • falling = declining form.
- Horizontal Line
- Field average — the mean career performance of all horses in this race.
- Color Circles
- Standard post-position colors below each lane — same as the Total Pace chart.
- Border
- Thicker border = this horse’s post position.
Figure Comparison
- Rating
- The three Pick Pony algorithm ratings (Algo 1, Algo 2, Algo 3) that make up the overall PP AI Rating — higher is a stronger contender rating.
- Speed
- Career average speed, recent 3-race average, and last-race speed figure — spot horses in improving or declining form.
- Pace
- Average Early (E1), Mid (E2), and Stretch (LP) pace figures — reveals pace-setters vs. closers vs. all-the-way types.
- This horse
- The horse whose stats card is open is highlighted with a darker column background.
Winning Profiles
- Axes
- X: Win % from last 10 starts — Y: In-the-money % (top-3 finishes) from last 10 starts.
- Quadrants
- Consistent Winners (top-right): high win & ITM — reliable performers.
Place Threats (top-left): boards often but doesn’t win often — good exacta/trifecta angles.
Streaky (bottom-right): wins occasionally, misses the board often — all-or-nothing.
Developing (bottom-left): still finding form — longshot territory. - Reference Lines
- Dashed lines mark field averages. Dots to the right win more; dots higher board more.
- This horse
- Highlighted with a gold border and larger dot.
AI Model Comparison
- Winner Models (green)
- Mod1(W), Mod2(W), and Mod3(W) trained to predict race winners. Higher score = stronger contender.
- Longshot Models (red)
- Mod1-LS, Mod2-LS, and Mod3-LS trained to find high-value longshots. Higher score = stronger longshot candidate.
- Form Model (blue)
- Mod4 sequence model trained on recent form patterns. Higher score = stronger recent form profile.
- This horse
- Highlighted with a darker column background.
Race Pace Simulation Guide
- Slider
- Drag left→right to advance from gate to finish. Drag all the way back to reset the race.
- Predicted Finish Order
- Factors in contested pace burn, each horse’s effort curve (peaked-early vs. peaked-late), and wide trip cost from outside posts. Updated live when Track Bias changes.
- Pace Scenario
- Lone Speed: single E horse likely rates and holds. Contested: two E horses burn each other — closers benefit. Hot Pace: speed meltdown, deep closers thrive. Soft: no early speed, moderate fractions throughout.
- Track Bias
- Slider below canvas. −2 = strong closer/wet bias; +2 = strong speed/rail bias. Recomputes the predicted finish order.
- Boxed Indicator
- Dashed orange ring = horse is surrounded (rival ahead, rival behind, wall outside). In a real race this horse must find a clear path to run.
- Running Styles
- E/EE = early speed (rushes to rail). P = presser (stalks the pace). S = stalker. SS = slow starter / closer.
| Stat | vs. Current Card | vs. All Horses |
|---|---|---|
| Averages
Career-average metrics across all AI race analysis. Performance and pace averages reflect estimated historical performance; trainer and jockey grades score in-the-money percentages. Grading scale: A = elite • B = above average • C = average • D = below average • F = poor • — = no data |
||
| Pick Pony AI Rating | A | A |
| Pace Trip Longshot | — | — |
| Connections Longshot | — | — |
| Situational Longshot | — | — |
| Speed | F | A |
| Early Pace | A | B |
| Mid Pace | A | A |
| Late Pace | F | D |
| Finish Pos | F | F |
| Dirt Speed | A | A |
| Turf Speed | A | A |
| Distance Speed | A | A |
| Trainer Effectiveness | F | C |
| Jockey Effectiveness | B | A |
| 3rd Party Ratings | F | A |
| Recent
Performance analysis from the horse's recent races, weighted to reflect current form. Sprint and Route FPS (Foot Per Second) measure pace efficiency over the horse's recent sprints and routes respectively. Grading scale: A = elite • B = above average • C = average • D = below average • F = poor • — = no data |
||
| Speed | B | A |
| Early Pace | A | A |
| Mid Pace | A | A |
| Late Pace | D | C |
| Sprint FPS | A | A |
| Route FPS | A | A |
| Trainer Effectiveness | F | C |
| Jockey Effectiveness | B | A |
| 3rd Party Ratings | F | A |
| Predictions
AI-generated projections for the upcoming race, derived from prior AI analysis for speed and pace trends, surface and distance suitability, and current conditions. Grading scale: A = elite • B = above average • C = average • D = below average • F = poor • — = no data |
||
| Speed | F | A |
| Early Pace | D | C |
| Mid Pace | A | A |
| Late Pace | C | C |
Chart Guide (2.0.36)
- Bubbles
- Color = surface: green (turf), brown (dirt), blue (synthetic)
- Top number = finishing position; bottom number in parentheses = starting post position
- Height above line = beaten lengths — closer means a smaller margin
- Border = track conditions: green (FST/GD/FM), yellow (WF/SL/YLD), red (SY/MY/FRZ/SFT/HVY)
- Connecting Line
- Solid = good conditions; dashed = bad conditions
- Line Symbol
- ▲ Triangle = sprint (7f or less); ● Circle = route (more than 7f)
- Days Between Races
- Small number above each bubble (e.g. 19d) = days since the previous race — helps spot freshness, layoffs, and tight scheduling.
- Shaded Band (Bollinger)
- Highlights volatility — a wider band means more variation in recent performance
- Performance Trend
- Straight line showing the overall performance direction — angled up = improving, angled down = declining
- Dashed Reference Line
- AI Opponent = AI analysis class-level par for the race
AI Model History Guide
- Lines
- Each solid line shows this horse’s model score over its last 10 races: blue = Mod1, green = Mod2, amber = Mod3.
- Dashed Lines
- Dashed lines represent the current race’s field average for each model — a score below the dashed line indicates the horse ranked below average in this model’s assessment.
- Higher is Stronger
- All three model scores are 0–100: a higher number means the model rates this horse more favorably among the field.
Mod1(W): 82 (1/8) Mod2(W): 75 (2/8) Mod3(W): 79 (3/8) Mod1-LS: 55 (6/8) Win Prob: 18.4% Value Score: 1.35 ★
Performance vs. Peers Guide
- Bars (per post)
- Blue = avg career performance • Amber = avg last 3 races • Green = last race (improved vs. avg) • Red = last race (declined vs. avg)
- Trend Line
- Angled line above the bars: rising = improving form • falling = declining form.
- Horizontal Line
- Field average — the mean career performance of all horses in this race.
- Color Circles
- Standard post-position colors below each lane — same as the Total Pace chart.
- Border
- Thicker border = this horse’s post position.
Figure Comparison
- Rating
- The three Pick Pony algorithm ratings (Algo 1, Algo 2, Algo 3) that make up the overall PP AI Rating — higher is a stronger contender rating.
- Speed
- Career average speed, recent 3-race average, and last-race speed figure — spot horses in improving or declining form.
- Pace
- Average Early (E1), Mid (E2), and Stretch (LP) pace figures — reveals pace-setters vs. closers vs. all-the-way types.
- This horse
- The horse whose stats card is open is highlighted with a darker column background.
Winning Profiles
- Axes
- X: Win % from last 10 starts — Y: In-the-money % (top-3 finishes) from last 10 starts.
- Quadrants
- Consistent Winners (top-right): high win & ITM — reliable performers.
Place Threats (top-left): boards often but doesn’t win often — good exacta/trifecta angles.
Streaky (bottom-right): wins occasionally, misses the board often — all-or-nothing.
Developing (bottom-left): still finding form — longshot territory. - Reference Lines
- Dashed lines mark field averages. Dots to the right win more; dots higher board more.
- This horse
- Highlighted with a gold border and larger dot.
AI Model Comparison
- Winner Models (green)
- Mod1(W), Mod2(W), and Mod3(W) trained to predict race winners. Higher score = stronger contender.
- Longshot Models (red)
- Mod1-LS, Mod2-LS, and Mod3-LS trained to find high-value longshots. Higher score = stronger longshot candidate.
- Form Model (blue)
- Mod4 sequence model trained on recent form patterns. Higher score = stronger recent form profile.
- This horse
- Highlighted with a darker column background.
Race Pace Simulation Guide
- Slider
- Drag left→right to advance from gate to finish. Drag all the way back to reset the race.
- Predicted Finish Order
- Factors in contested pace burn, each horse’s effort curve (peaked-early vs. peaked-late), and wide trip cost from outside posts. Updated live when Track Bias changes.
- Pace Scenario
- Lone Speed: single E horse likely rates and holds. Contested: two E horses burn each other — closers benefit. Hot Pace: speed meltdown, deep closers thrive. Soft: no early speed, moderate fractions throughout.
- Track Bias
- Slider below canvas. −2 = strong closer/wet bias; +2 = strong speed/rail bias. Recomputes the predicted finish order.
- Boxed Indicator
- Dashed orange ring = horse is surrounded (rival ahead, rival behind, wall outside). In a real race this horse must find a clear path to run.
- Running Styles
- E/EE = early speed (rushes to rail). P = presser (stalks the pace). S = stalker. SS = slow starter / closer.
| Stat | vs. Current Card | vs. All Horses |
|---|---|---|
| Averages
Career-average metrics across all AI race analysis. Performance and pace averages reflect estimated historical performance; trainer and jockey grades score in-the-money percentages. Grading scale: A = elite • B = above average • C = average • D = below average • F = poor • — = no data |
||
| Pick Pony AI Rating | A | A |
| Pace Trip Longshot | — | — |
| Connections Longshot | — | — |
| Situational Longshot | — | — |
| Speed | A | A |
| Early Pace | A | A |
| Mid Pace | A | A |
| Late Pace | D | B |
| Finish Pos | D | F |
| Dirt Speed | C | B |
| Turf Speed | A | A |
| Distance Speed | A | A |
| Trainer Effectiveness | D | C |
| Jockey Effectiveness | A | A |
| 3rd Party Ratings | A | A |
| Recent
Performance analysis from the horse's recent races, weighted to reflect current form. Sprint and Route FPS (Foot Per Second) measure pace efficiency over the horse's recent sprints and routes respectively. Grading scale: A = elite • B = above average • C = average • D = below average • F = poor • — = no data |
||
| Speed | C | A |
| Early Pace | A | A |
| Mid Pace | A | A |
| Late Pace | F | C |
| Sprint FPS | B | B |
| Route FPS | B | A |
| Trainer Effectiveness | D | C |
| Jockey Effectiveness | A | A |
| 3rd Party Ratings | A | A |
| Predictions
AI-generated projections for the upcoming race, derived from prior AI analysis for speed and pace trends, surface and distance suitability, and current conditions. Grading scale: A = elite • B = above average • C = average • D = below average • F = poor • — = no data |
||
| Speed | B | A |
| Early Pace | A | A |
| Mid Pace | A | A |
| Late Pace | C | C |
Chart Guide (2.0.36)
- Bubbles
- Color = surface: green (turf), brown (dirt), blue (synthetic)
- Top number = finishing position; bottom number in parentheses = starting post position
- Height above line = beaten lengths — closer means a smaller margin
- Border = track conditions: green (FST/GD/FM), yellow (WF/SL/YLD), red (SY/MY/FRZ/SFT/HVY)
- Connecting Line
- Solid = good conditions; dashed = bad conditions
- Line Symbol
- ▲ Triangle = sprint (7f or less); ● Circle = route (more than 7f)
- Days Between Races
- Small number above each bubble (e.g. 19d) = days since the previous race — helps spot freshness, layoffs, and tight scheduling.
- Shaded Band (Bollinger)
- Highlights volatility — a wider band means more variation in recent performance
- Performance Trend
- Straight line showing the overall performance direction — angled up = improving, angled down = declining
- Dashed Reference Line
- AI Opponent = AI analysis class-level par for the race
AI Model History Guide
- Lines
- Each solid line shows this horse’s model score over its last 10 races: blue = Mod1, green = Mod2, amber = Mod3.
- Dashed Lines
- Dashed lines represent the current race’s field average for each model — a score below the dashed line indicates the horse ranked below average in this model’s assessment.
- Higher is Stronger
- All three model scores are 0–100: a higher number means the model rates this horse more favorably among the field.
Mod1(W): 82 (1/8) Mod2(W): 75 (2/8) Mod3(W): 79 (3/8) Mod1-LS: 55 (6/8) Win Prob: 18.4% Value Score: 1.35 ★
Performance vs. Peers Guide
- Bars (per post)
- Blue = avg career performance • Amber = avg last 3 races • Green = last race (improved vs. avg) • Red = last race (declined vs. avg)
- Trend Line
- Angled line above the bars: rising = improving form • falling = declining form.
- Horizontal Line
- Field average — the mean career performance of all horses in this race.
- Color Circles
- Standard post-position colors below each lane — same as the Total Pace chart.
- Border
- Thicker border = this horse’s post position.
Figure Comparison
- Rating
- The three Pick Pony algorithm ratings (Algo 1, Algo 2, Algo 3) that make up the overall PP AI Rating — higher is a stronger contender rating.
- Speed
- Career average speed, recent 3-race average, and last-race speed figure — spot horses in improving or declining form.
- Pace
- Average Early (E1), Mid (E2), and Stretch (LP) pace figures — reveals pace-setters vs. closers vs. all-the-way types.
- This horse
- The horse whose stats card is open is highlighted with a darker column background.
Winning Profiles
- Axes
- X: Win % from last 10 starts — Y: In-the-money % (top-3 finishes) from last 10 starts.
- Quadrants
- Consistent Winners (top-right): high win & ITM — reliable performers.
Place Threats (top-left): boards often but doesn’t win often — good exacta/trifecta angles.
Streaky (bottom-right): wins occasionally, misses the board often — all-or-nothing.
Developing (bottom-left): still finding form — longshot territory. - Reference Lines
- Dashed lines mark field averages. Dots to the right win more; dots higher board more.
- This horse
- Highlighted with a gold border and larger dot.
AI Model Comparison
- Winner Models (green)
- Mod1(W), Mod2(W), and Mod3(W) trained to predict race winners. Higher score = stronger contender.
- Longshot Models (red)
- Mod1-LS, Mod2-LS, and Mod3-LS trained to find high-value longshots. Higher score = stronger longshot candidate.
- Form Model (blue)
- Mod4 sequence model trained on recent form patterns. Higher score = stronger recent form profile.
- This horse
- Highlighted with a darker column background.
Race Pace Simulation Guide
- Slider
- Drag left→right to advance from gate to finish. Drag all the way back to reset the race.
- Predicted Finish Order
- Factors in contested pace burn, each horse’s effort curve (peaked-early vs. peaked-late), and wide trip cost from outside posts. Updated live when Track Bias changes.
- Pace Scenario
- Lone Speed: single E horse likely rates and holds. Contested: two E horses burn each other — closers benefit. Hot Pace: speed meltdown, deep closers thrive. Soft: no early speed, moderate fractions throughout.
- Track Bias
- Slider below canvas. −2 = strong closer/wet bias; +2 = strong speed/rail bias. Recomputes the predicted finish order.
- Boxed Indicator
- Dashed orange ring = horse is surrounded (rival ahead, rival behind, wall outside). In a real race this horse must find a clear path to run.
- Running Styles
- E/EE = early speed (rushes to rail). P = presser (stalks the pace). S = stalker. SS = slow starter / closer.
| Stat | vs. Current Card | vs. All Horses |
|---|---|---|
| Averages
Career-average metrics across all AI race analysis. Performance and pace averages reflect estimated historical performance; trainer and jockey grades score in-the-money percentages. Grading scale: A = elite • B = above average • C = average • D = below average • F = poor • — = no data |
||
| Pick Pony AI Rating | D | B |
| Pace Trip Longshot | — | — |
| Connections Longshot | — | — |
| Situational Longshot | — | — |
| Speed | B | A |
| Early Pace | C | C |
| Mid Pace | C | B |
| Late Pace | C | A |
| Finish Pos | C | D |
| Dirt Speed | A | A |
| Turf Speed | A | A |
| Distance Speed | D | A |
| Trainer Effectiveness | D | C |
| Jockey Effectiveness | B | B |
| 3rd Party Ratings | A | A |
| Recent
Performance analysis from the horse's recent races, weighted to reflect current form. Sprint and Route FPS (Foot Per Second) measure pace efficiency over the horse's recent sprints and routes respectively. Grading scale: A = elite • B = above average • C = average • D = below average • F = poor • — = no data |
||
| Speed | D | A |
| Early Pace | B | B |
| Mid Pace | C | A |
| Late Pace | F | C |
| Sprint FPS | C | B |
| Route FPS | C | B |
| Trainer Effectiveness | D | C |
| Jockey Effectiveness | B | B |
| 3rd Party Ratings | A | A |
| Predictions
AI-generated projections for the upcoming race, derived from prior AI analysis for speed and pace trends, surface and distance suitability, and current conditions. Grading scale: A = elite • B = above average • C = average • D = below average • F = poor • — = no data |
||
| Speed | C | A |
| Early Pace | C | C |
| Mid Pace | D | B |
| Late Pace | C | C |
TL;DR
Toggle
Get more in-depth analysis, expert picks, handicapper reports, AI picks, handicapping tools, in-article data tooltips, NO ADVERTISEMENTS, and other membership perks with a Pick Pony subscription!
Don’t forget Pick Pony’s Expert Picks, AI Picks, and Past Performance Sheets/Racing Forms!
The Pick Pony Handicapper's Report is published daily and provides analysis of all races on the card. A Pick Pony analyst prepares the report, so selections may differ from the Pick Pony Expert Picks, which are based on the consensus of all Pick Pony analysts.
Welcome to a spectacular Sunday of racing at Santa Anita Park. The Great Race Place plays host to a nine-race card featuring two graded-quality stakes events: the Clocker's Corner Stakes for turf sprinters and the Grade 3 Las Virgenes Stakes for Kentucky Oaks hopefuls. Today's card offers a mix of surface challenges, with the turf course rail set at 20 feet, which typically favors horses with tactical speed who can save ground before tipping out in the lane. The dirt main track has been playing fair but often tilts toward early speed in sprints.
The headline event is the Las Virgenes Stakes (Race 8), a pivotal prep race for the Kentucky Oaks. We see a rematch of the Breeders' Cup Juvenile Fillies, featuring the champion Super Corredora and the speedy Explora. With a small but elite field, pace tactics will be everything. Earlier on the card, the Clocker's Corner (Race 7) brings back the lightning-fast Speed Boat Beach to the downhill turf course, a configuration that demands agility and a high cruising speed.
Weather and Track Conditions
The forecast for Arcadia is picture-perfect for racing. Expect sunny skies with a high near 80 degrees Fahrenheit and a low of 54 degrees. Winds will be light out of the west at approximately 5 mph.
Based on these conditions, the dirt track will be Fast. The surface at Santa Anita has been lively recently, and with the warm temperatures, it should be tightening up, potentially increasing the advantage for front-runners.
The turf course will be Firm. The rail setting at 20 feet is significant; on the 6 1/2 furlong downhill course and mile routes, this setting can sometimes create a bottleneck for deep closers. Look for horses that can establish position early.
Jockey Notes and Insights
Juan Hernandez continues to be the dominant force in the colony, especially when teaming up with Bob Baffert. His ride on Explora in the Las Virgenes will be a masterclass in pace control. If he clears the field early, he becomes very dangerous.
Flavien Prat remains the go-to rider for turf routes and patient trips. His mount on Sumter in the Clocker's Corner suggests the horse is sitting on a big effort. Prat's ability to time his move on the hill is second to none.
Keep an eye on Antonio Fresu, who has been riding superbly for Simon Callaghan and Doug O'Neill. He often finds value on mid-range shots and has a knack for saving ground on the 20-foot rail setting.
Trainer Notes and Insights
Bob Baffert sends out key contenders in the stakes races. His barn has been firing at a high percentage with 3-year-olds on the dirt. The fact that he brings Explora back this quickly after the Santa Ynez signals she is thriving.
Michael McCarthy has a strong hand in the turf races today. His entrants in the 9th race, particularly Genius Jimmy and Wizard of Westwood, look well-spotted. McCarthy horses often improve significantly in their second start off a layoff.
John Sadler's barn is heating up. With Super Corredora in the feature and Flyover in the sprint stakes, Sadler is looking to make a statement. His horses have been working sharply in the mornings.
Best Wagering Strategies and Value Plays
The Early Pick 5 (Races 1-5) looks approachable today. Anchoring the ticket with Not A Sinner in the first or Voldemort in the second allows for spreading in the more contentious legs like Race 3 and 5.
In the Late Pick 4 (Races 6-9), the Las Virgenes (Race 8) acts as a potential single with Explora or a narrow two-deep spread with Super Corredora. This opens up the budget to go deep in the wide-open Race 9 turf finale.
Value Play: In Race 7, Sumter offers compelling value against the likely heavy favorite Speed Boat Beach. If the speed duel heats up, Sumter has the class to run them down.
Race 1 Analysis
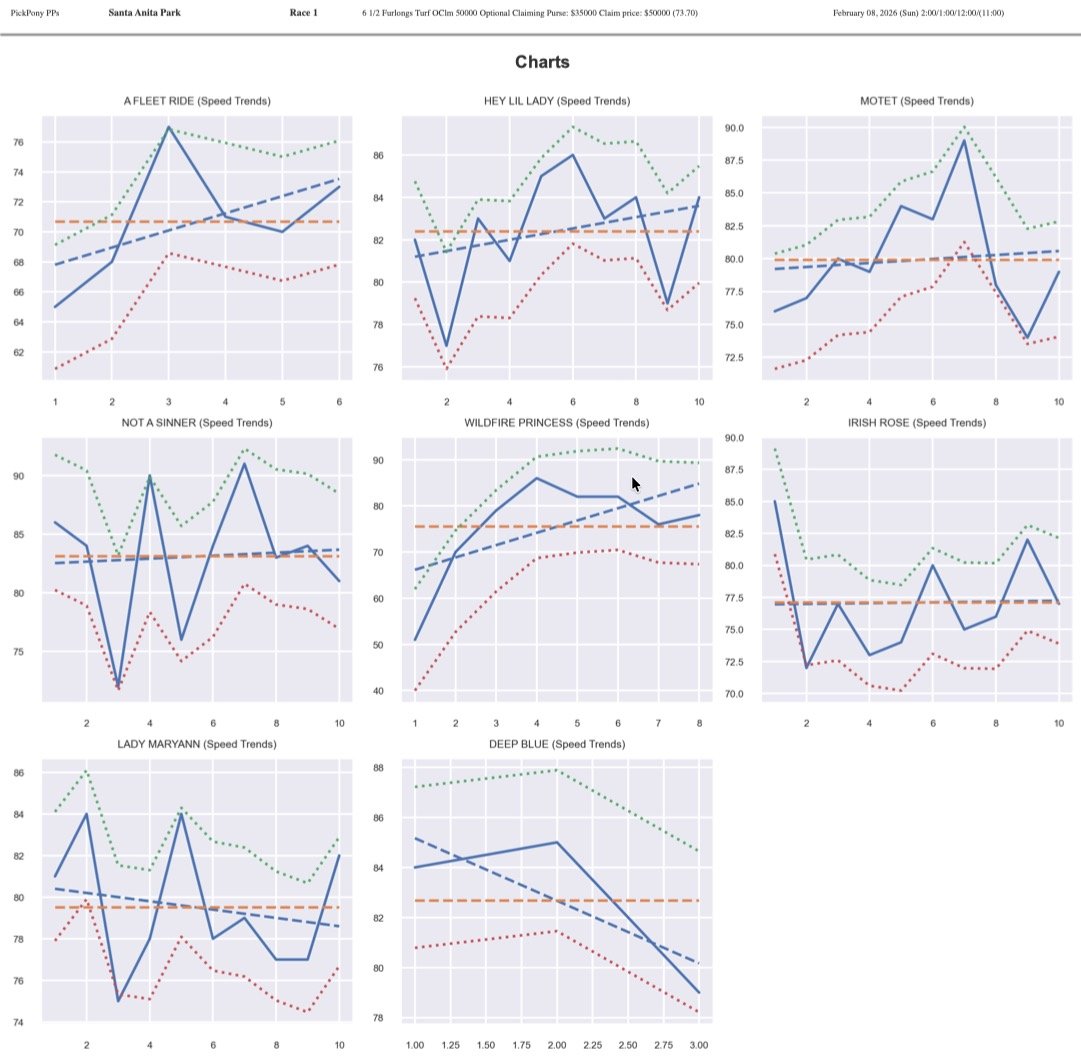
Pace Analysis
The day begins with a sprint down the hillside turf course. A Fleet Ride has significant early foot and will likely gun for the lead from the rail. Not A Sinner (GB) has tactical speed and should sit just off the pace. The rail at 20 feet emphasizes the need to break sharp.
Key Contenders
Not A Sinner (GB) (4) is the consensus top pick among handicappers. Trained by Simon Callaghan and ridden by Antonio Fresu, this Euro import has the turn of foot that suits this course perfectly. Her form suggests she is ready to clear this condition.
A Fleet Ride (1) is the speed of the speed. Emisael Jaramillo is an aggressive gate rider, and if he can shake loose early, this filly might play a game of catch-me-if-you-can. The main question is whether she can handle the unique crossover of the hill.
Secondary Choices
Wildfire Princess (5) gets the services of Juan Hernandez. She has been consistent and fits well with this group. She will likely be stalking the pace and looking for first run at the top of the lane.
Deep Blue (8) draws the outside post, which can be advantageous on the hill to avoid traffic crossing the dirt. She has been scratched recently but returns here in a spot where she can pick up the pieces if the pace collapses.
Longshots
Irish Rose (6) adds intrigue for Neil Drysdale. While her recent form is modest, Drysdale is dangerous with turf sprinters, and she could hit the board at a price.
Betting Strategy
Focus on Not A Sinner (GB) to win. An exact box of Not A Sinner and A Fleet Ride is a solid play.
Selections
Win: Not A Sinner (GB) (4) – 35% confidence
Place: A Fleet Ride (1) – 25% confidence
Show: Wildfire Princess (5) – 20% confidence
Alternative: Deep Blue (8) – 10% confidence
Race 2 Analysis
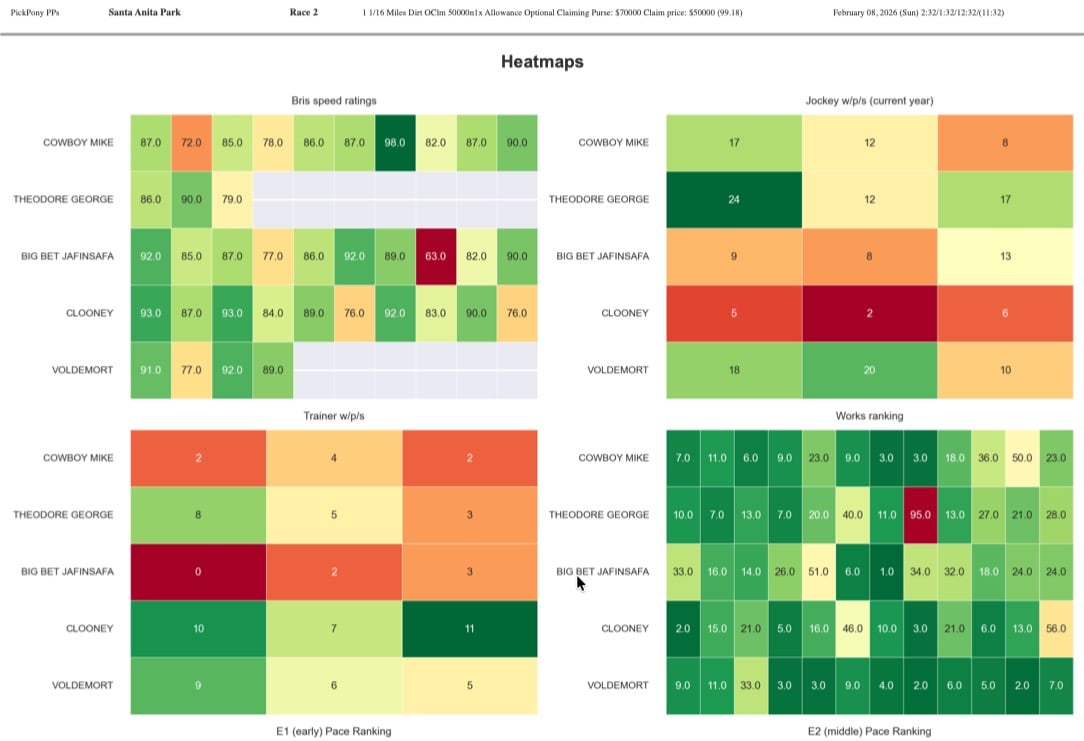
Pace Analysis
This dirt mile features a small field where pace will be dictated by Voldemort and possibly Cowboy Mike. Voldemort has natural speed and draws the outside, allowing Hernandez to view the race from the jump.
Key Contenders
Voldemort (5) is the one to beat. The Baffert/Hernandez combination is lethal in these optional claimers. He has the speed to clear and the stamina to hold off challengers. His recent works have been swift.
Cowboy Mike (1) breaks from the rail. He has back class and can grind out a victory if the pace is honest. Kazushi Kimura will need to hustle him to prevent getting buried on the fence.
Secondary Choices
Theodore George (2) gets Flavien Prat. This horse often puts in an honest effort but tends to hang in the stretch. Prat's patient hands might be the difference maker today to get him over the hump.
Longshots
Big Bet Jafinsafa (3) is a veteran who knows this track well. While he may have lost a step, he is capable of a minor award if the top two falter.
Betting Strategy
Voldemort looks like a potential single in multi-race wagers. A straight Exacta 5-1 is the logical play.
Selections
Win: Voldemort (5) – 45% confidence
Place: Cowboy Mike (1) – 30% confidence
Show: Theodore George (2) – 15% confidence
Alternative: Big Bet Jafinsafa (3) – 5% confidence
Race 3 Analysis
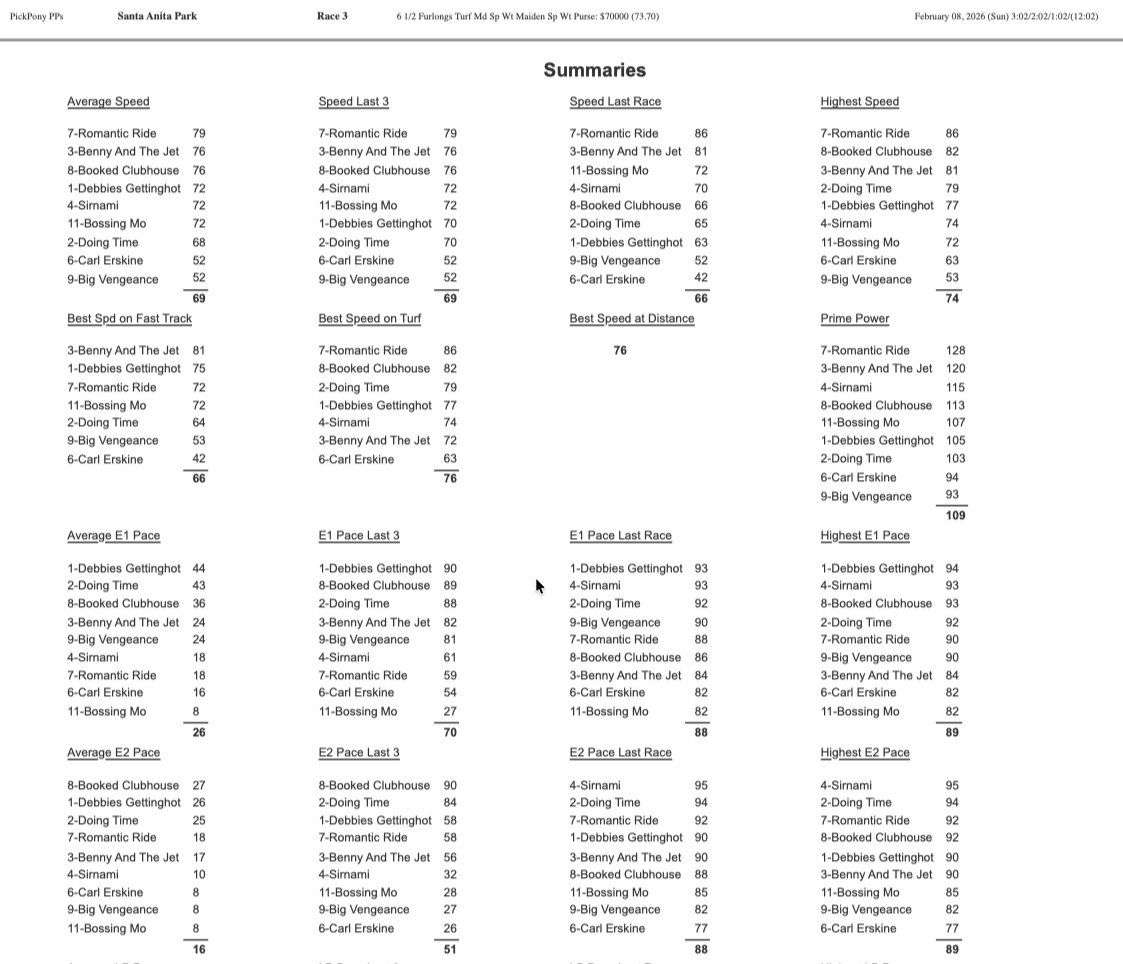
Pace Analysis
A full field of Cal-bred maidens sprinting on the turf. This race is chaotic. Sirnami and Romantic Ride show speed on paper. Expect a scramble for position into the turn.
Key Contenders
Romantic Ride (7) has shown flashes of talent. Hernandez stays aboard for Vladimir Cerin, which is a positive sign. If he breaks clean, he can dictate terms or sit a perfect stalking trip.
Sirnami (4) has been knocking on the door. Mike Puype adds blinkers or tweaks the equipment often to find that extra edge. Kimura is a good fit for a horse that needs a well-timed ride.
Secondary Choices
Lucky Sniper (5) goes out for Dan Blacker with Fresu up. This barn does well with turf sprinters, and the horse has been working steadily.
Whiz Kidd (12) draws the far outside. While the post is tough, it ensures a clean trip. If he has speed, he can clear; if not, he can drop in.
Longshots
Hungover (10) for Ryan Hanson could be a sneaky play. This barn pops with first-time turf horses or young maidens at a price.
Betting Strategy
This is a spread race. Use Romantic Ride, Sirnami, and Lucky Sniper in your Pick 5.
Selections
Win: Romantic Ride (7) – 28% confidence
Place: Sirnami (4) – 22% confidence
Show: Lucky Sniper (5) – 18% confidence
Alternative: Whiz Kidd (12) – 10% confidence
Race 4 Analysis
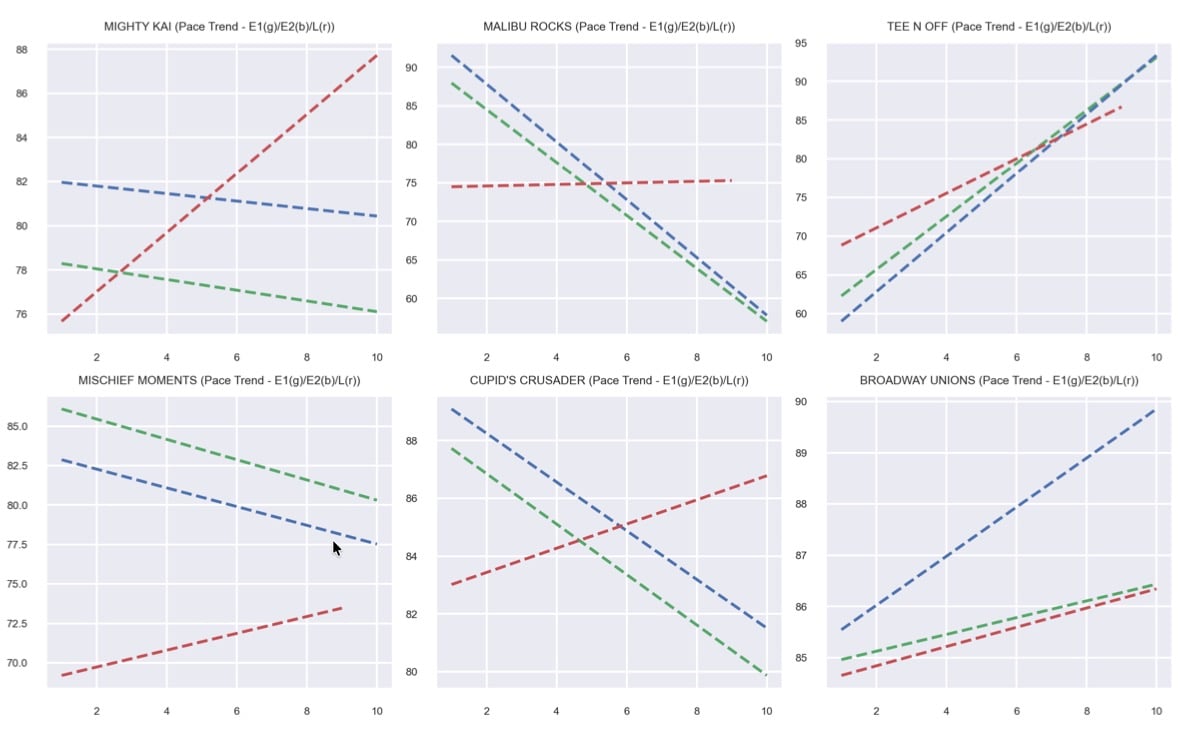
Pace Analysis
A low-level claiming event on the dirt. Mischief Moments and Tee N Off likely vie for the lead. The pace should be honest but not scorching.
Key Contenders
Mischief Moments (4) drops into a spot where he should be very competitive. The Gomez barn places them where they can win. He has the speed to control the race.
Tee N Off (3) is a consistent grinder. Steve Knapp does well with these claiming types. He will be right there at the finish.
Secondary Choices
Mighty Kai (1) draws the rail. If he can save ground and find a seam, he has a shot. Doug O'Neill's horses usually run their race at this level.
Longshots
Cupid's Crusader (5) is an older veteran. He might not have the turn of foot of the younger horses, but he will be passing tired rivals late.
Betting Strategy
Mischief Moments is the safest play. Trifecta key 4 over 1,3,5.
Selections
Win: Mischief Moments (4) – 32% confidence
Place: Tee N Off (3) – 25% confidence
Show: Mighty Kai (1) – 20% confidence
Alternative: Cupid's Crusader (5) – 10% confidence
Race 5 Analysis
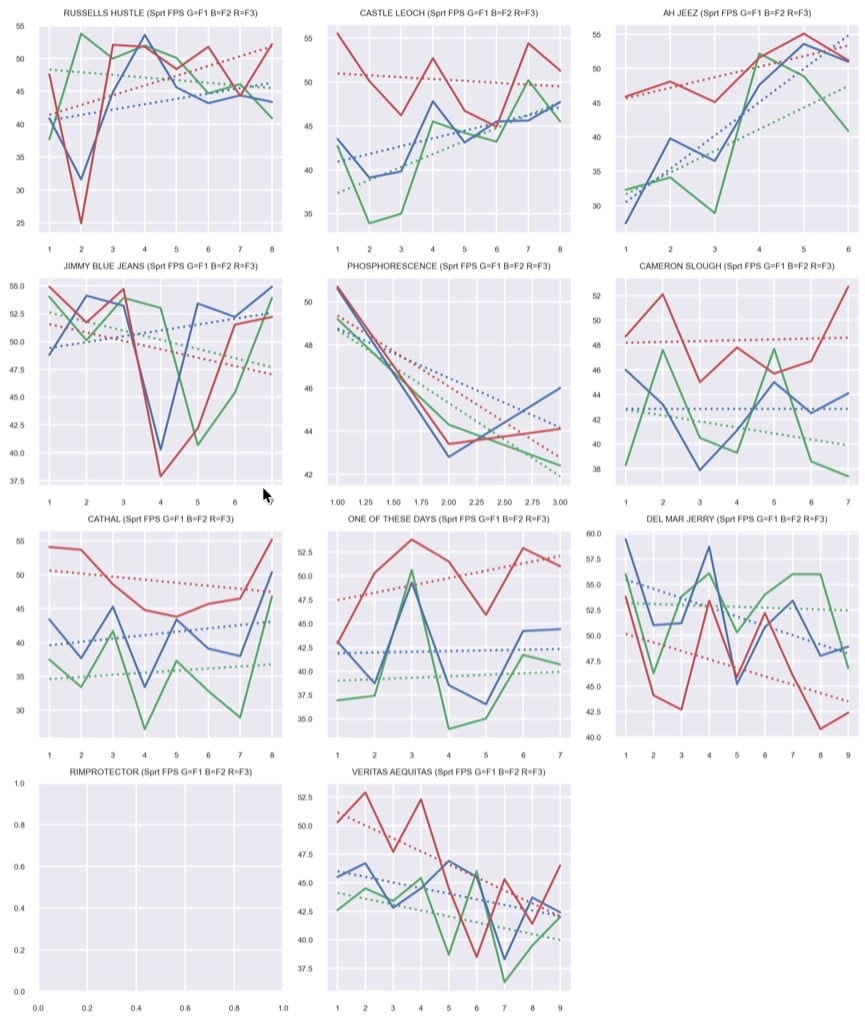
Pace Analysis
A turf route with a large field. Jimmy Blue Jeans and Russells Hustle have speed. The run to the first turn is crucial. Expect a contested pace which sets up for a closer.
Key Contenders
Phosphorescence (FR) (5) is a class act. Flavien Prat riding for McCarthy is a huge endorsement. This horse has faced tougher company and should relish this group.
Jimmy Blue Jeans (4) is a hard-knocking veteran. He will be on or near the lead. If he is allowed to walk the dog, he can steal it.
Secondary Choices
Russells Hustle (1) draws the rail and must go. Antonio Fresu will try to nurse his speed. He is dangerous if left alone.
Ah Jeez (3) is another O'Neill runner who fits well here. He has a good turn of foot and should be in the mix late.
Longshots
One Of These Days (IRE) (8) offers value. The European imports often improve with time in the States. Juan Hernandez taking the mount is a very interesting signal.
Betting Strategy
Phosphorescence is the most likely winner, but Jimmy Blue Jeans is the speed threat. Play them both in the Pick 5.
Selections
Win: Phosphorescence (FR) (5) – 30% confidence
Place: Jimmy Blue Jeans (4) – 25% confidence
Show: One Of These Days (IRE) (8) – 15% confidence
Alternative: Russells Hustle (1) – 12% confidence
Race 6 Analysis
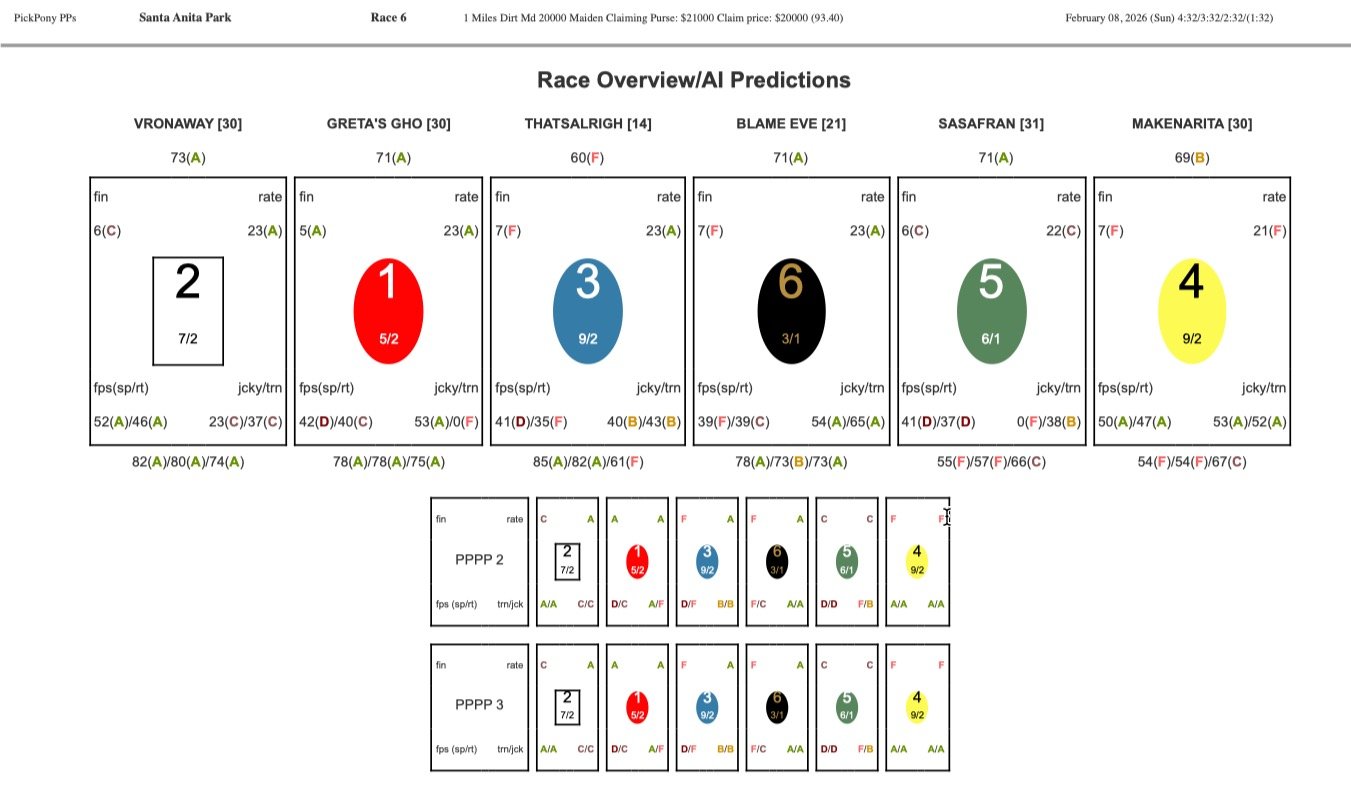
Pace Analysis
Maiden Claiming on the dirt. Makenarita and Blame Eve look to be the primary speed. In these lower level maiden races, the one who makes the fewest mistakes wins.
Key Contenders
Blame Eve (6) looks primed for a win. Leonard Powell and Juan Hernandez team up on this filly. She draws the outside of the main group, allowing for a clean trip.
Greta's Ghost (1) drops in class or finds a softer spot. Florent Geroux is a strong rider for this level. The rail draw is the only concern if she doesn't break.
Secondary Choices
Makenarita (4) has speed and Kimura aboard. She will likely be sent hard. If she clears, she could be gone.
Longshots
Vronaway (2) is a steady type who could pick up a share if the pace melts down.
Betting Strategy
Blame Eve should be tough to beat. Win bet on 6.
Selections
Win: Blame Eve (6) – 38% confidence
Place: Greta's Ghost (1) – 25% confidence
Show: Makenarita (4) – 20% confidence
Alternative: Vronaway (2) – 10% confidence
Race 7 Analysis (Clocker’s Corner Stakes)
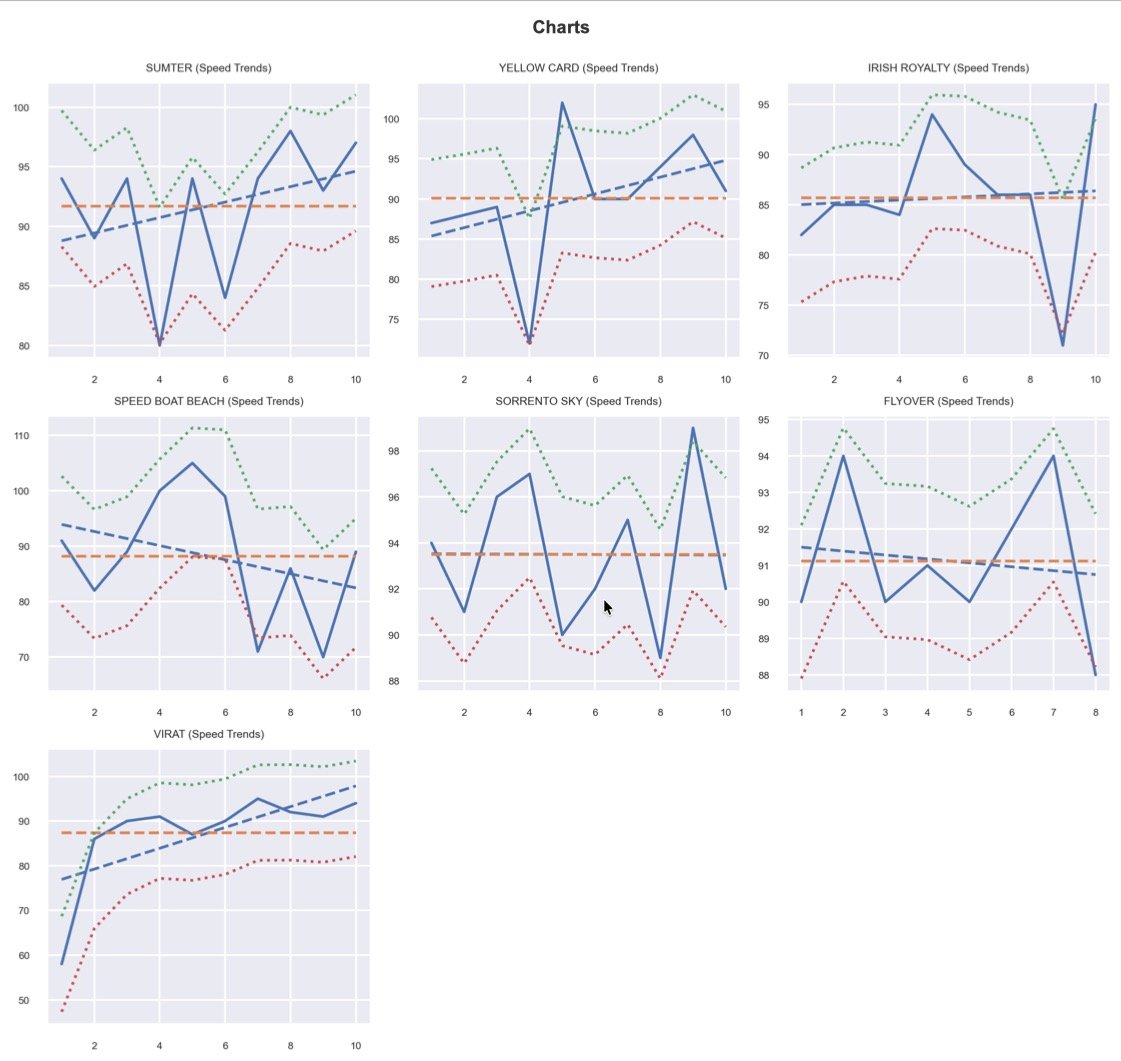
Pace Analysis
Speed Boat Beach is the designated speed. He is extremely fast and will blast from the gate. Sumter and Yellow Card will chase. The race likely comes down to whether Speed Boat Beach can carry his speed the full 6 1/2 furlongs down the hill.
Key Contenders
Speed Boat Beach (4) is a specialist at this game. Baffert has him ready. His speed figures are superior to the field. He is the one to catch and the one to beat.
Sumter (1) is the class alternative. Mandella and Prat are a formidable team. Sumter loves the turf and can stalk and pounce. If Speed Boat Beach falters, Sumter will be there.
Secondary Choices
Yellow Card (2) has been consistent. Jaramillo provides aggressive handling. He needs a career best to beat the top two.
Flyover (6) is a solid Cal-bred. He faces open company here but is honest and tries hard.
Longshots
Virat (7) is getting older but still has some kick. He would need a pace meltdown to win but could fill out the superfecta.
Betting Strategy
Speed Boat Beach is the most probable winner, but Sumter offers better value. Exacta Box 1-4.
Selections
Win: Speed Boat Beach (4) – 45% confidence
Place: Sumter (1) – 35% confidence
Show: Yellow Card (2) – 10% confidence
Alternative: Flyover (6) – 5% confidence
Race 8 Analysis (Las Virgenes Stakes)
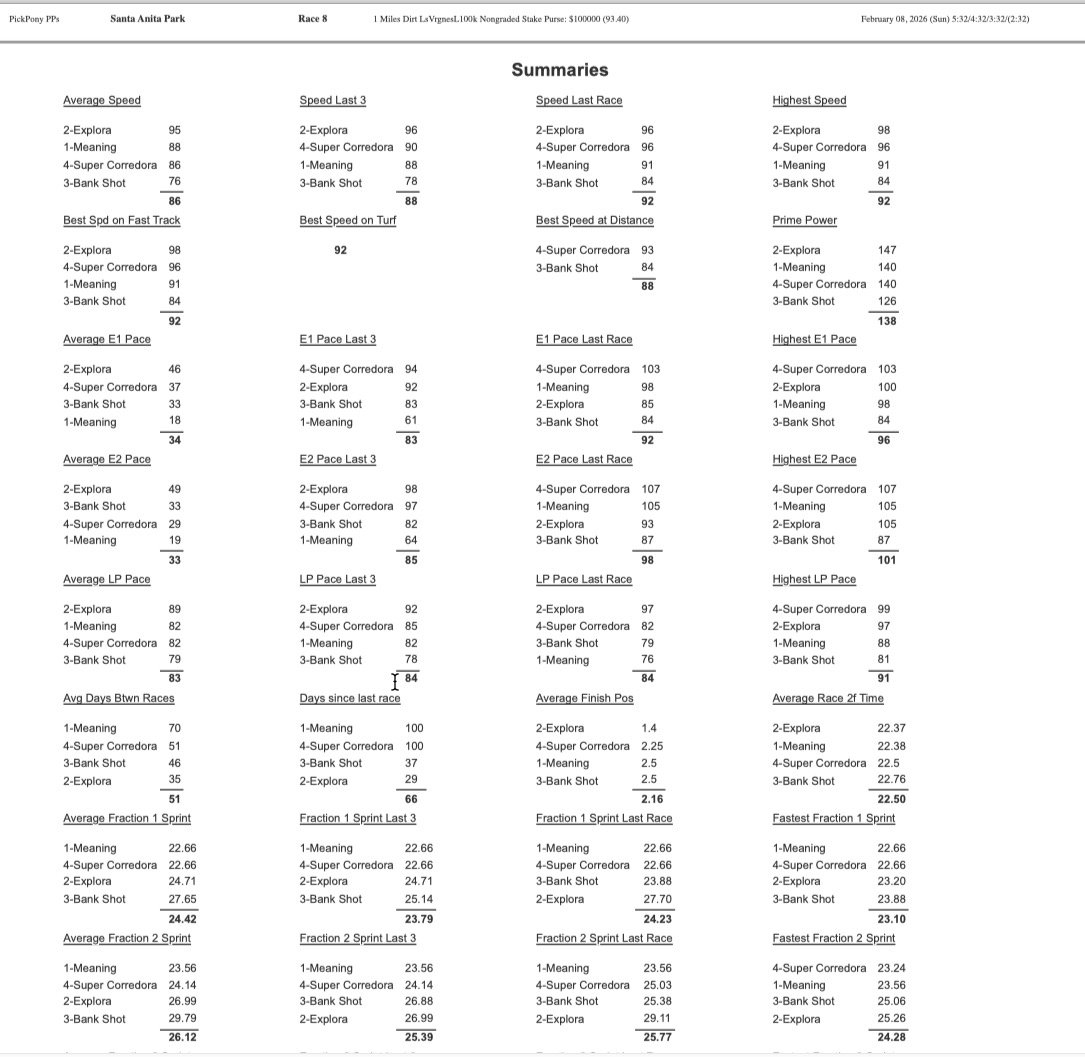
Pace Analysis
A small field of four. Explora is the speed. Super Corredora can stalk. Meaning will be closing. In a four-horse field, the pace will likely be moderate, favoring the front-runner.
Key Contenders
Explora (2) is the selection. She won the Santa Ynez impressively and has the tactical speed to control this race from the start. Baffert dominates these local preps.
Super Corredora (4) is the champion. She beat Explora in the Breeders' Cup, but this is a prep race, and she might not be fully cranked. However, her class is undeniable.
Secondary Choices
Meaning (1) is a nice filly but lacks the raw brilliance of the top two. She will be running on late for a piece.
Longshots
Bank Shot (3) is simply outclassed on paper. It would be a massive upset if she won.
Betting Strategy
This is a match race. Explora has the recency and pace advantage. Win bet on Explora. Cold Exacta 2-4.
Selections
Win: Explora (2) – 50% confidence
Place: Super Corredora (4) – 40% confidence
Show: Meaning (1) – 8% confidence
Alternative: Bank Shot (3) – 2% confidence
Race 9 Analysis
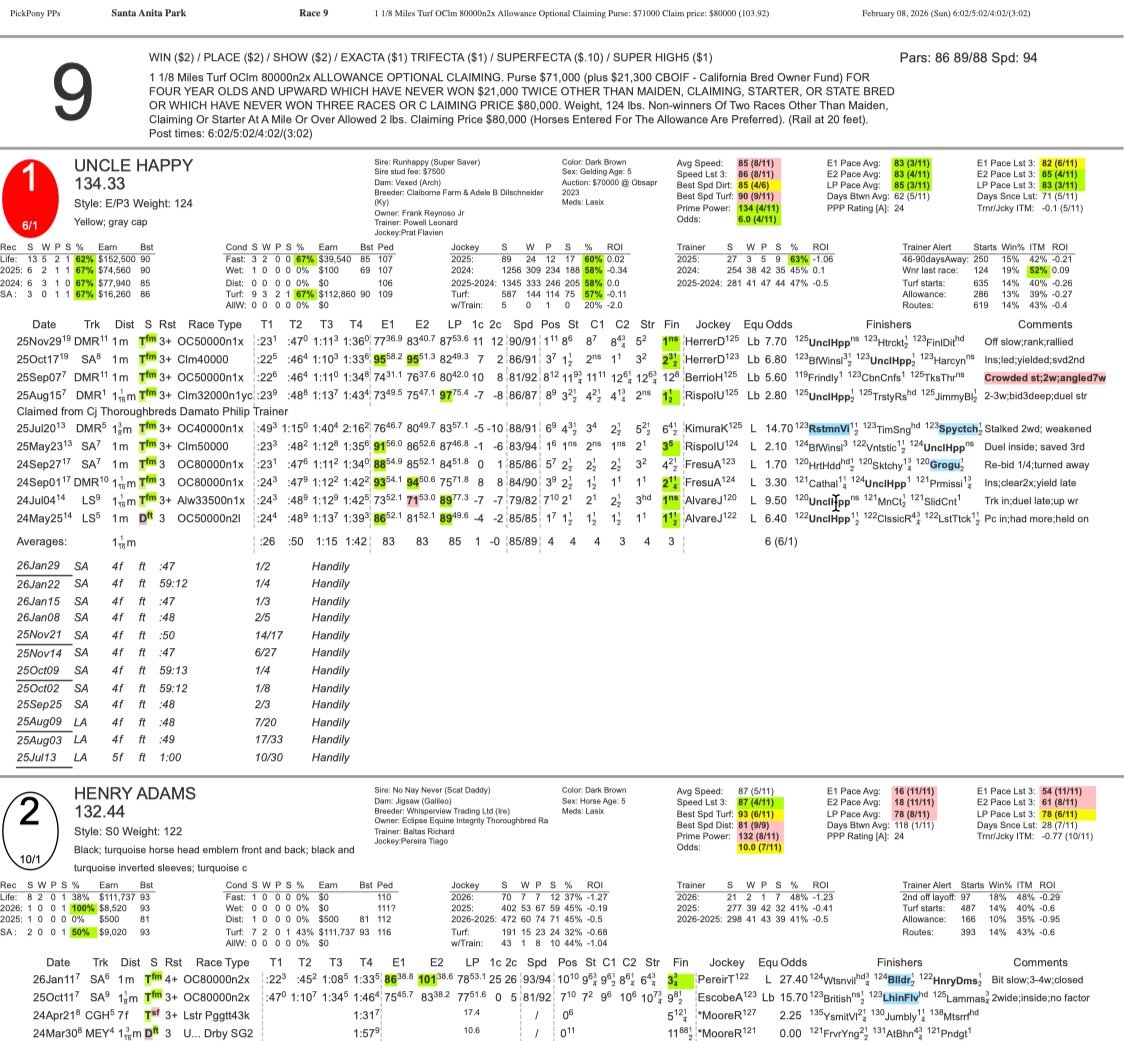
Pace Analysis
The finale is a 1 1/8 mile turf route. Balladeer and Wizard of Westwood have speed. Look for Balladeer to try to wire the field, with Wizard of Westwood applying pressure.
Key Contenders
Wizard Of Westwood (11) draws outside but has the tactical speed to clear. McCarthy has him in good form. Jaramillo is a good fit for a horse that wants to be forwardly placed.
Genius Jimmy (7) is another McCarthy runner. Juan Hernandez chooses this mount, which is a significant tell. He has a strong turn of foot.
Secondary Choices
Balladeer (4) is a dangerous front-runner. If Desormeaux can get him to relax on the lead, he can take this field wire-to-wire.
Packs A Wahlop (3) has back class. He was a graded stakes winner at 2. If he can rediscover that form, he is a major player.
Longshots
Uncle Happy (1) gets Flavien Prat. This horse saves ground and will be coming late. At a price, he is a must-use in exotics.
Betting Strategy
Wizard of Westwood and Genius Jimmy are the keys. A tough race to end the card.
Selections
Win: Wizard Of Westwood (11) – 25% confidence
Place: Genius Jimmy (7) – 22% confidence
Show: Balladeer (4) – 18% confidence
Alternative: Uncle Happy (1) – 15% confidence

Mod1(W): 82 (1/8) Mod2(W): 75 (2/8) Mod3(W): 79 (3/8) Mod1-LS: 55 (6/8) Win Prob: 18.4% Value Score: 1.35 ★